|
Contents Of This Report: |
|
Please note that the values presented in this report are based on preliminary data. They will change when the final data are processed, but will not be replaced on these pages.
National Drought Overview
|
|
[top]
Detailed Drought Discussion
Overview
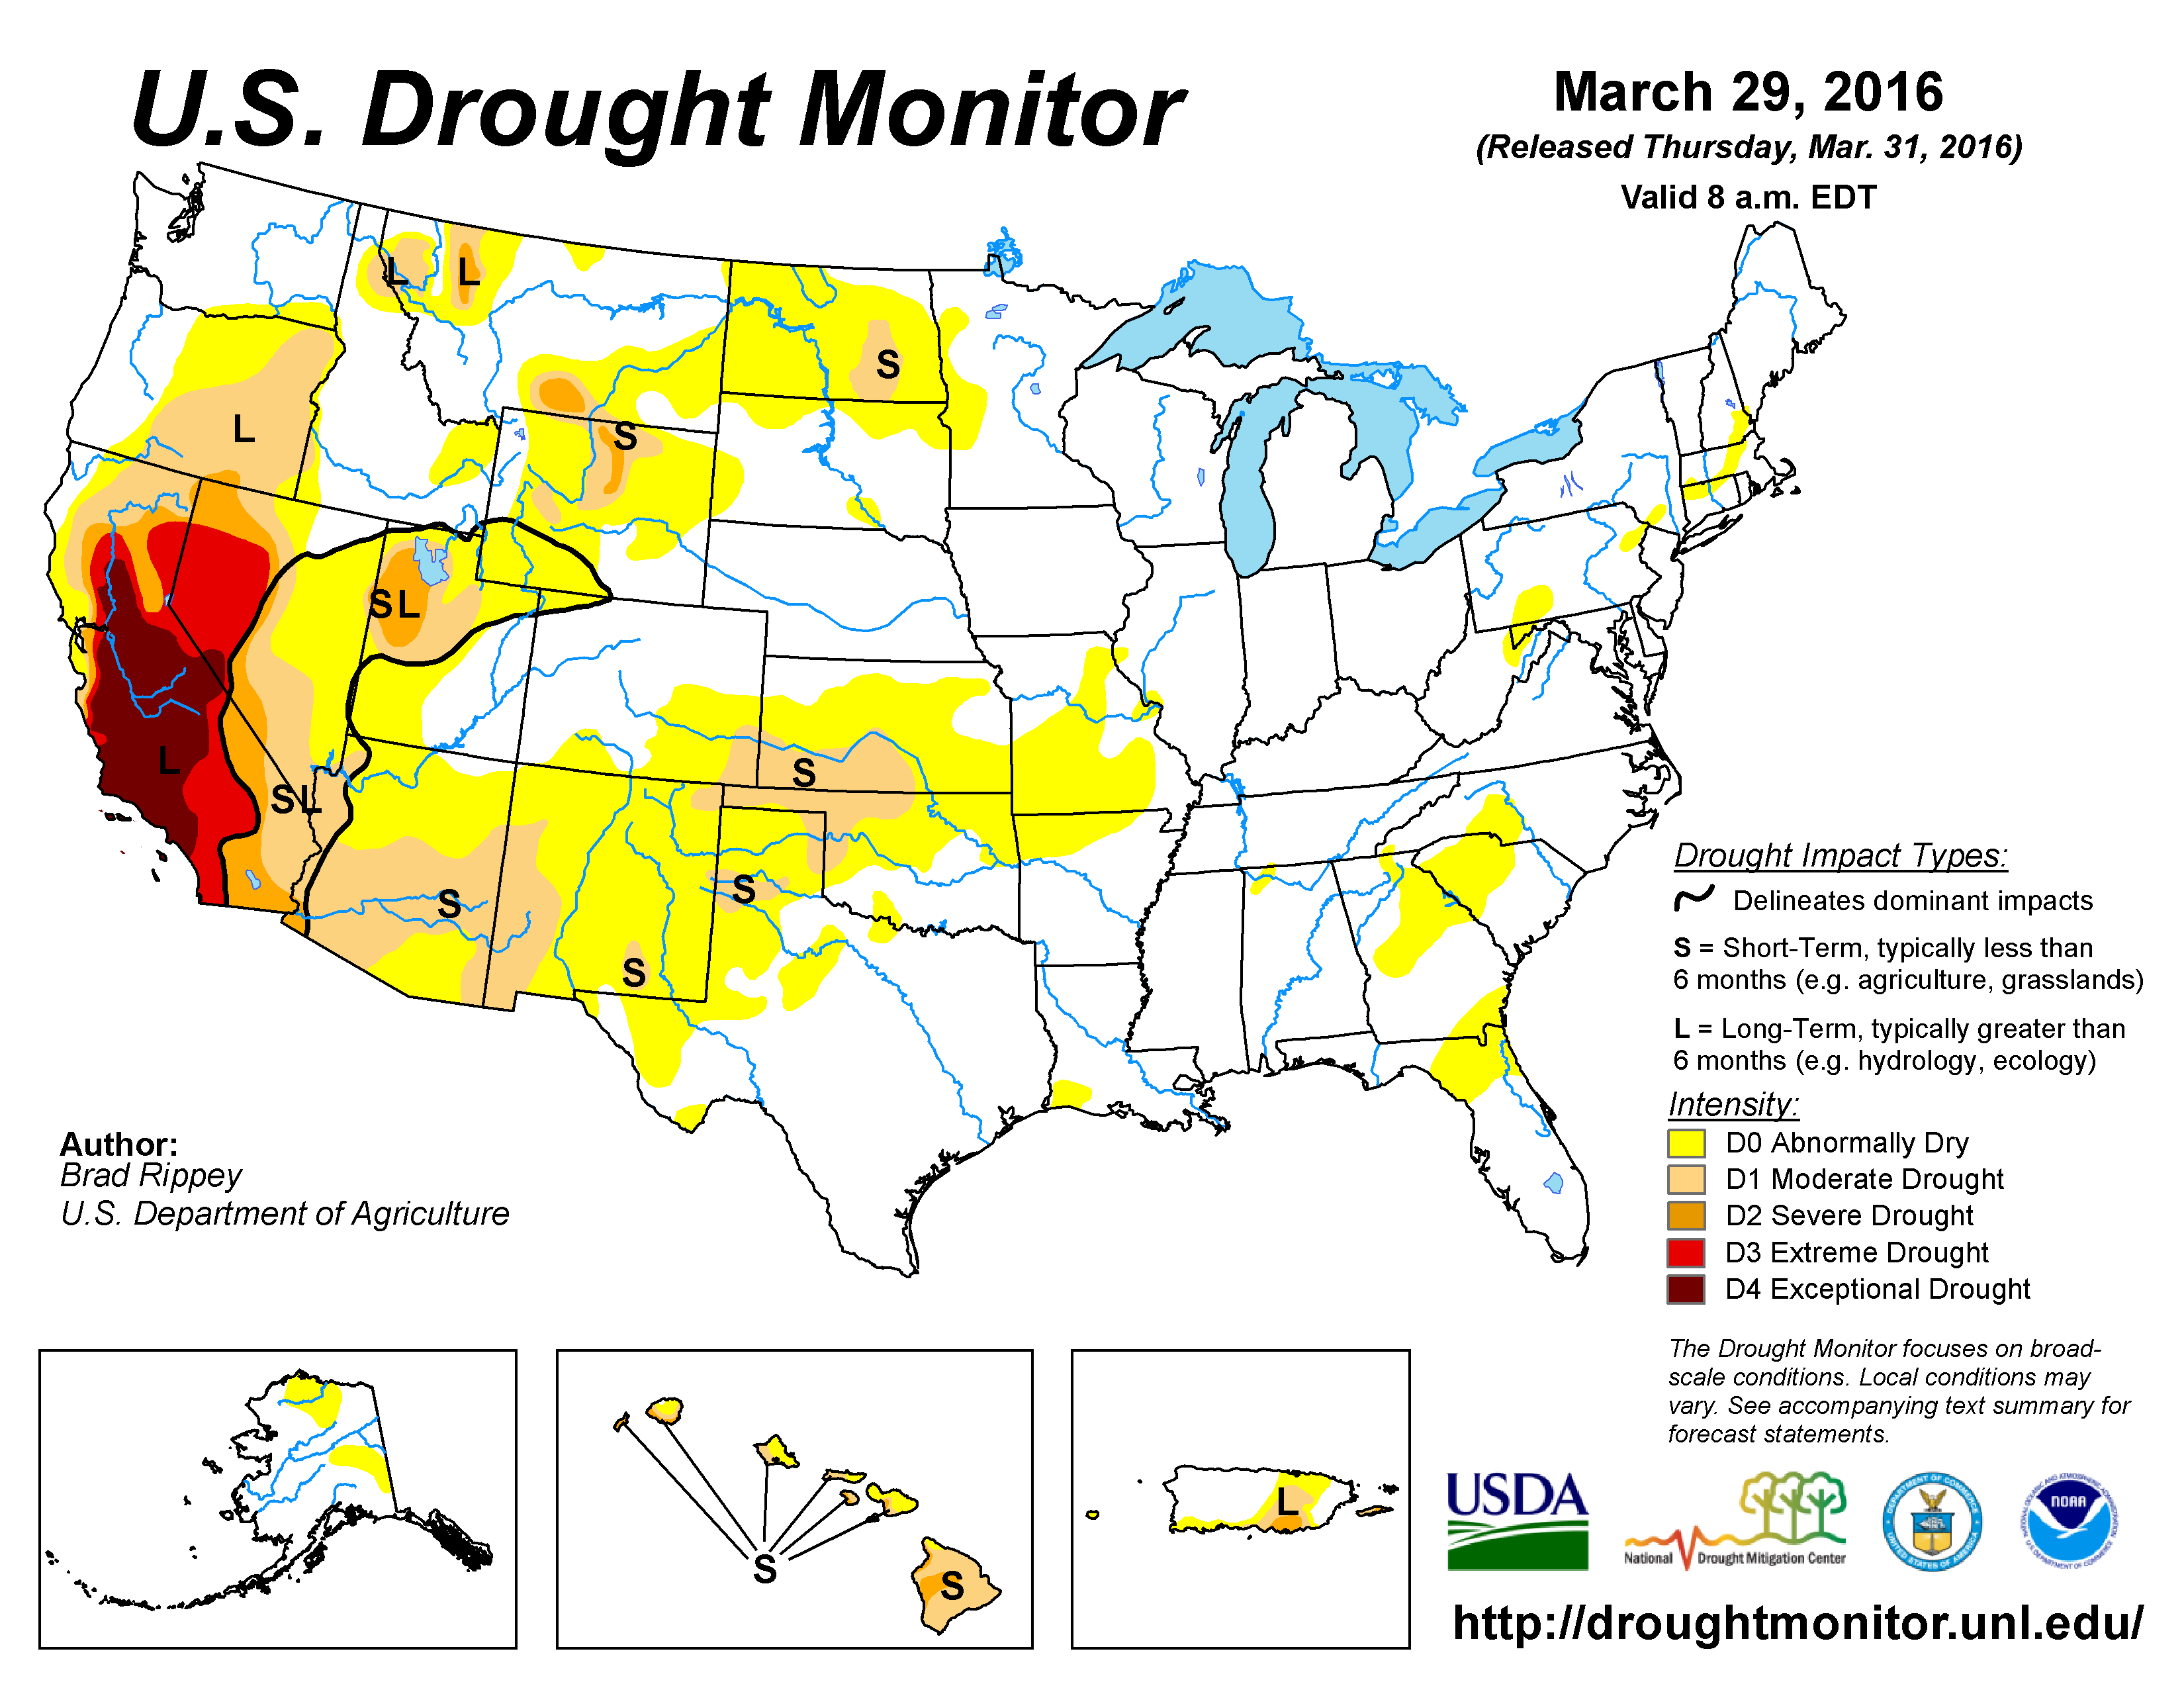
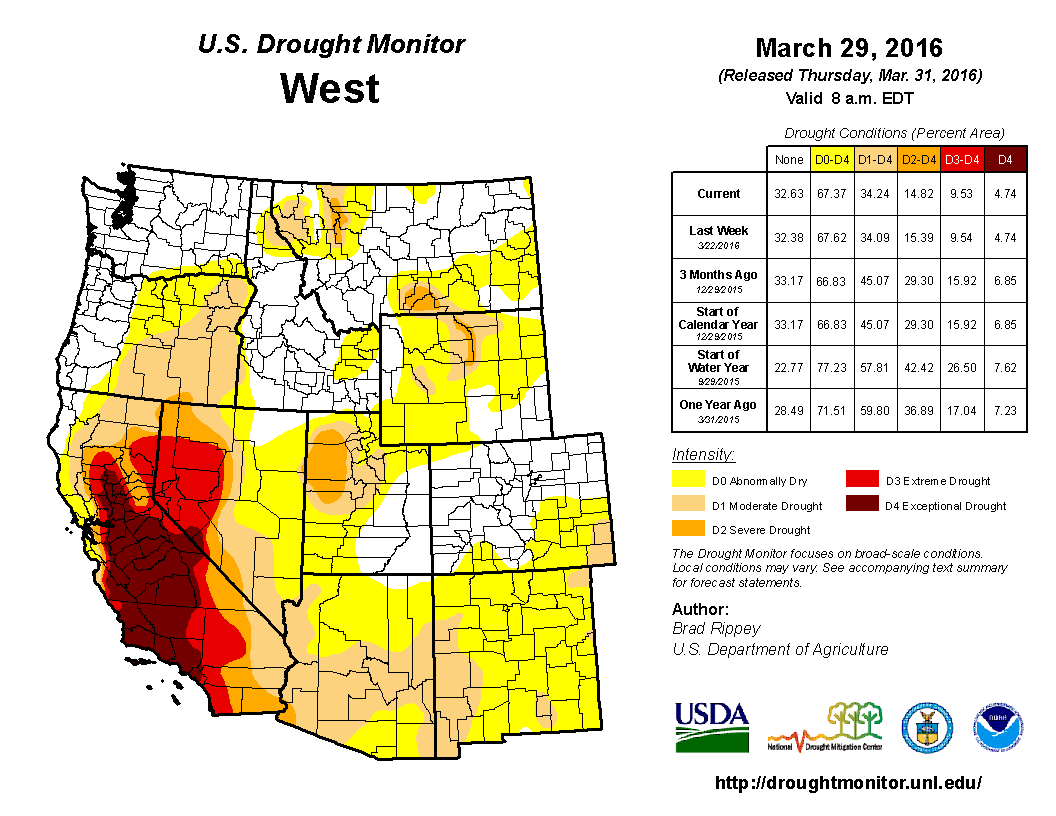
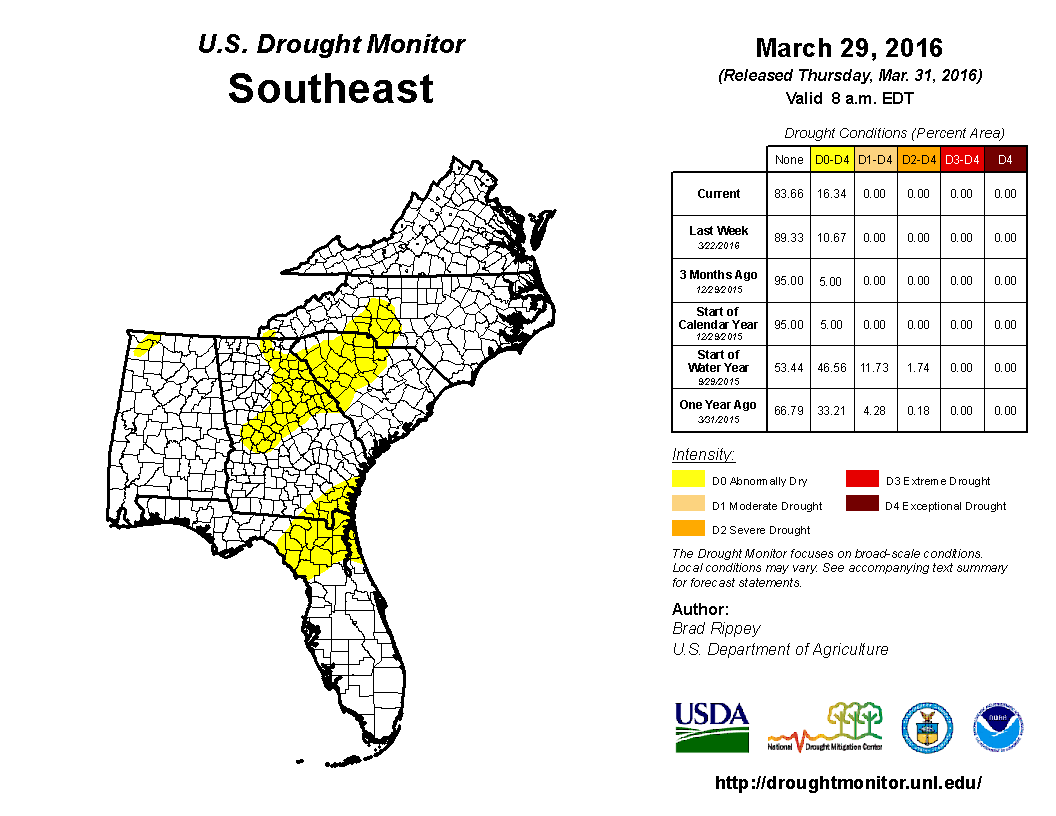
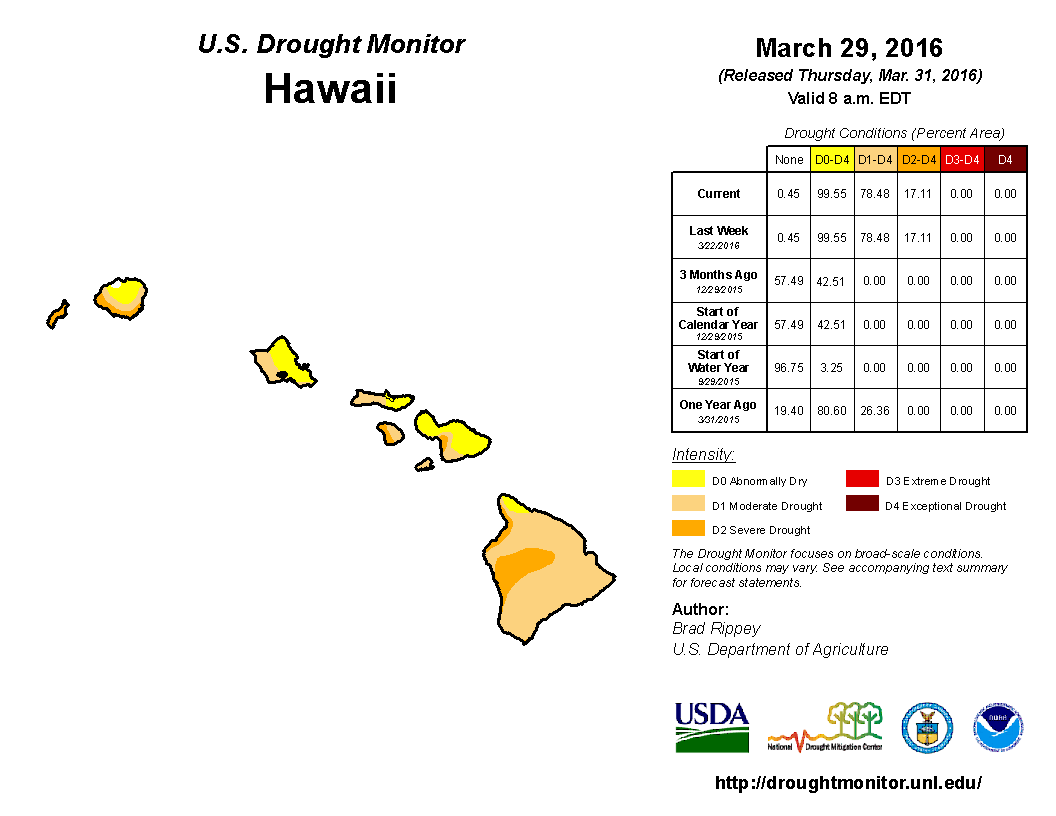
The U.S. Drought Monitor drought map valid March 29, 2016.
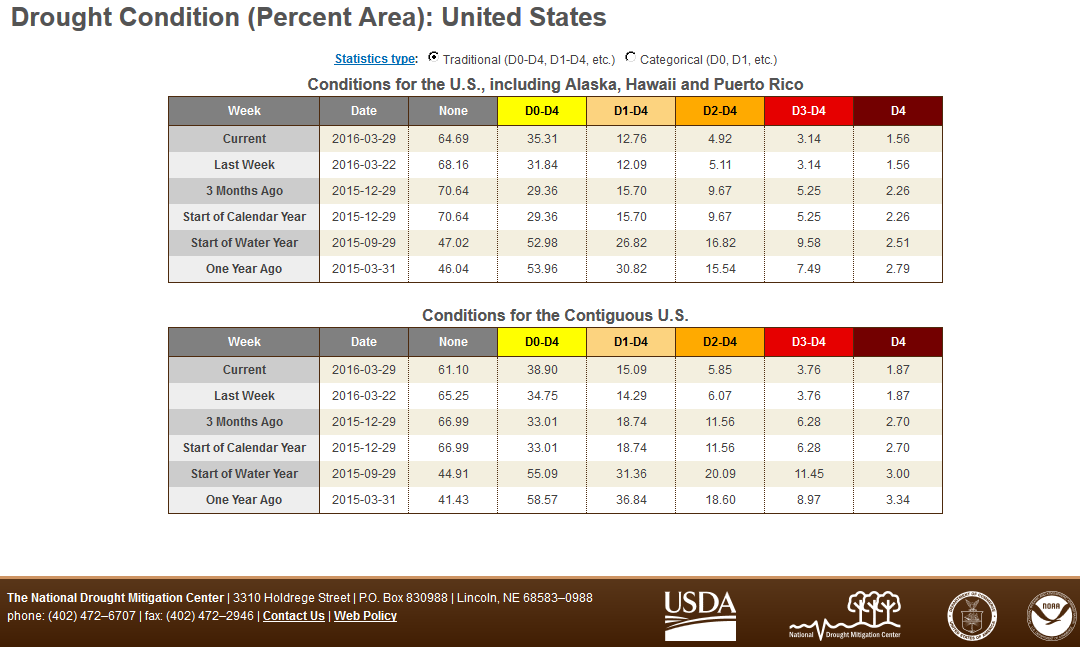
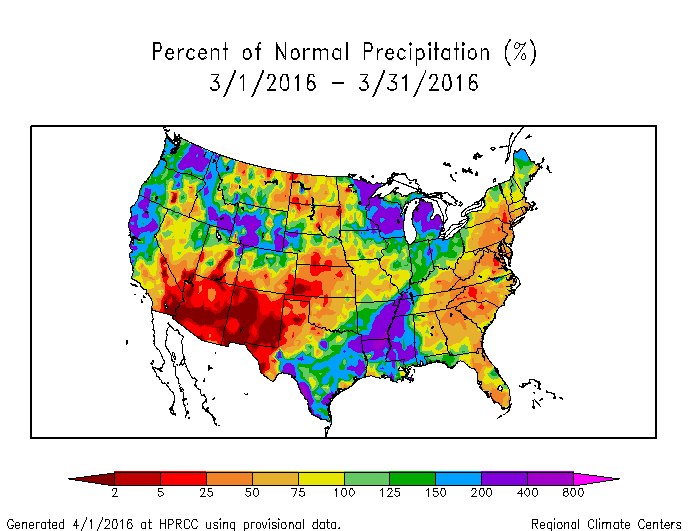
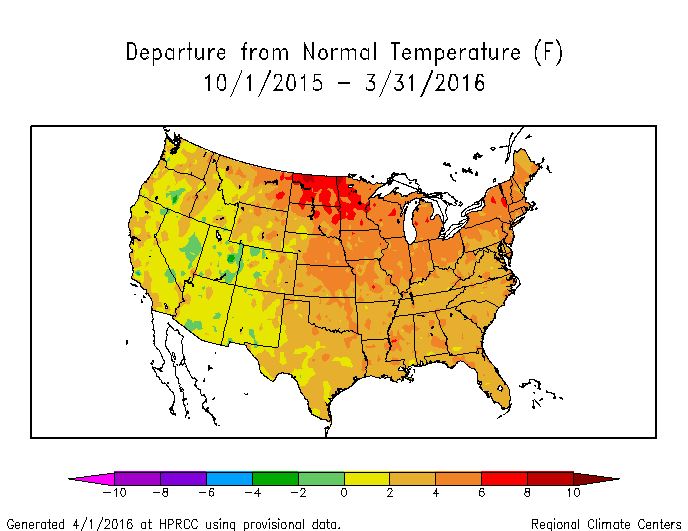
During March 2016, a strong El Niño continued to pump moisture and energy from the tropical Pacific Ocean into the atmosphere, invigorating the upper-level circulation in the mid-latitudes. Numerous weather systems in the jet stream flow moved across North America. The North Pacific subtropical high pressure center created ridging in the upper atmosphere which weakened or deflected many of the weather systems away from the southwestern CONUS, while the North Atlantic High created ridging in the eastern CONUS which weakened low pressure systems and fronts as they moved across the Southeast to southern New England, reducing their precipitation. Pacific weather systems were dried out by the Rocky Mountains by the time they reached the Great Plains. As a result of this circulation pattern, March 2016 was drier than normal from the Southwest to Central and Northern Plains, and Southeast to southern New England. Abnormal dryness or drought developed or expanded in these areas. The circulation pattern directed weather systems into Northern California and the Pacific Northwest, with many tracking across the northern CONUS. During the first half of the month, a cutoff low funneled abundant moisture into the Lower Mississippi Valley and parts of the Southern Plains. With a wetter-than-normal month, drought and abnormal dryness contracted in the West and Southern Plains. The El Niño kept Hawaii dry, but the precipitation pattern was mixed over Alaska and Puerto Rico. When integrated across the CONUS, March 2016 ranked as the 26th wettest March in the 1895-2016 record. Drought expanded more than it shrank, with the national drought footprint increasing slightly to 12.8 percent of the U.S. (15.1 percent of the CONUS). According to the Palmer Drought Index, which goes back to the beginning of the 20th century, about 8.7 percent of the CONUS was in moderate to extreme drought at the end of March, an increase of about 1.6 percent compared to last month.
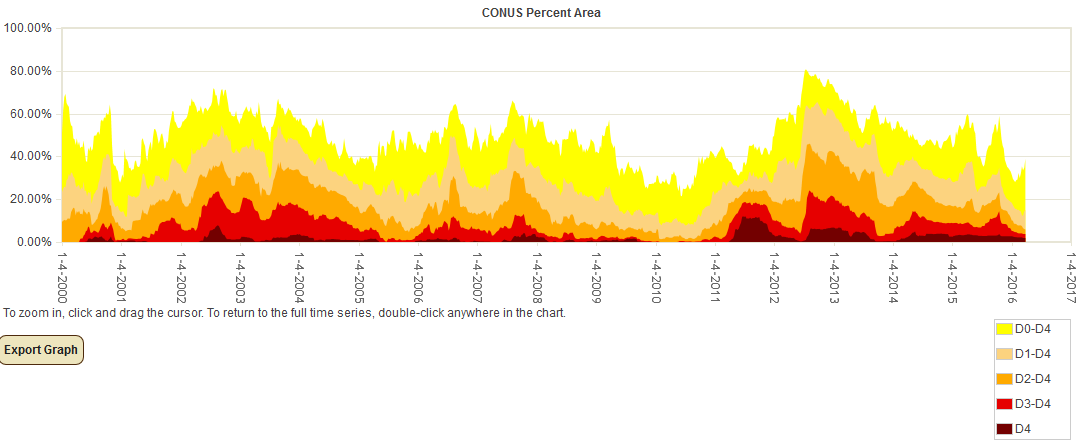
Percent area of the CONUS in moderate to exceptional drought, January 4, 2000 to present, based on the U.S. Drought Monitor.
Palmer Drought Index
The Palmer drought indices measure the balance between moisture demand (evapotranspiration driven by temperature) and moisture supply (precipitation). The Palmer Z Index depicts moisture conditions for the current month, while the Palmer Hydrological Drought Index (PHDI) and Palmer Drought Severity Index (PDSI) depict the current month's cumulative moisture conditions integrated over the last several months. While both the PDSI and PHDI indices show long-term moisture conditions, the PDSI depicts meteorological drought while the PHDI depicts hydrological drought. The PDSI map shows less severe and extensive drought in parts of the West than the PHDI map because the meteorological conditions that produce drought and wet spell conditions are not as long-lasting as the hydrological impacts.
|
 |
Used together, the Palmer Z Index and PHDI maps show that short-term dry conditions occurred over much of the Southwest, Central to Northern Plains, and Southeast to southern New England. In the Great Plains and Southeast, this short-term dryness reduced the long-term wet conditions in March compared to February, while it expanded drought in Arizona, intensified in southern New England, and developed in southeast Georgia. Short-term wet conditions contracted long-term drought in the Pacific Northwest to Northern California and expanded long-term wet conditions into the Lower Mississippi Valley.
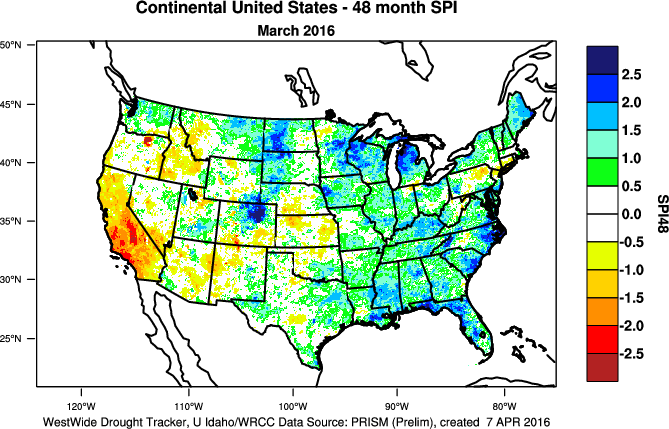
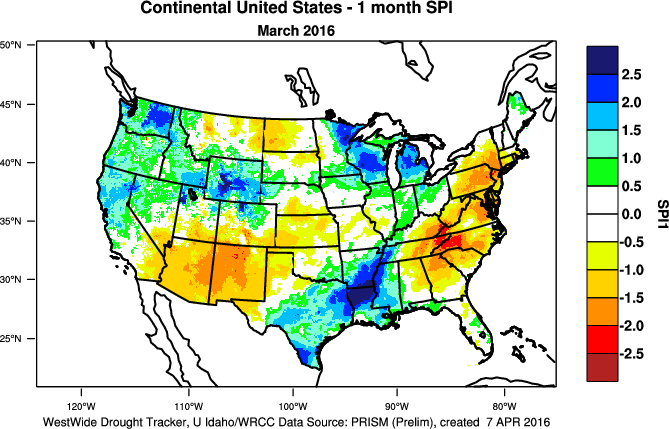
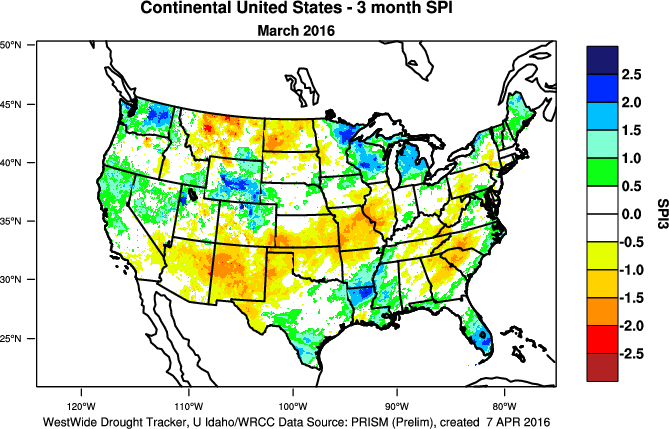
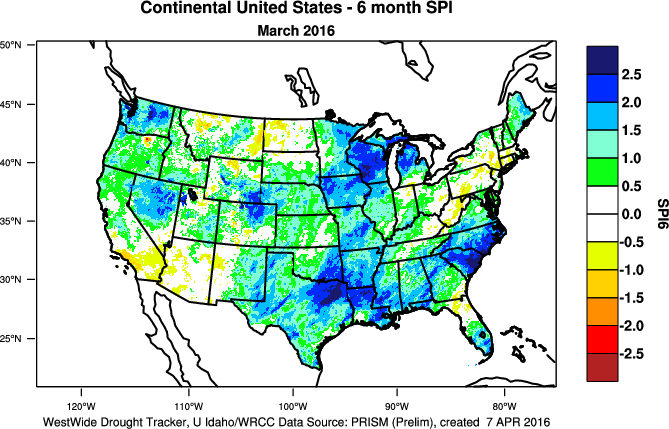
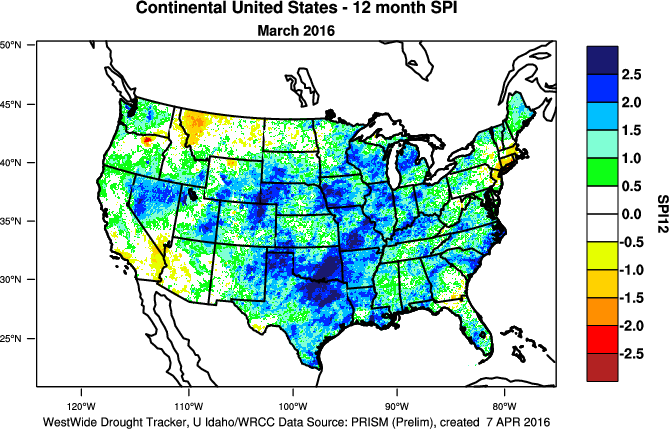
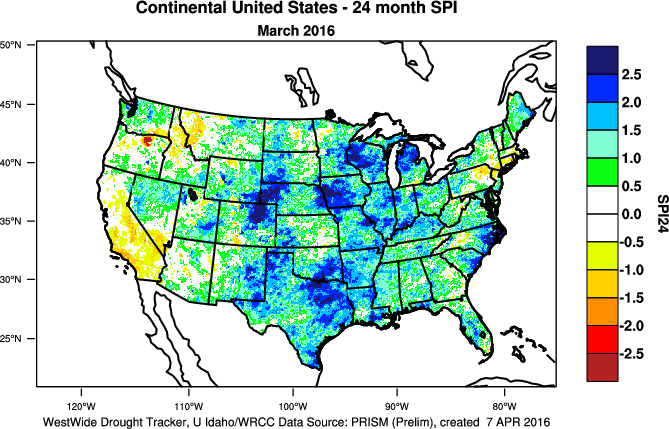
Standardized Precipitation Index
The Standardized Precipitation Index (SPI) measures moisture supply. The SPI maps here show the spatial extent of anomalously wet and dry areas at time scales ranging from 1 month to 24 months.
 |
 |
 |
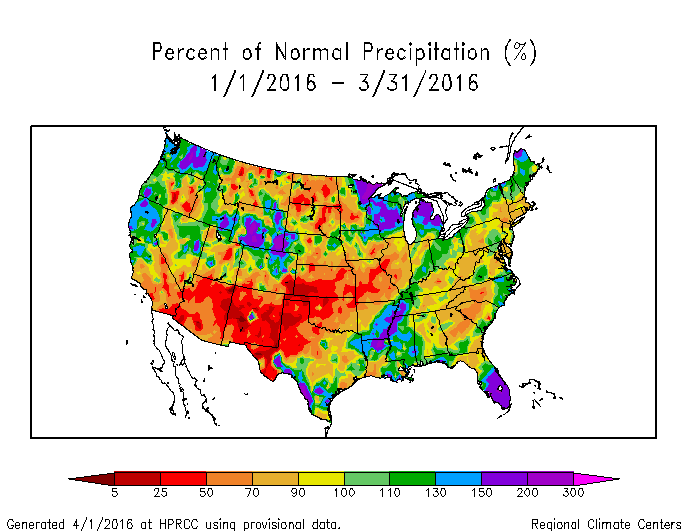
The SPI maps illustrate how moisture conditions have varied considerably through time and space over the last two years. Dryness dominates the Southwest and parts of the Central and Northern Plains at the 1- to 3-month time scales, extending into the Mid-Mississippi Valley at 2 to 3 months. Dryness is widespread from the Southeast to southern New England at 1 month, and persists across parts of this region at 2 to 3 months, especially in the Southeast. Parts of southern New England are dry at all time scales. Parts of the Northern Plains to Northern Rockies are dry at 9 to 24 months, and parts of Southern California are dry at 6 to 24 months. Wet conditions dominate in the Northwest to Northern Rockies at 1 month and parts of this region at 2 to 24 months. The Great Lakes and Lower Mississippi Valley are wet at 1 to 3 months. Wet conditions dominate much of the CONUS from 6 to 24 months.
 |
 |
 |
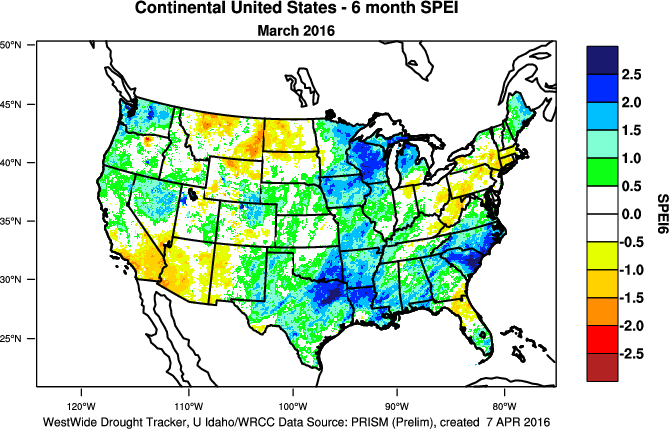
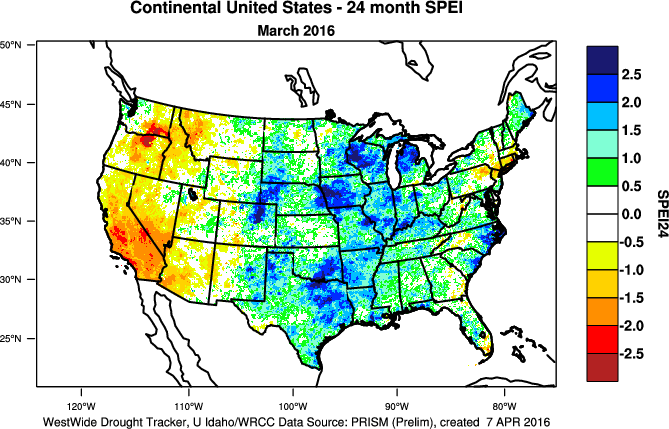
Standardized Precipitation Evapotranspiration Index
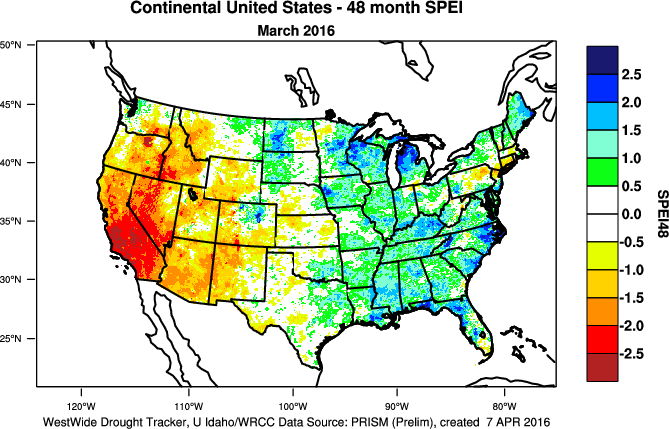
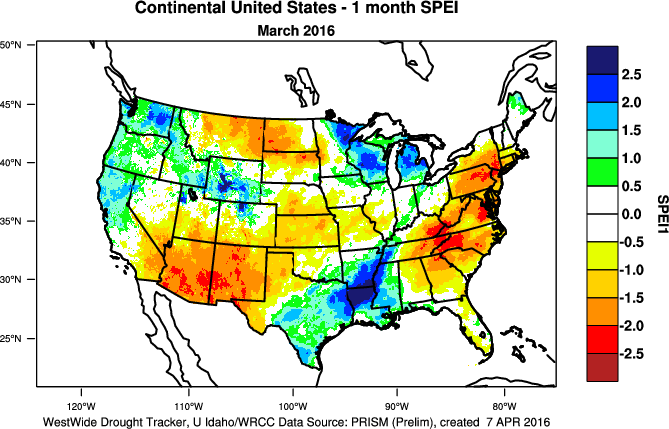
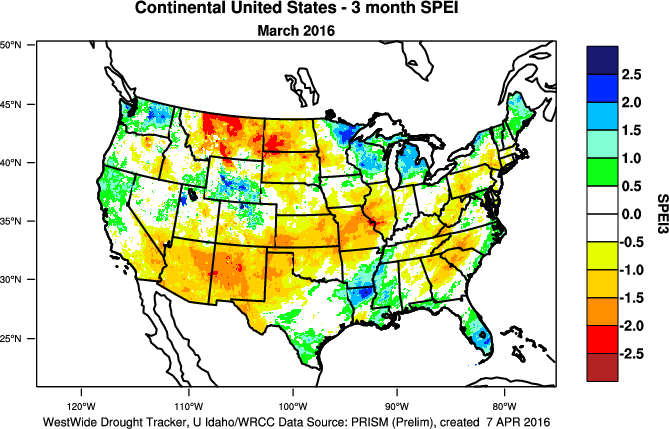
The SPI measures water supply (precipitation), while the SPEI (Standardized Precipitation Evapotranspiration Index) measures the combination of water supply (precipitation) and water demand (evapotranspiration as computed from temperature). Warmer temperatures tend to increase evapotranspiration, which generally makes droughts more intense.
 |
 |
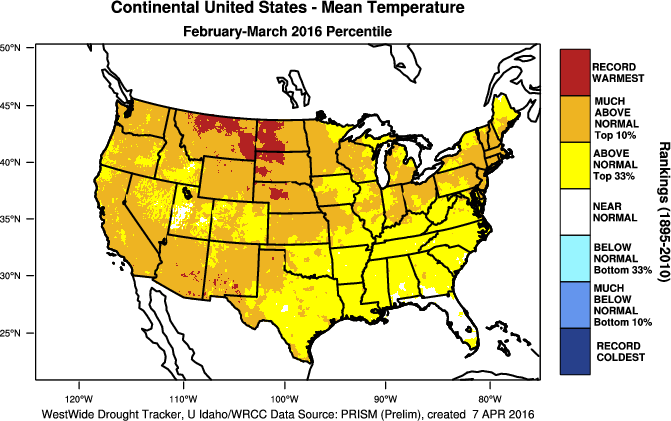
Temperatures were much warmer than normal across most of the CONUS during March 2016. With this being the beginning of spring, evapotranspiration is just beginning to increase, so the differences between SPEI and SPI will not be as extreme as they will be during the summer months. But even so, the March 1-month SPEI shows areas of greater drought-related stress than the corresponding SPI map, as does the 3-month map (SPEI vs. SPI).
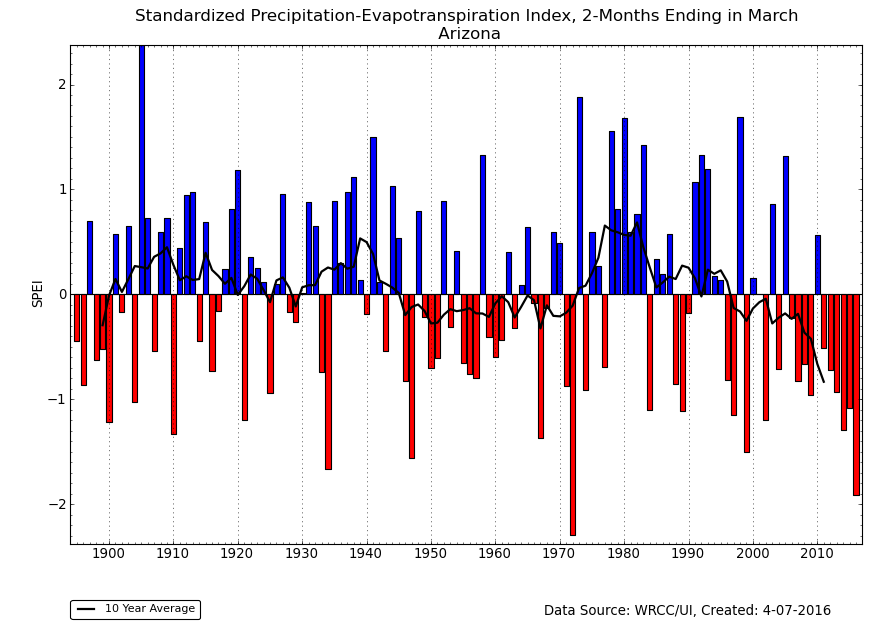
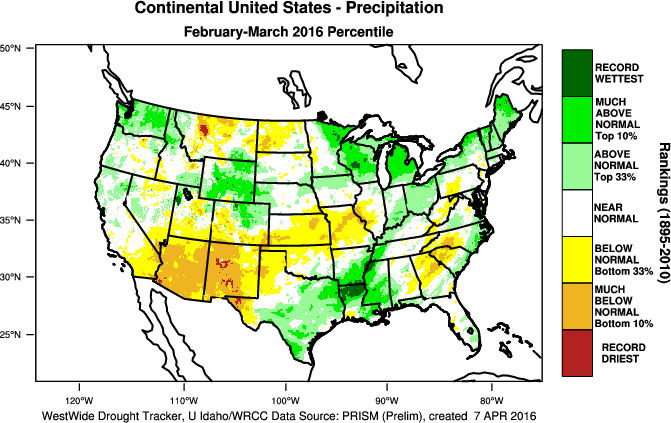
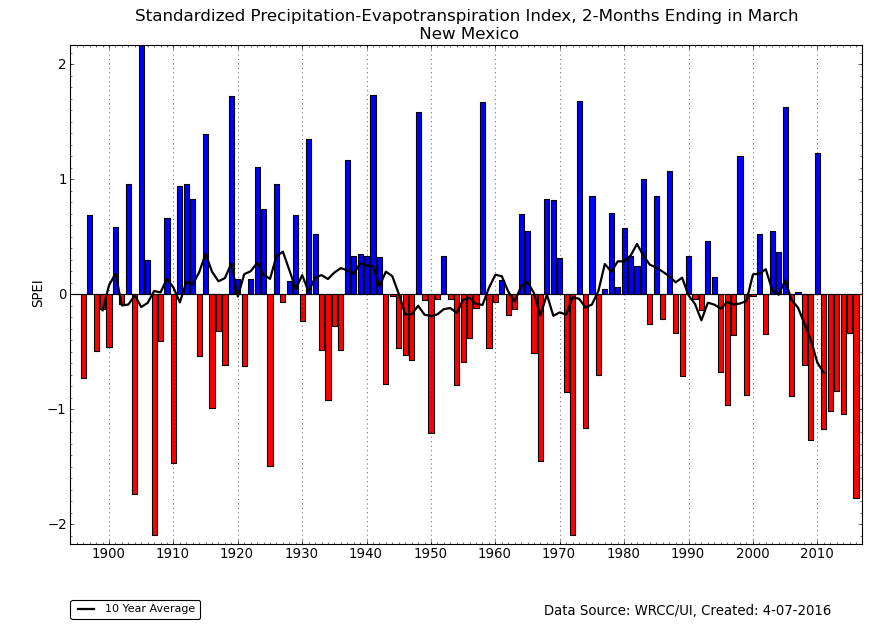
The last two months were unusually warm and dry in parts of the Southwest. Arizona had its second warmest and fourth driest February-March in the 1895-2016 record, resulting in the second most extreme 2-month SPEI for March. New Mexico had its second warmest and second driest February-March, resulting in its third most extreme 2-month SPEI for March.
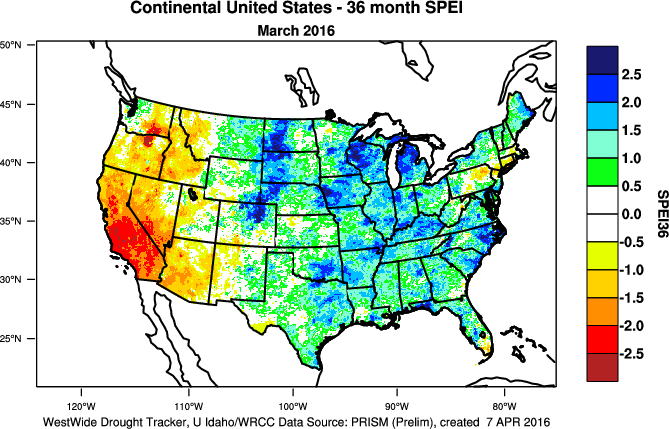
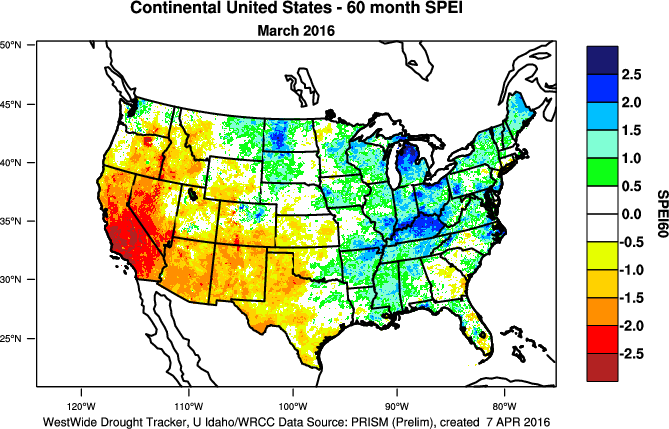
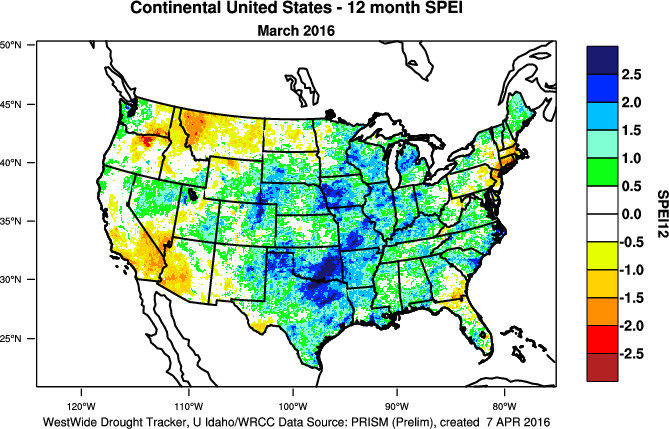
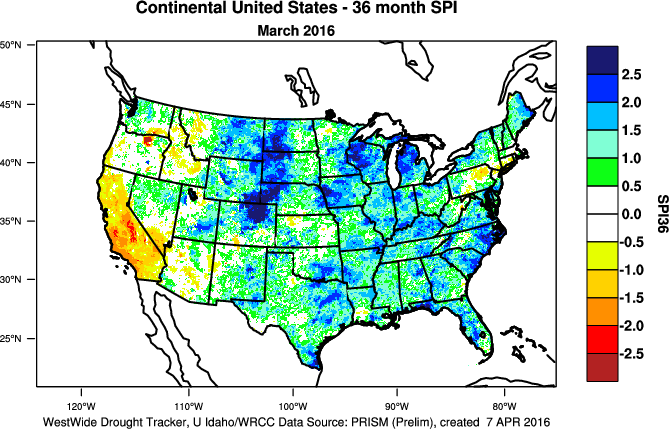
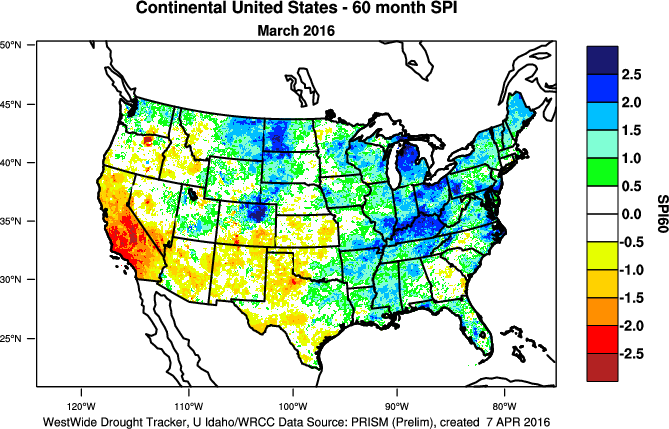
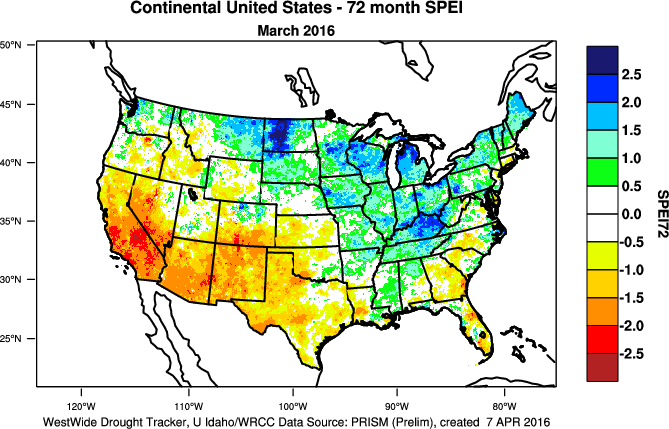
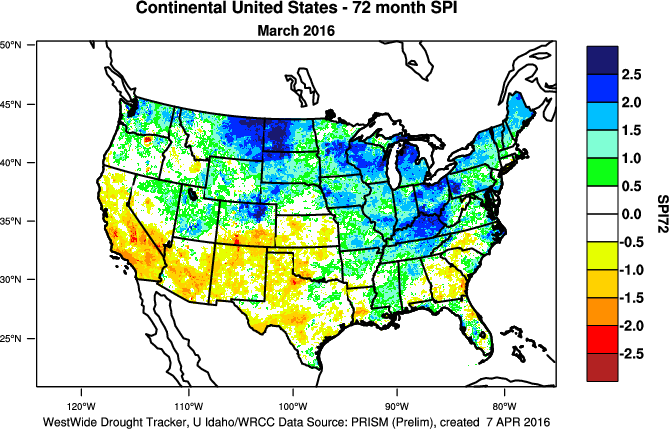
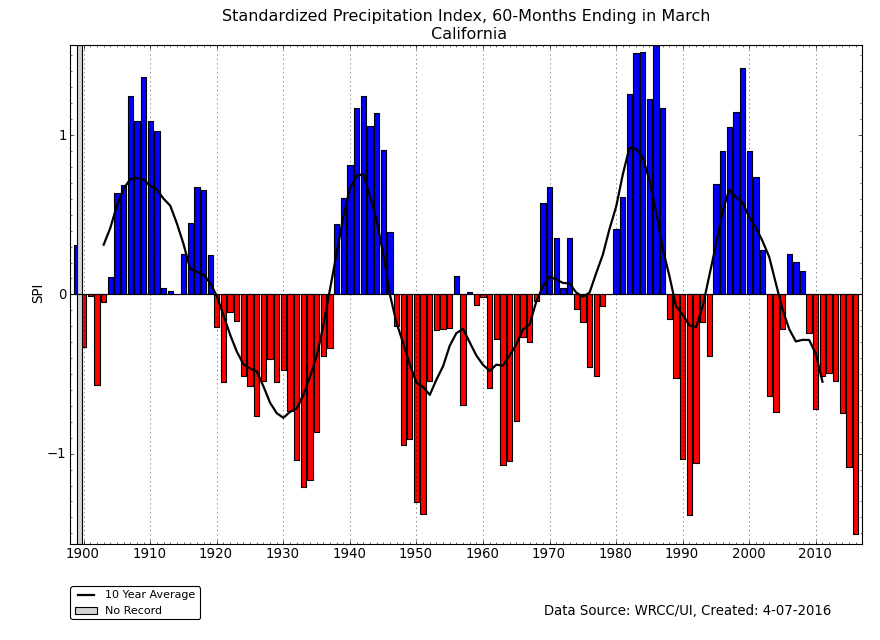
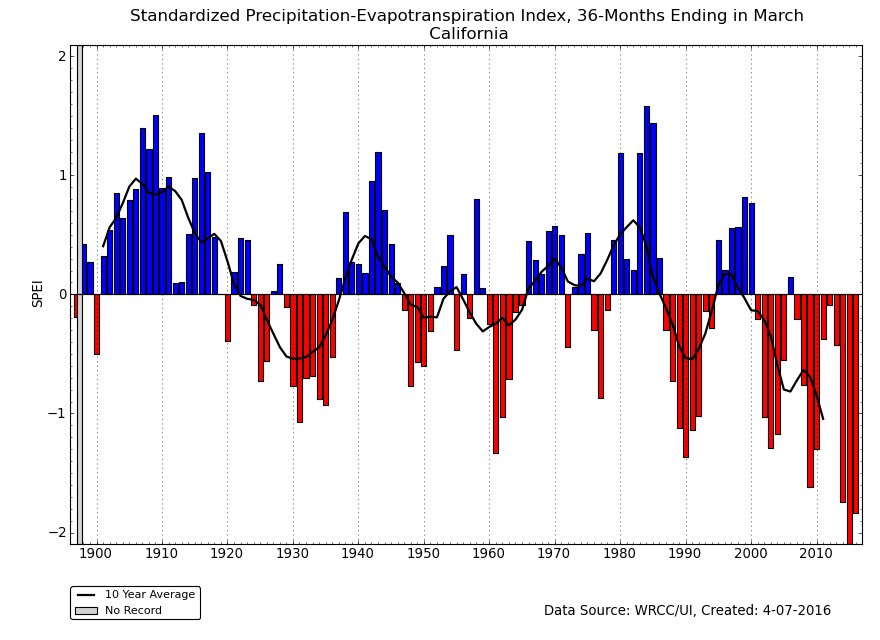
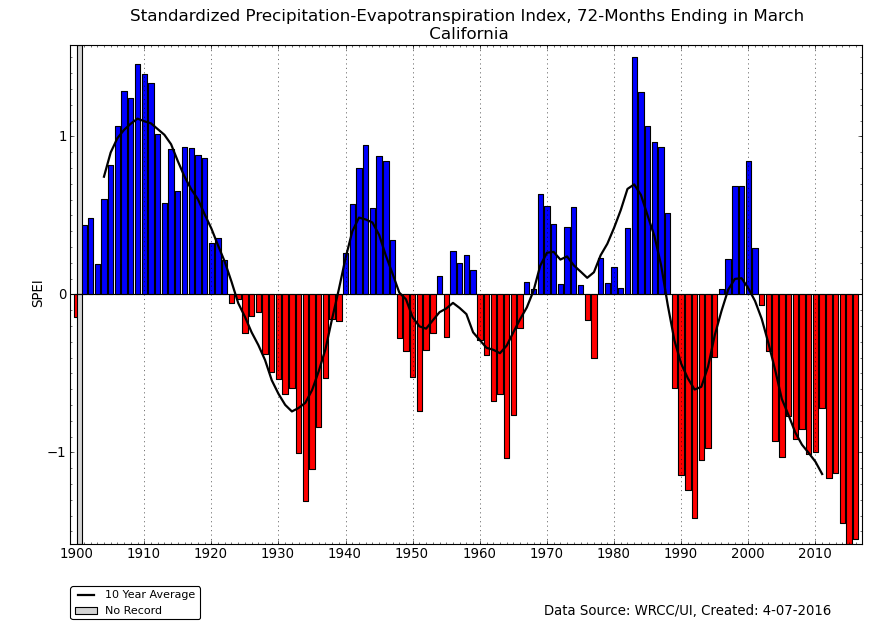
The last 6 (SPEI vs. SPI) to 12 (SPEI vs. SPI) months were unusually wet in most locations, so the SPEI and SPI maps are similar. Significant differences between the SPEI and SPI maps begin to appear in the West at the 24-month time frame (SPEI vs. SPI) and become increasingly significant at the 36-month (SPEI vs. SPI), 48-month (SPEI vs. SPI), 60-month (SPEI vs. SPI), and even 72-month (SPEI vs. SPI) time scales. This is due to persistent above-normal temperatures in the West for the last several years which have increased evapotranspiration and exacerbated drought conditions.
 |
|
 |
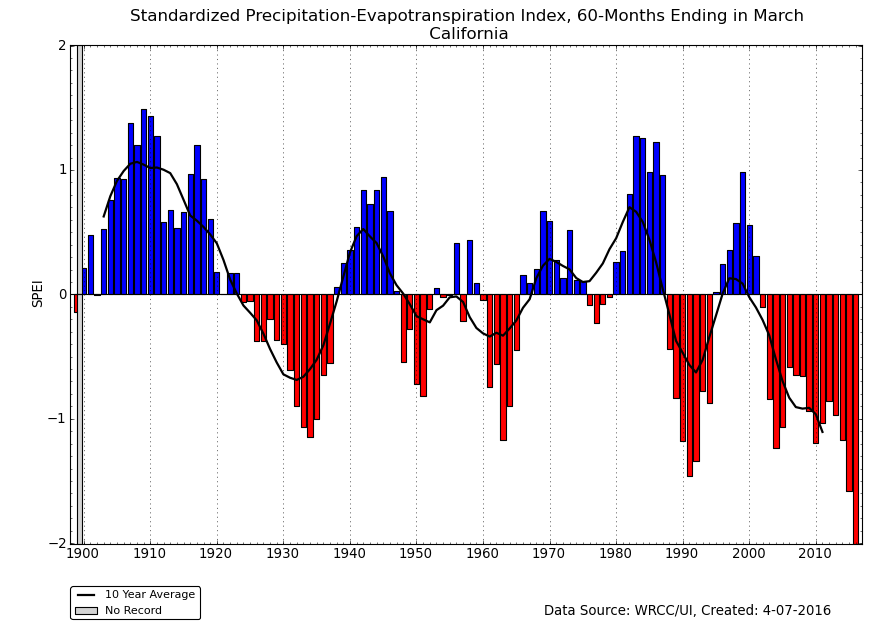
This is especially the case in California, where the last three April-March 12-month periods ranked as the warmest, second warmest, and third warmest such periods for the state in the 1895-2016 record, and all three were much warmer than all of the years before them. The last three years cap a period of persistent unusual warmth which has lasted over three decades. The precipitation so far this wet season helped raise California's statewide precipitation rank to 47th wettest for April 2015-March 2016. But the persistent dryness over the last nine years still gave the state the driest SPI for the last 60 months and a top-ten driest SPI for the last 36, 48, and 72 months. When the temperature is factored in, California has had the most severe SPEI for the last 60 months, and second most severe SPEI for the last 36, 48, and 72 months; the statewide SPEI ties for fourth most severe over the last 24 months.
 |
 |
Regional Discussion
 |
 |
CONUS Agricultural & Hydrological Impacts:
Drought conditions were reflected in numerous agricultural, hydrological, and other meteorological indicators, both observed and modeled. As of March 29th, 14 percent of the nation's cattle inventory, eight percent of the nation's hay, 13 percent of winter wheat production, three percent of corn production, and two percent of soybean production were in drought. Except for hay, these are increases compared to a month ago.
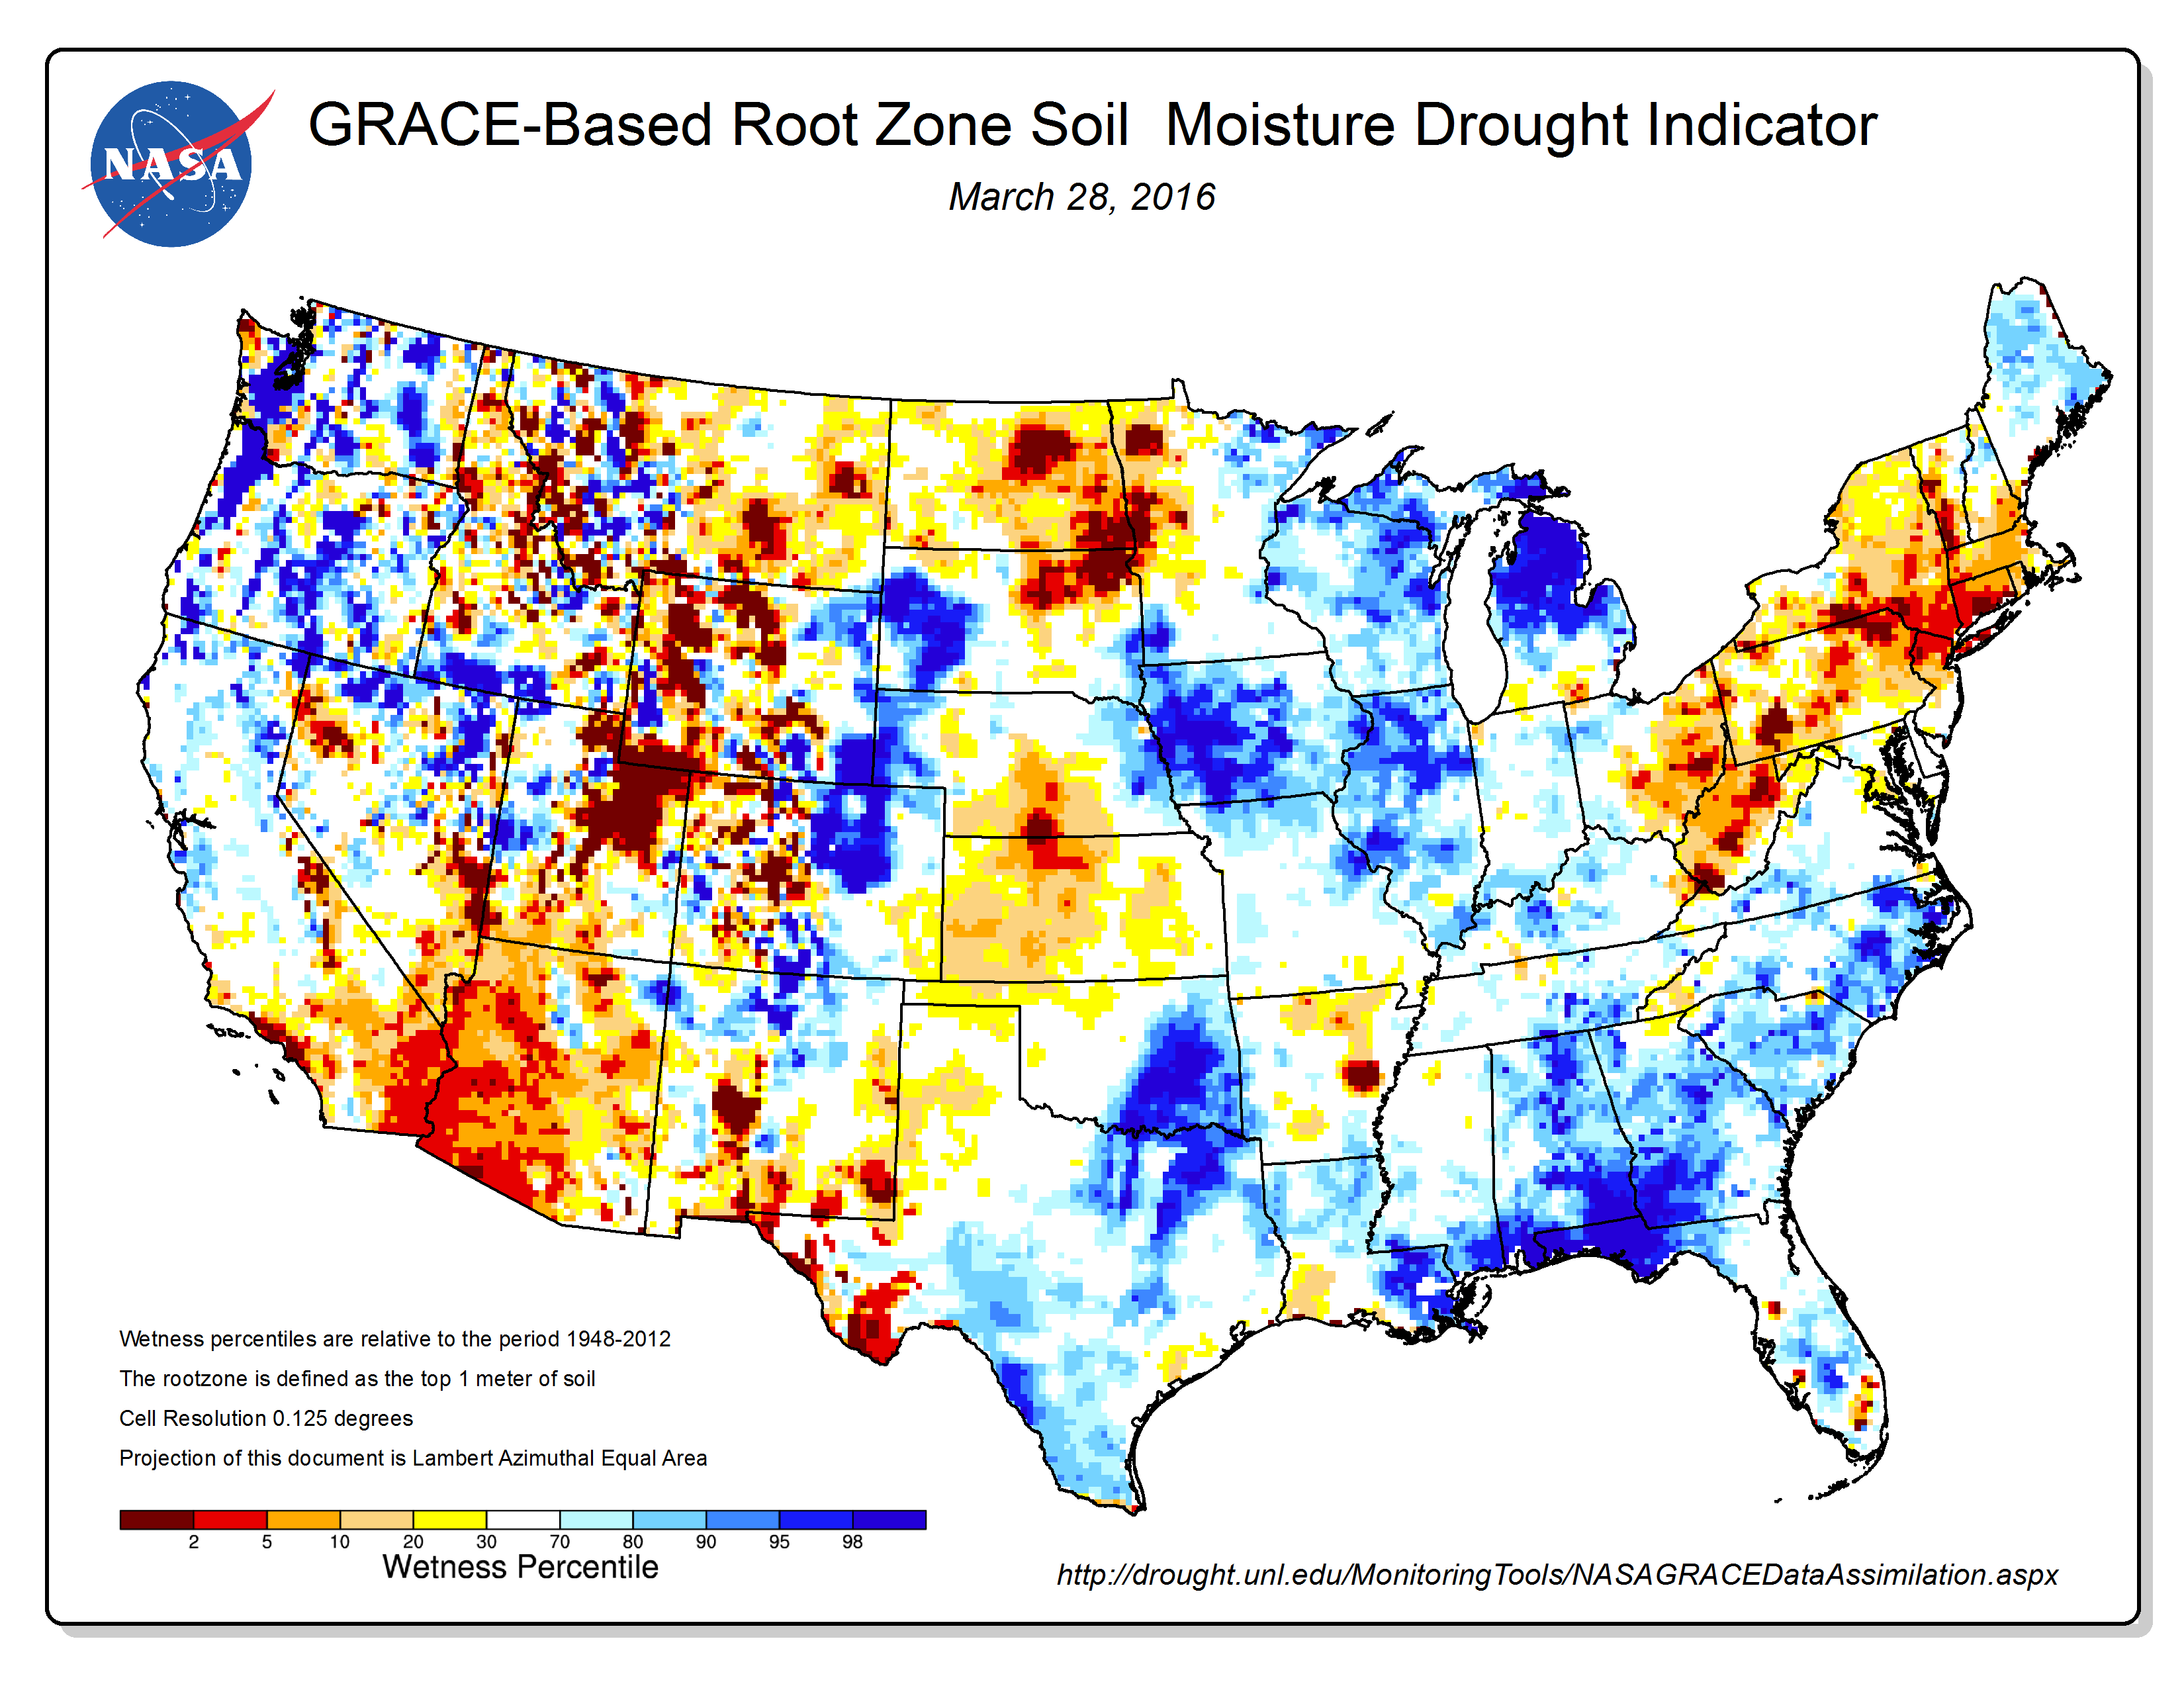
The below-normal precipitation in March and for the year to date dried soils in the East, but soil moisture there was still mostly adequate. Soils also continued to dry out from the Southwest to Central Plains.
According to March 27th U.S. Department of Agriculture (USDA) reports, more than a fourth of the topsoil moisture was short or very short (dry or very dry) across much of the Plains and Southwest, with more than half short or very short in Kansas (53 percent), California (55 percent), and New Mexico (81 percent). The
April 3rd USDA reports for subsoil moisture had more than half short or very short in Montana (59 percent) and California (65 percent). Nationwide, as of April 3rd, 21 percent of the nation's topsoil and 20 percent of the subsoil was short or very short of moisture.
Drought conditions at the end of the month, as depicted on the March 29th USDM map, included the following CONUS core drought and abnormally dry areas:
- Moderate (D1) to severe (D2) drought covered a large part of the western U.S., with extreme (D3) to exceptional (D4) drought extending from California into Nevada. —
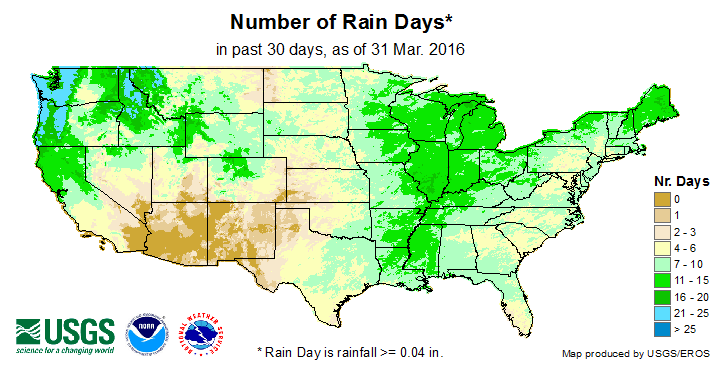
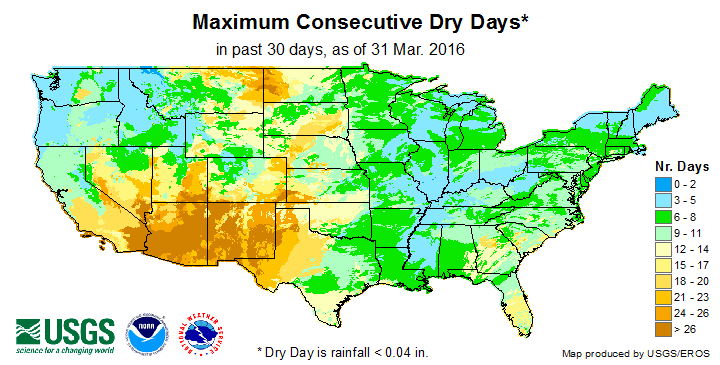
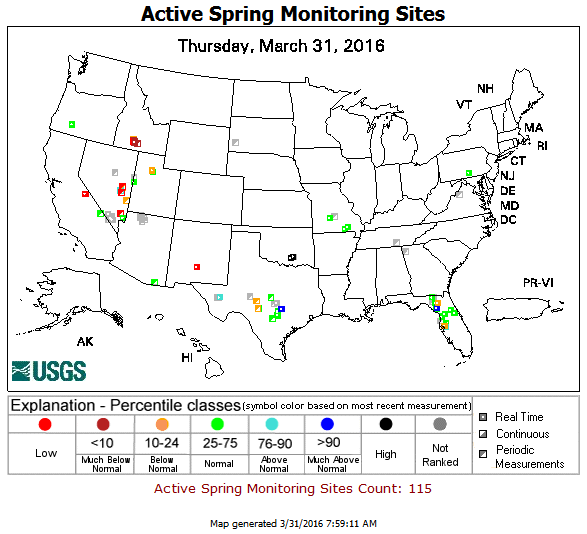
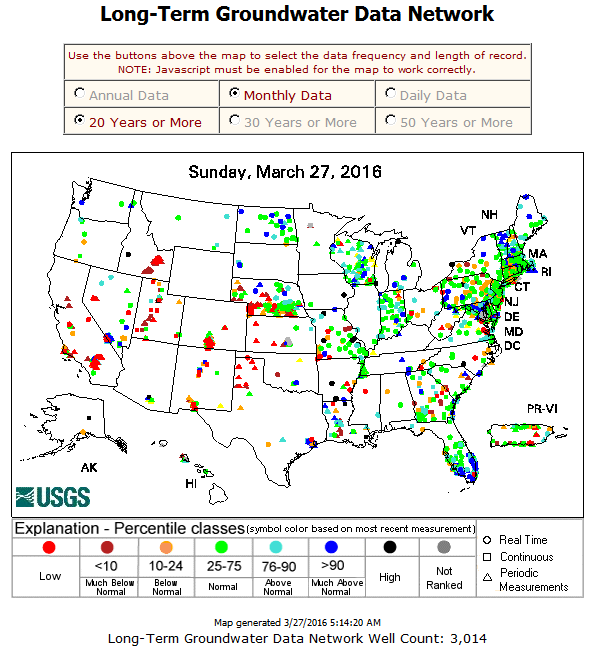
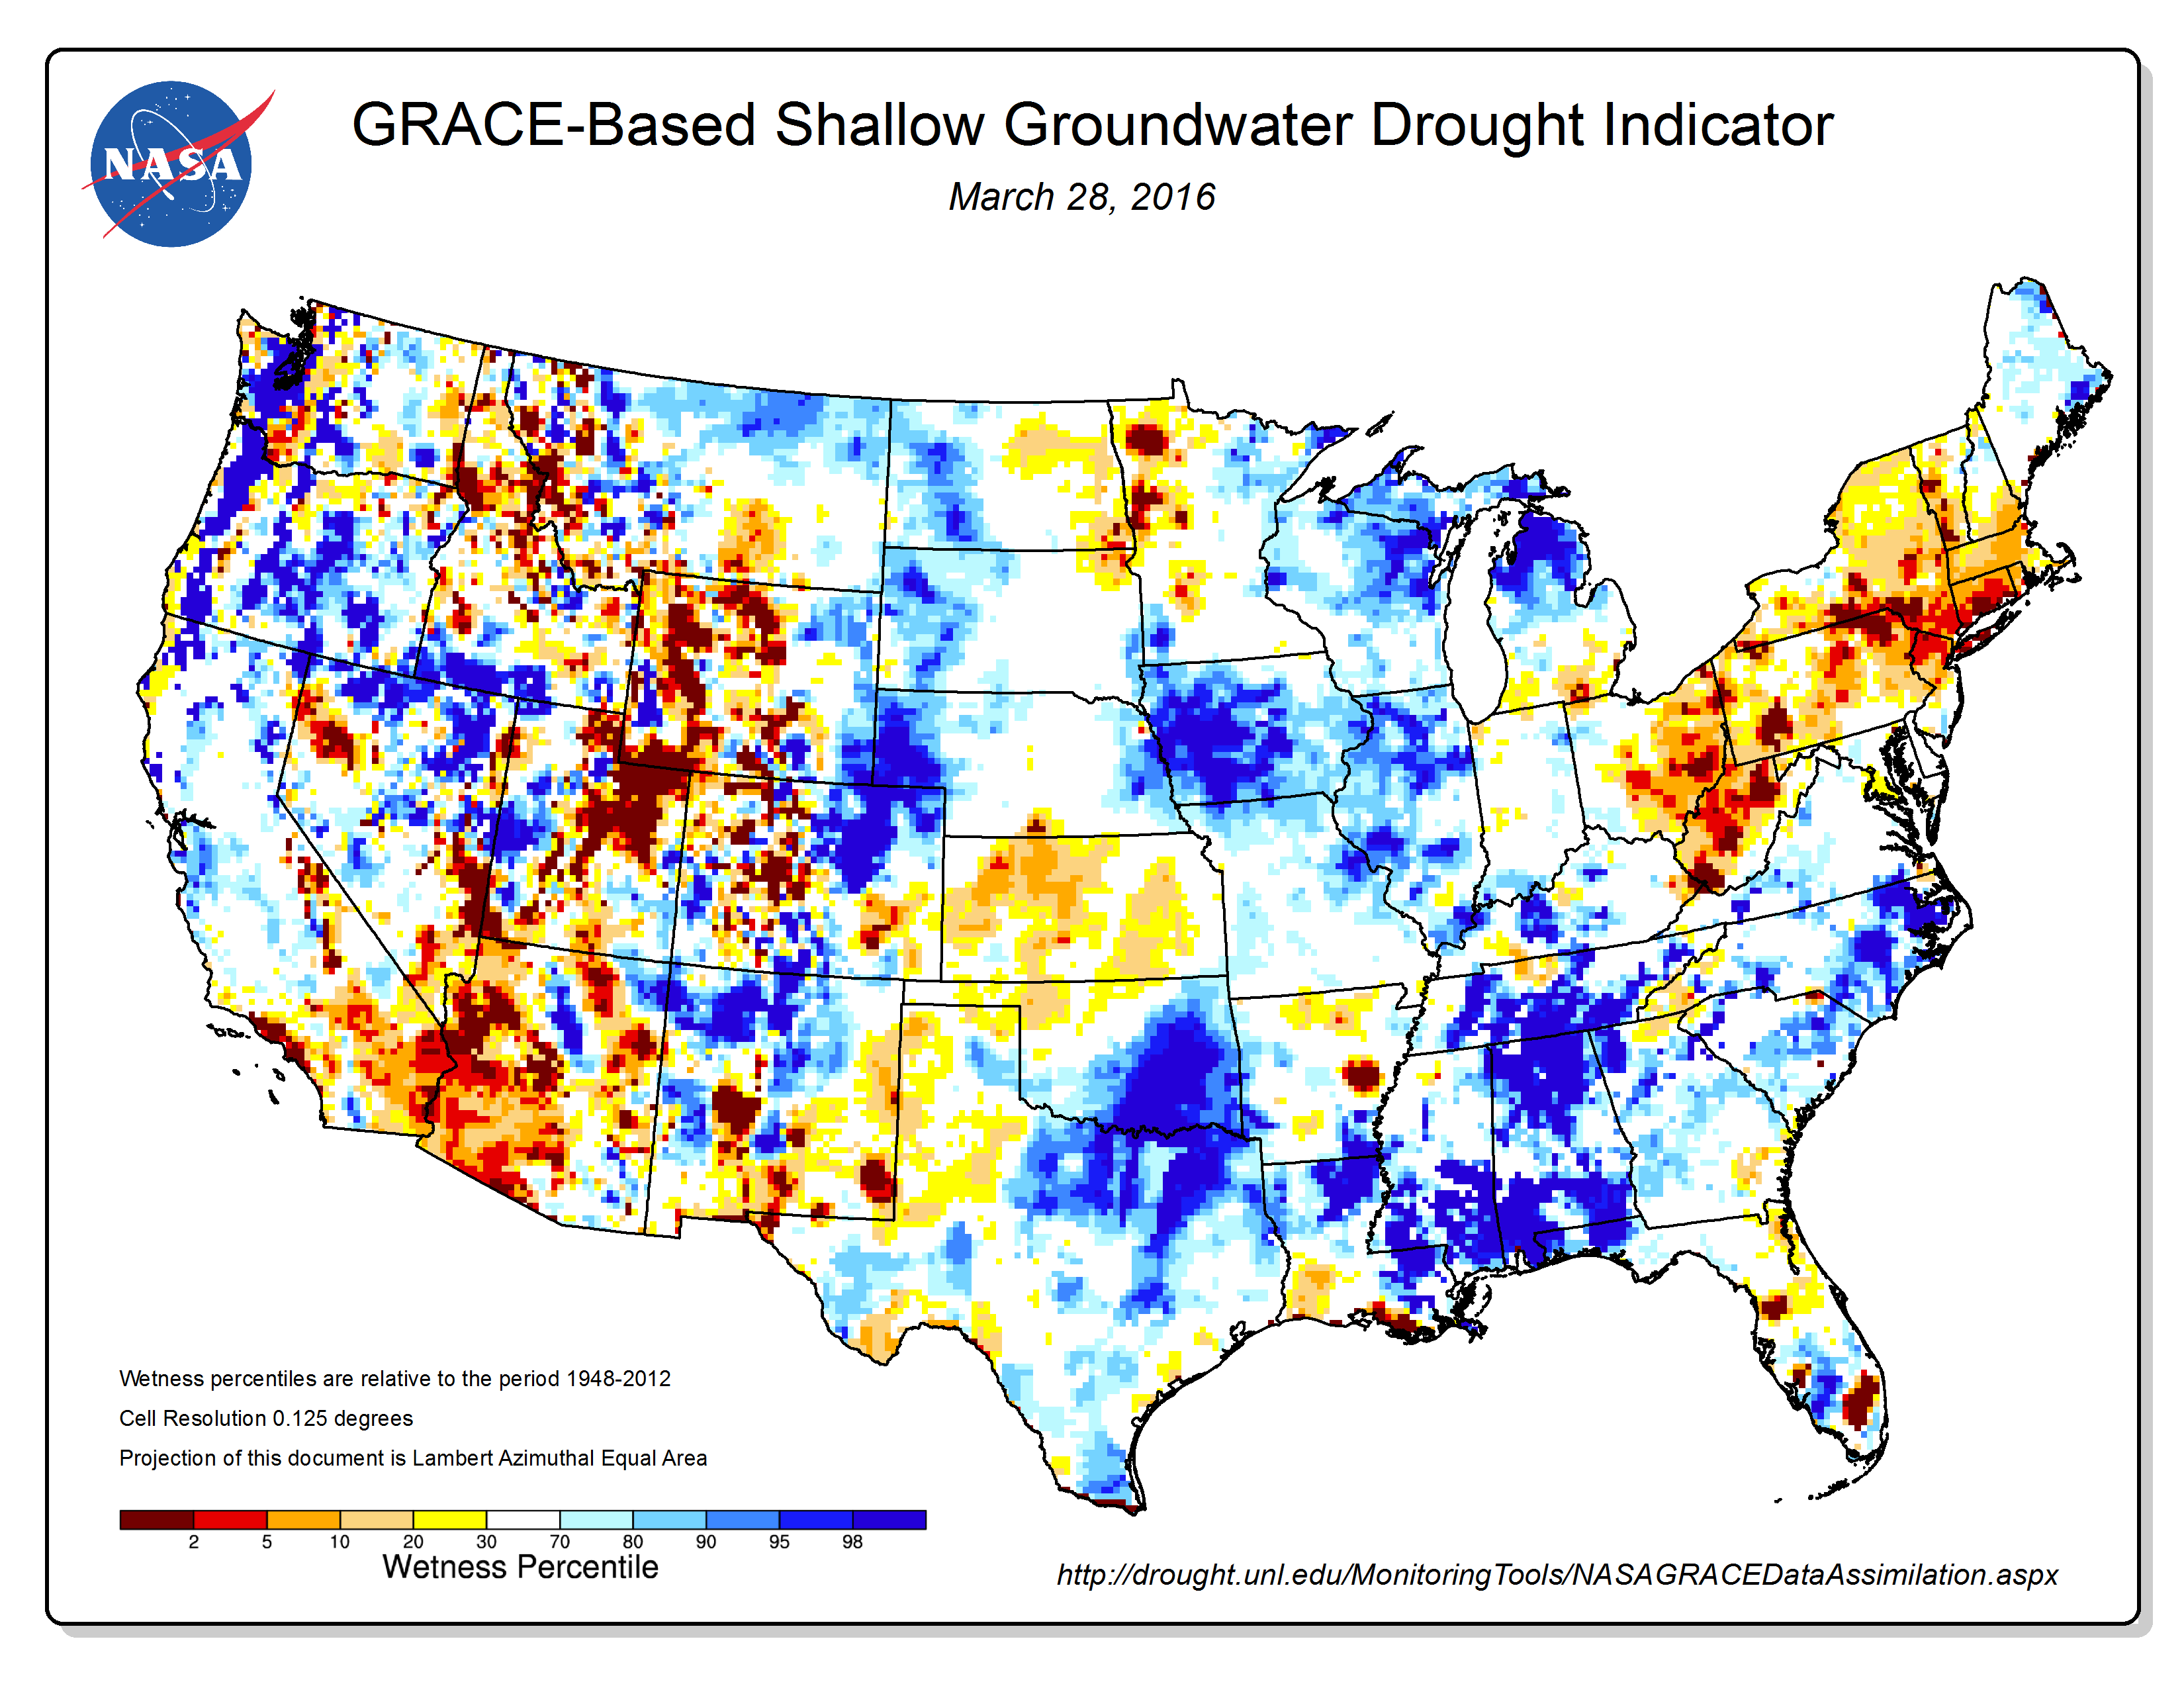
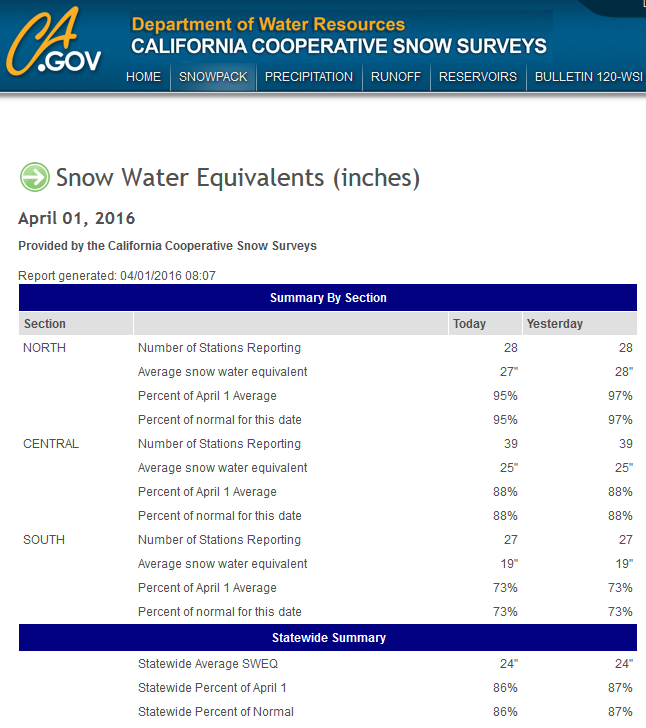
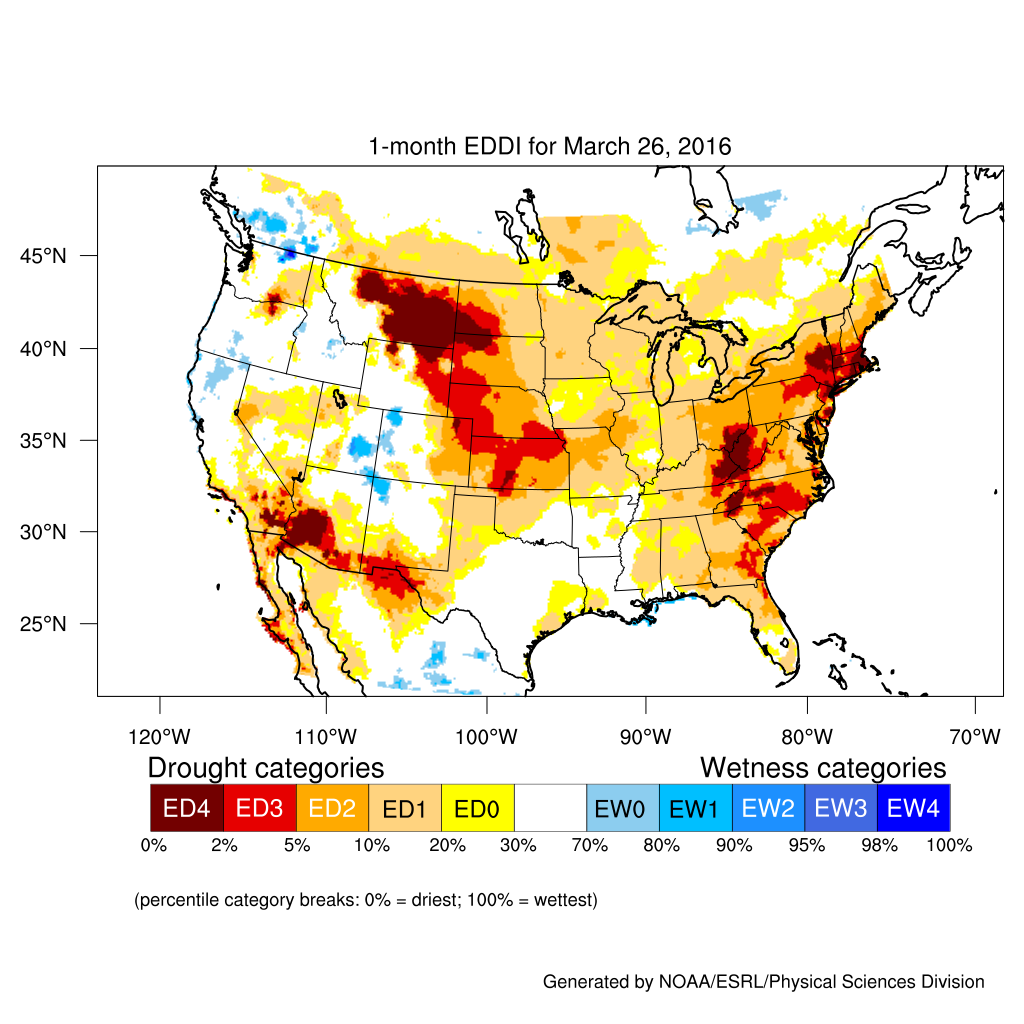
- March 2016 was characterized by below-normal precipitation across the Southwest. This region also had few days with precipitation and long runs of consecutive dry days. The VegDRI tool showed vegetative impacts from drought still widespread across the West, with vegetation slow to recover from drought. Some springs and groundwater levels were still low in parts of the West. In spite of the precipitation received so far in this water year (October 1, 2015 to present), reservoir levels were still below average, statewide, in Arizona, Nevada, and New Mexico. They were near to below average in Utah, Oregon, and Washington, and near to above average in Colorado, Idaho, Montana, and Wyoming. In California, reservoir levels improved to average or above levels in parts of the north, but reservoirs in the rest of the state continued at below-average levels, especially in Southern California. Mountain snowpack was near to above average in parts of the West, especially the Northwest. But some automated SNOTEL stations in the Northern to Central Rockies had below-normal snowpack. This was especially true in the Southwest, with the snow completely melted out early in many basins in Arizona and New Mexico. California snowpack was near average in the north to below average in the south. Based on the Evaporative Demand Drought Index (EDDI), evaporative demand was above average in the Southwest. With below-normal precipitation and above-normal temperatures, the Palmer Crop Moisture Index reflected intensifying short-term drought conditions in the Southwest (weeks 1, 2, 3, 4, 5).
- Abnormally dry to moderate drought conditions developed and expanded in parts of the Northern Plains and Southern Plains. —
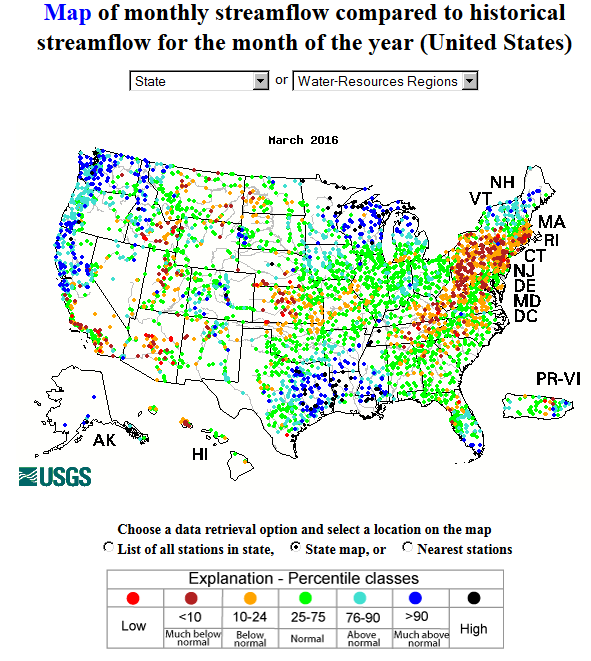
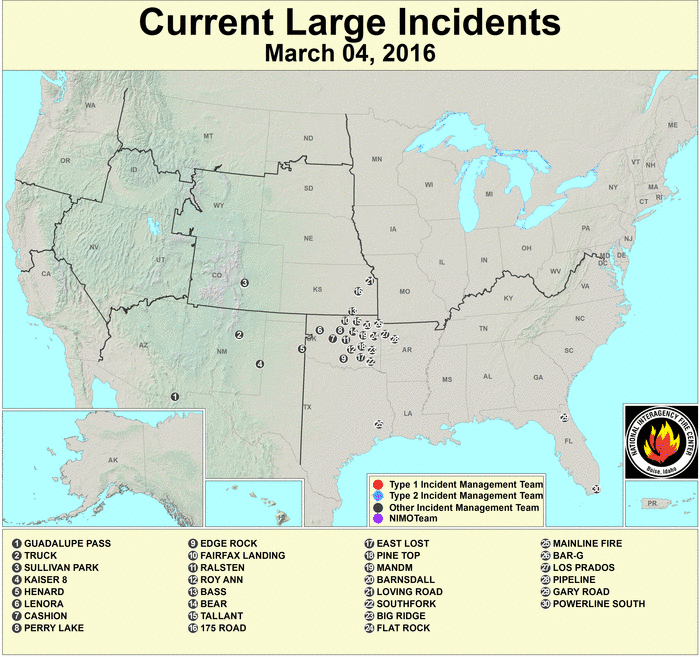
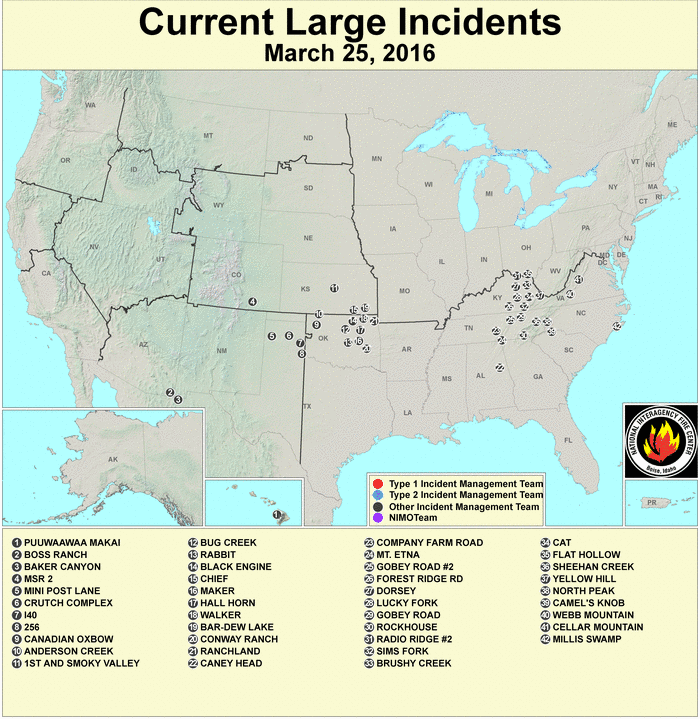
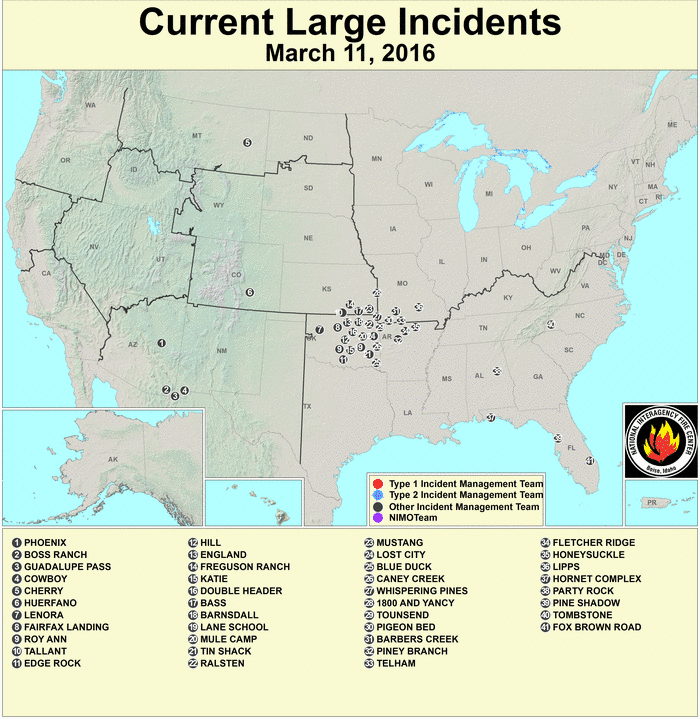
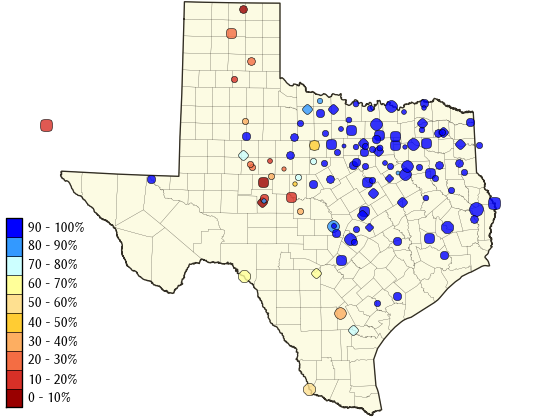
- Modeled and observed soil moisture was dry in parts of the Plains. Some ground water and streamflow levels were low, especially in Kansas, and there were few days with precipitation and long runs of consecutive dry days in some areas. Numerous large wildfires continued to burn in Oklahoma throughout the month, especially during the first half of the month. Some reservoirs in west-central and panhandle Texas were still low. Satellite observations of vegetative health indicated dry conditions across the Northern High Plains.
- Abnormal dryness expanded in the Southeast and Midwest, while it lingered in the Northeast. —
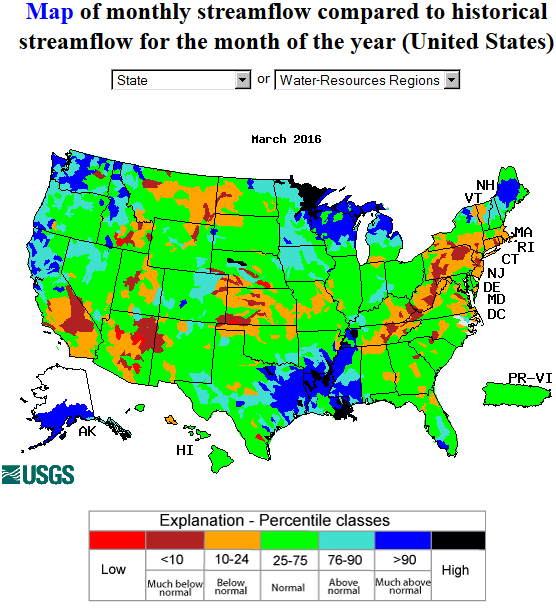
- Streamflow levels were low from the Tennessee Valley to southern New England and groundwater levels were low from Ohio and West Virginia across to New England. Based on the EDDI, evaporative demand was above average across much of the East and Midwest. Numerous wildfires developed across the Southern Appalachians into eastern Tennessee and Kentucky near the end of the month.
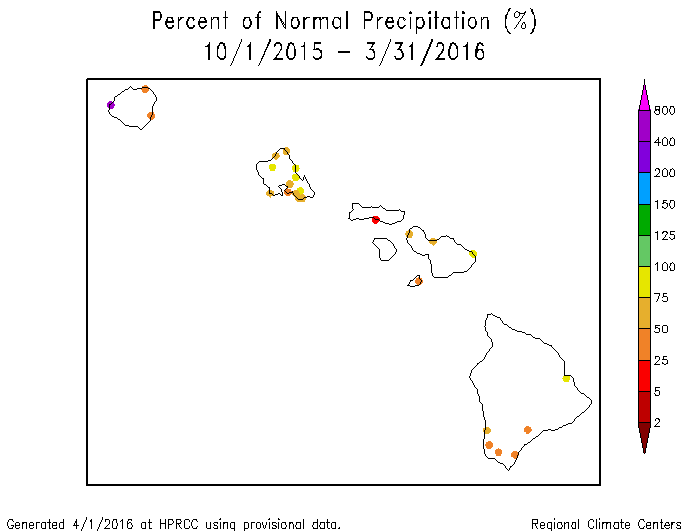
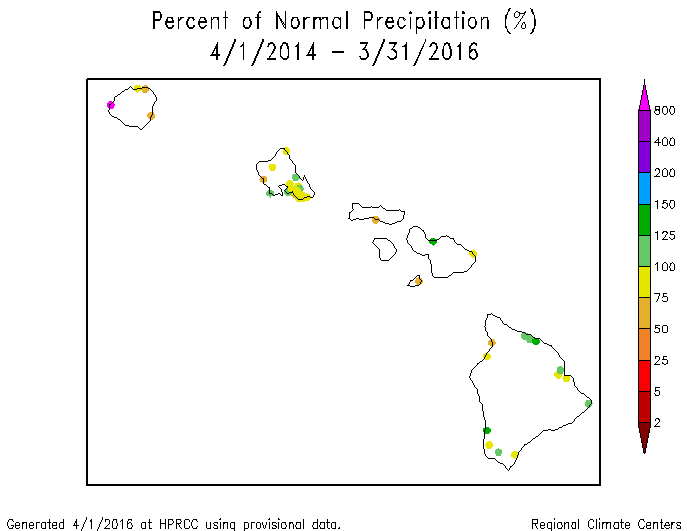
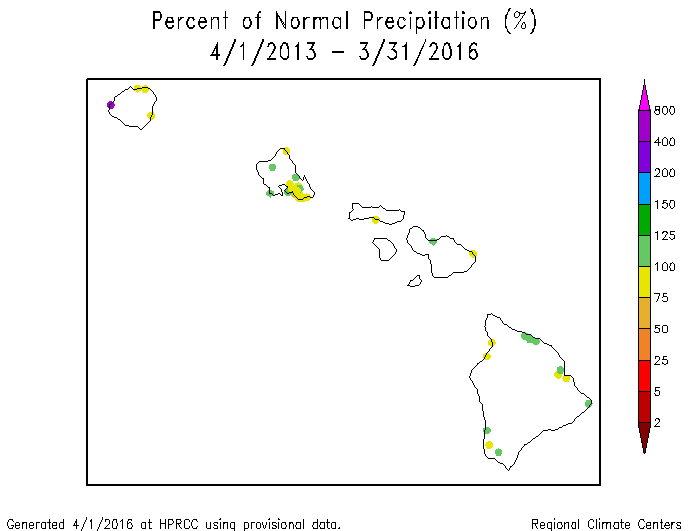
Hawaii: March 2016 continued a dry trend across much of Hawaii which has lasted much of the last six months (last 1, 2, 3, and 6 months). A mixed precipitation anomaly pattern is evident at the longer time scales (last 9, 12, 24, and 36 months). Streamflow was low on some islands, with vegetation and agricultural impacts worsening. Moderate drought expanded to cover more than three-fourths of the state, with severe drought covering about 17 percent, according to the March 29th USDM map.
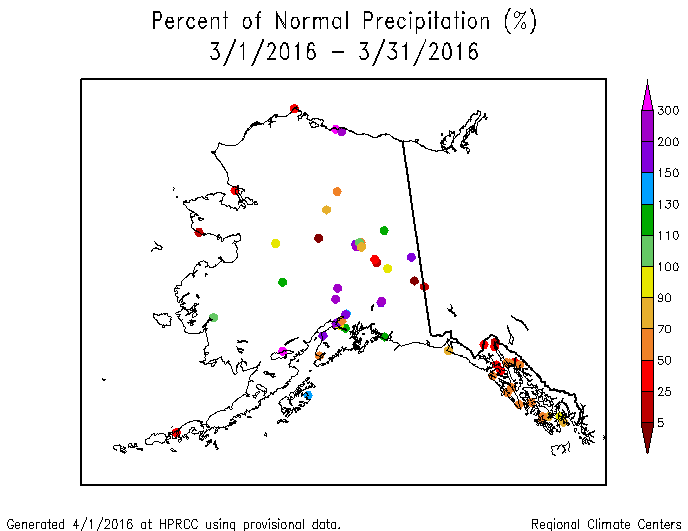
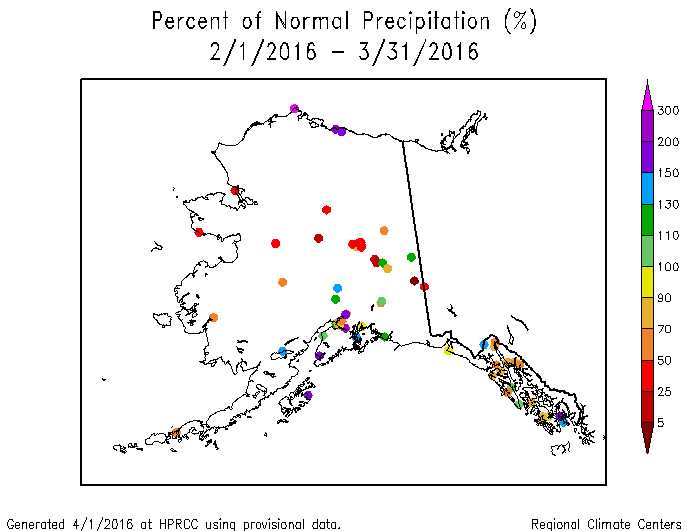
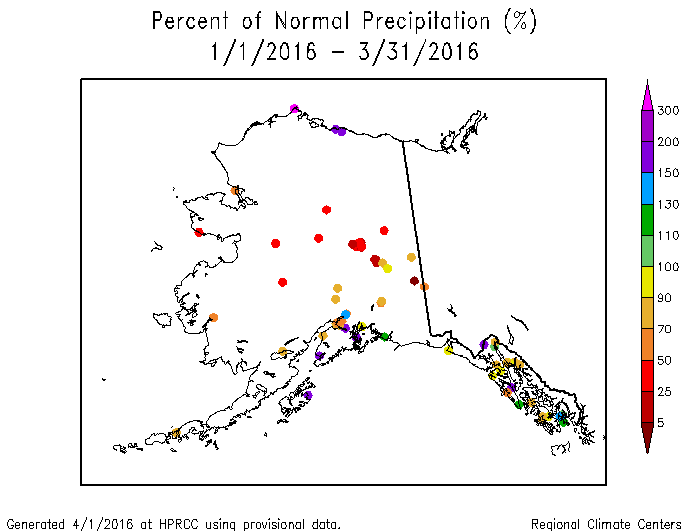
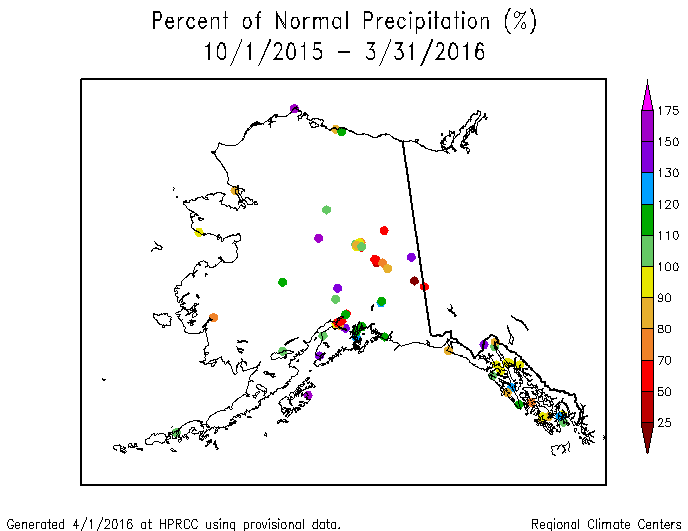
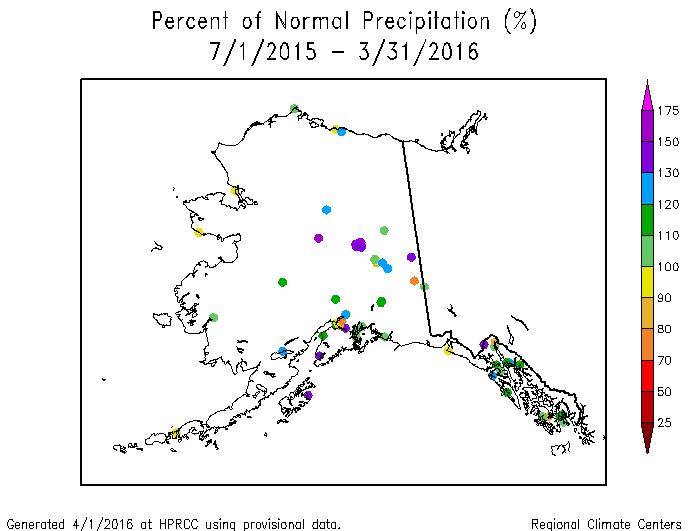
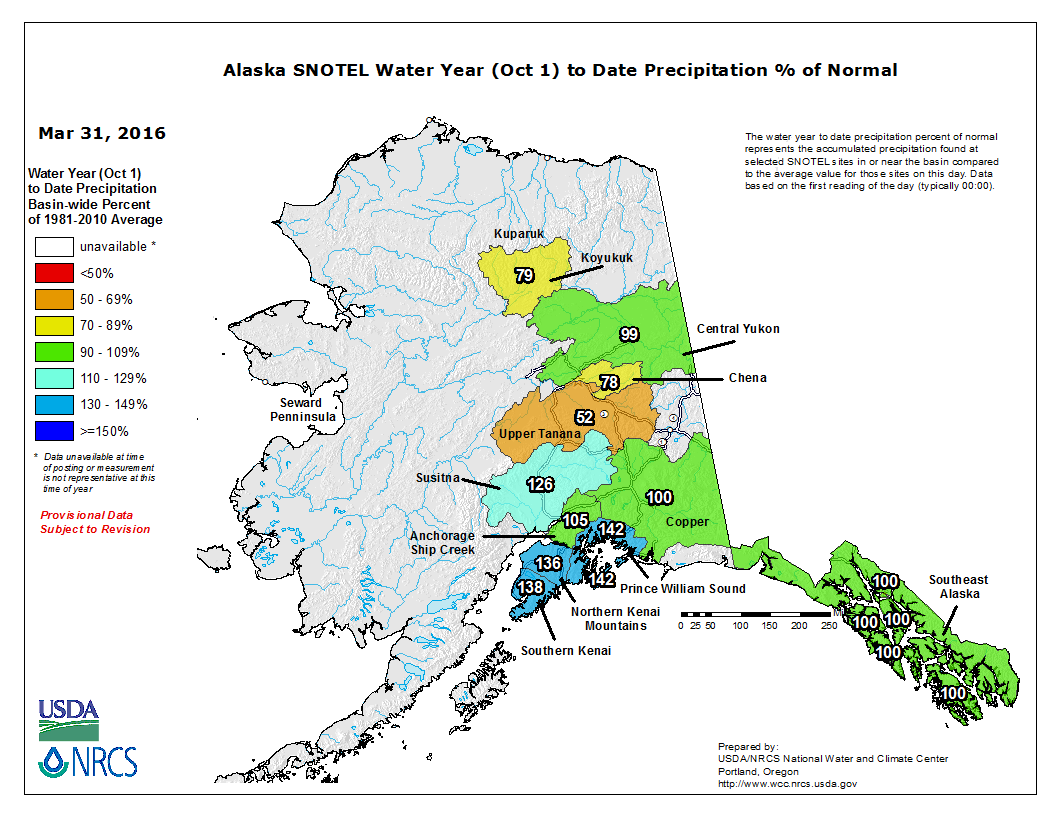
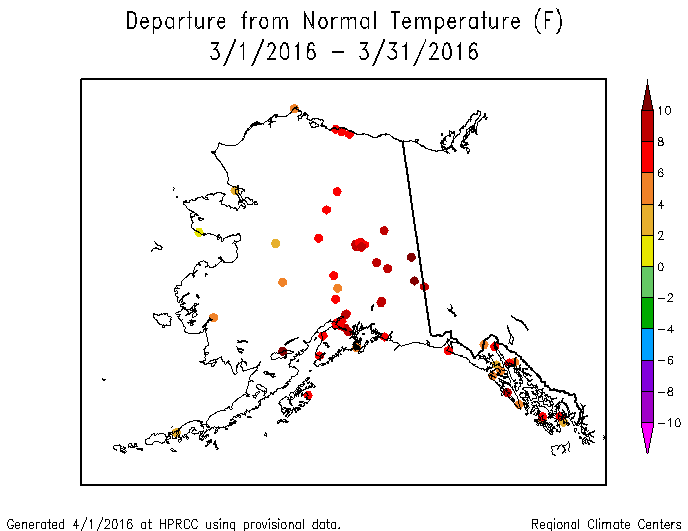
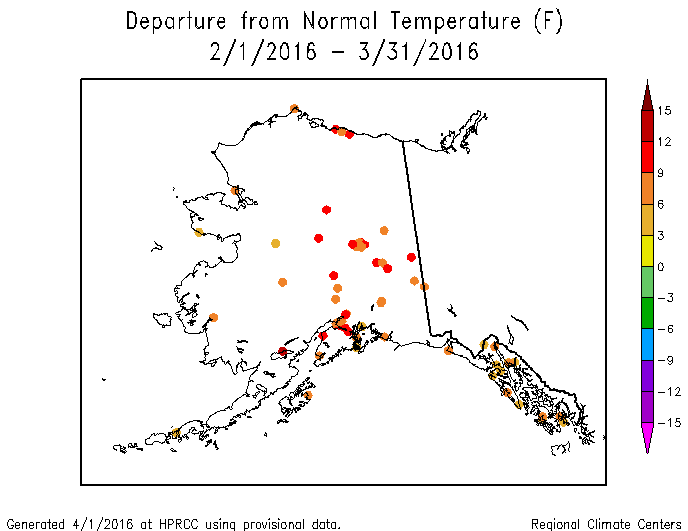
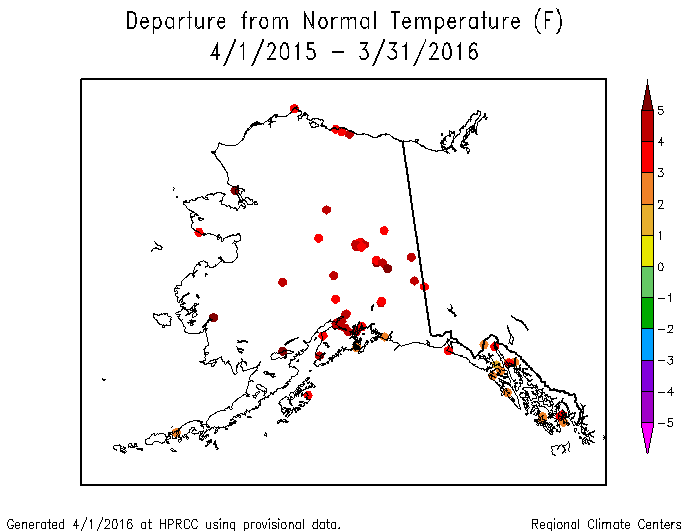
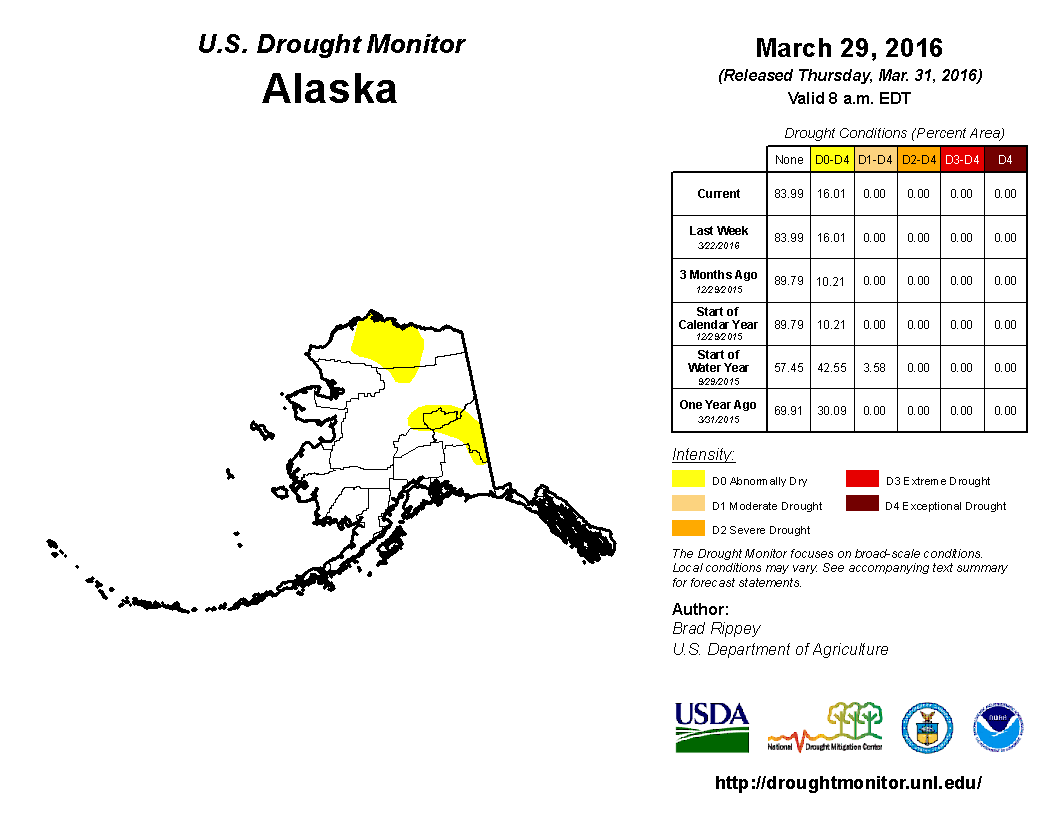
Alaska: A mixed precipitation pattern dominated Alaska in March. This is in contrast to a dry pattern which has dominated for much of the last three months (divisional precipitation ranks for January-March) (station percent of normal precipitation for February-March and January-March). The pattern transitions to wetter than normal at longer time scales (station maps for the last 6, 9, 12, 24, and 36 months) (climate division maps for the last 6 and 12 months) (SNOTEL map for last 6 months). Warmer-than-normal temperatures have dominated for the last 12 months on both the climate division (last 1, 3, 6, 12 months) and station (last 1, 2, 3, 6, 12 months) analyses. Snowpack water content varied from basin to basin and the warmer-than-normal temperatures increased snowmelt which increased streamflow. Abnormal dryness continued across 16 percent of the state on the March 29th USDM map.
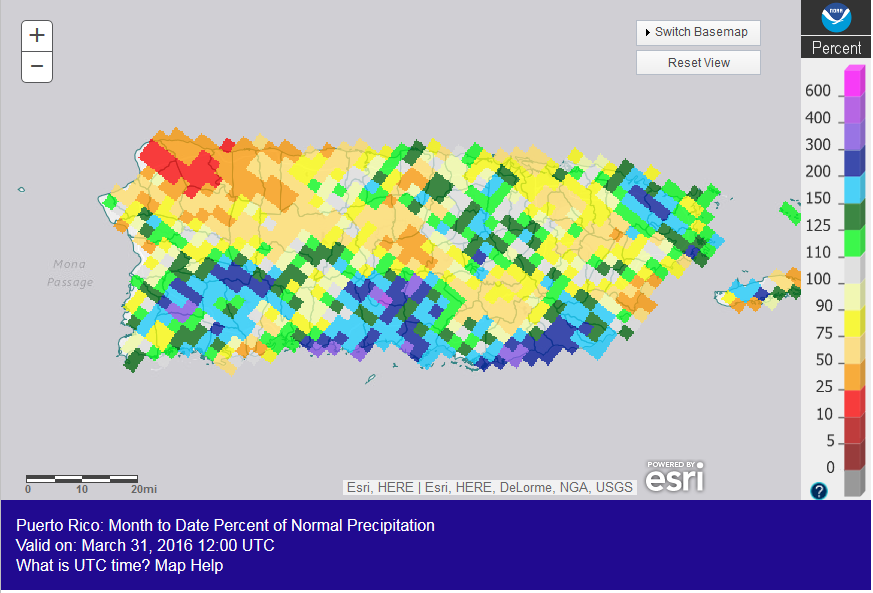
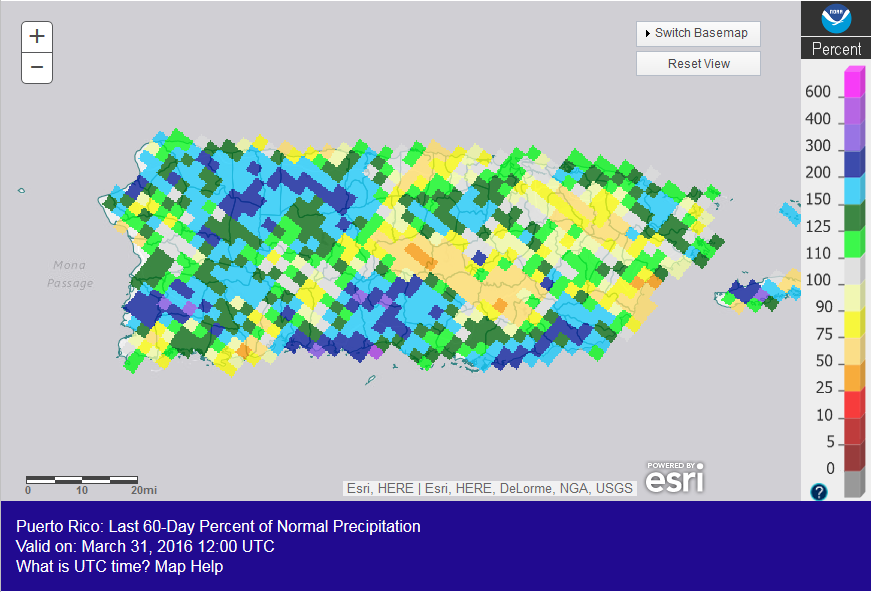
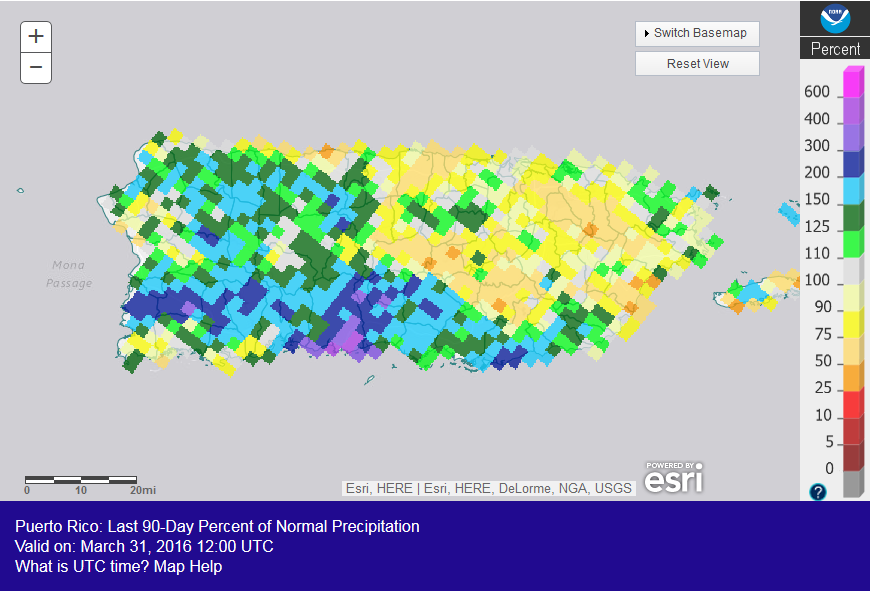
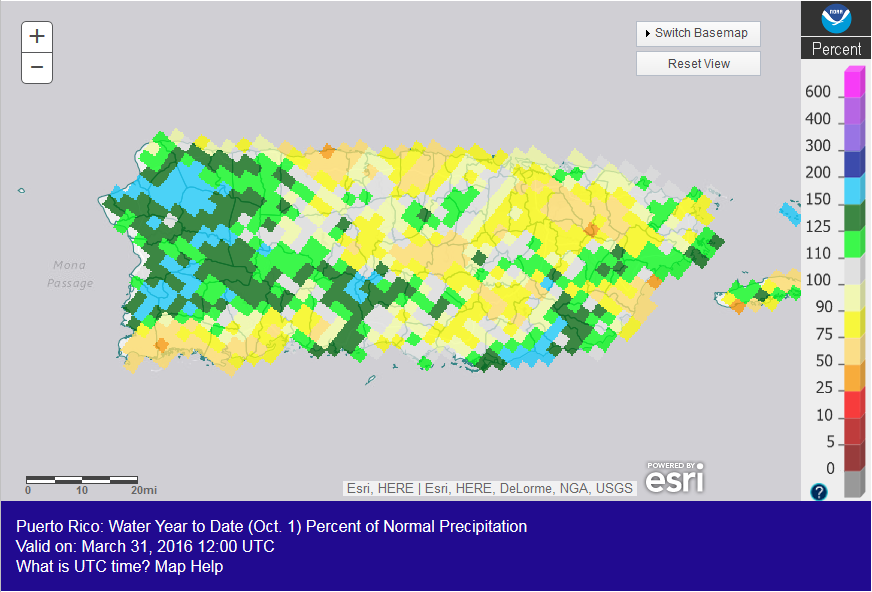
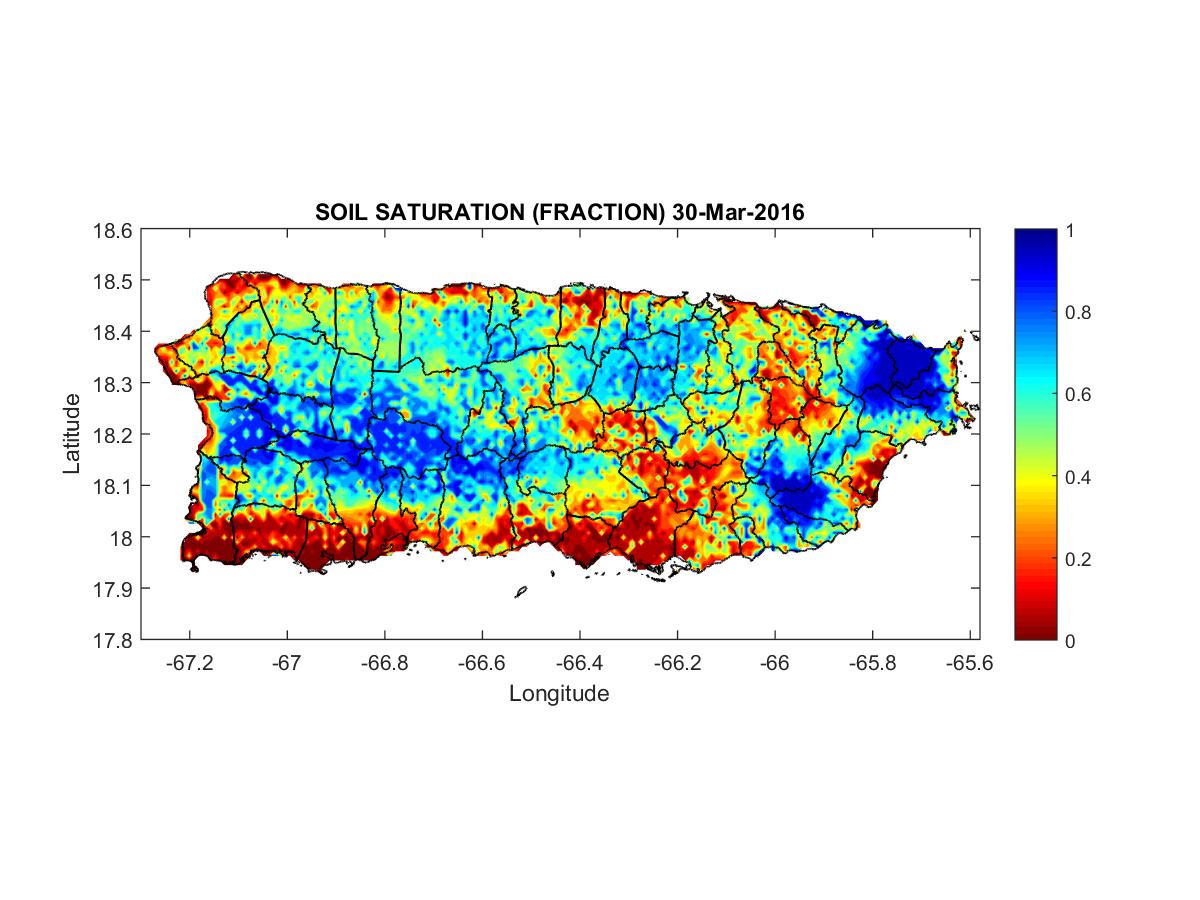
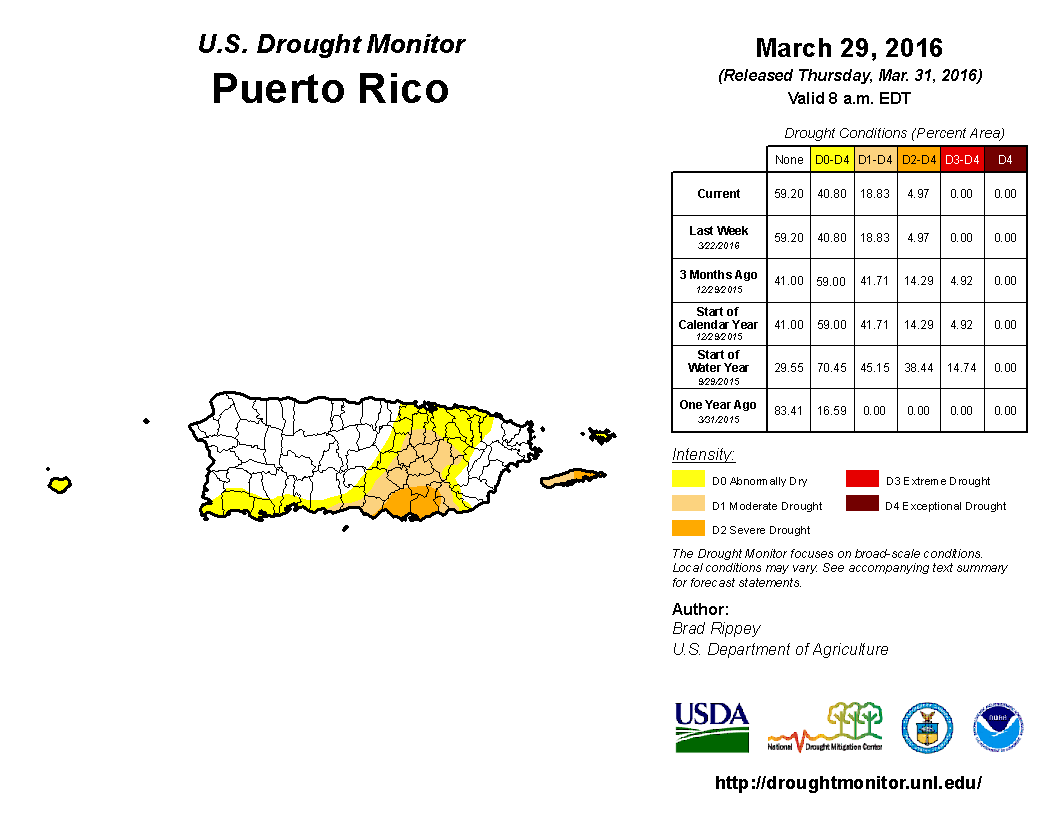
Puerto Rico: Puerto Rico had a mixed precipitation anomaly pattern during March. Wetter-than-normal conditions dominated at the 2-month time scale. Dryness is evident in the northeast and wet conditions in the southwest at the 3- and 6-month time scales. Soils were still dry across the southern coastal area and parts of the east. As shown by the March 29th USDM map, abnormal dryness and drought shrank to about 40.8 percent of Puerto Rico, with moderate to extreme drought holding at 18.8 percent of the island.
CONUS State Precipitation Ranks:
 |
|
New Mexico statewide precipitation, March, 1895-2016.
March 2016 was drier than normal across the Southwest to Central Plains, Southeast to southern New England, and parts of the Northern Plains. Sixteen states ranked in their driest third of the 1895-2016 record, with six in the top ten driest category. New Mexico had its driest March on record, North Carolina seventh driest, Arizona and New Jersey ninth driest, and Maryland and Pennsylvania tenth driest. The year-to-date was drier than normal for much of this same area, with 15 states ranking in the driest third of the historical record. New Mexico had the eleventh driest January-March on record as well as the second driest February-March.
With wet conditions dominating in December and earlier months, most states had precipitation ranks in the near-normal to wetter-than-normal range for October-March and April-March, although Connecticut had its fifth driest April-March.
|
|
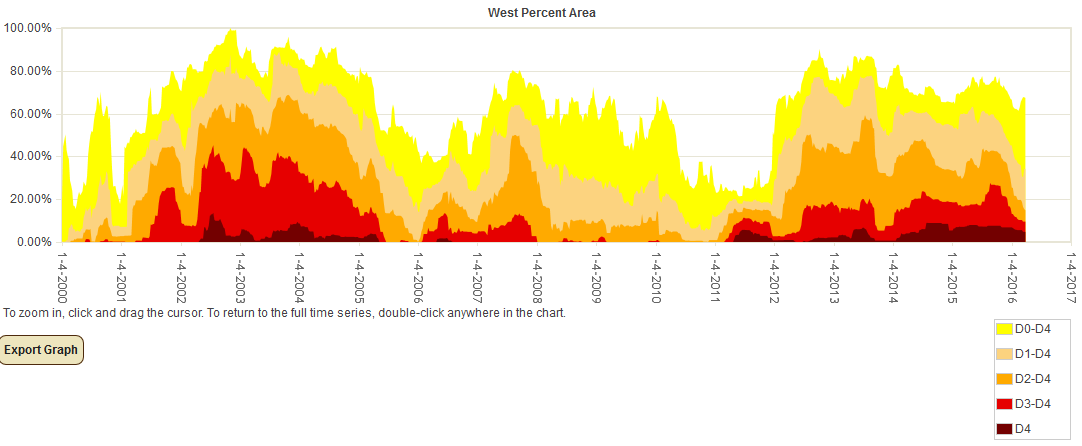
Percent area of the Western U.S. in moderate to extreme drought, January 1900 to present, based on the Palmer Drought Index.
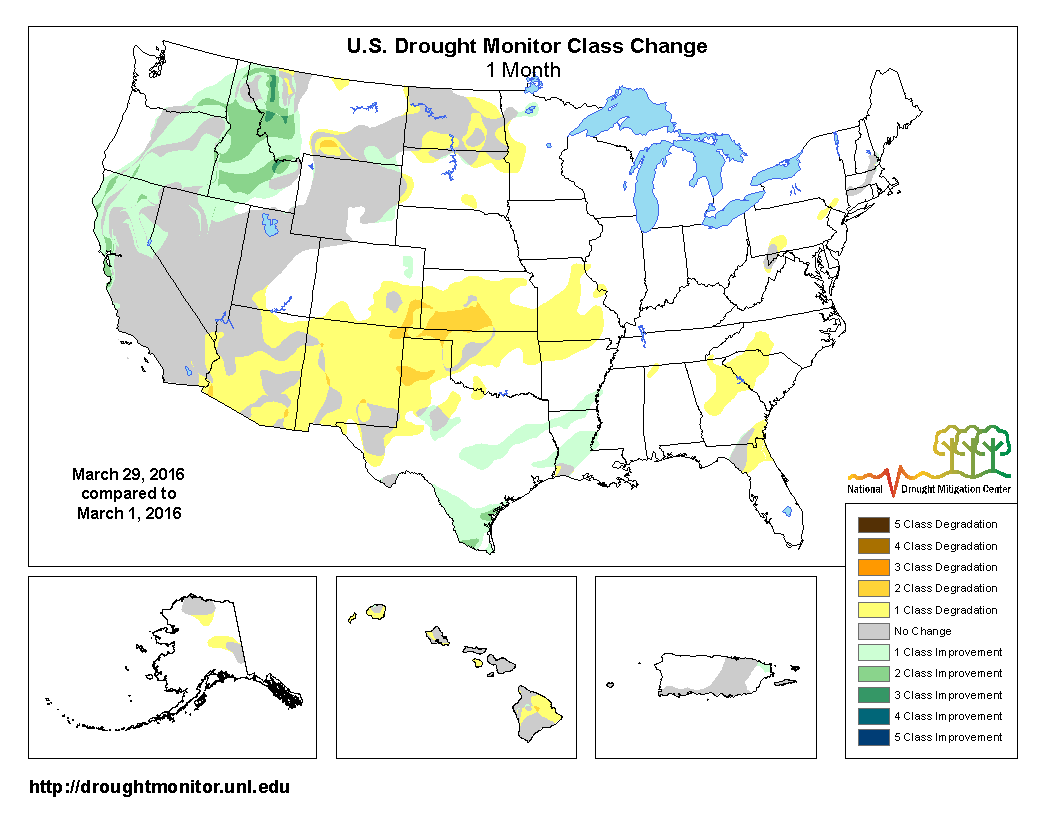
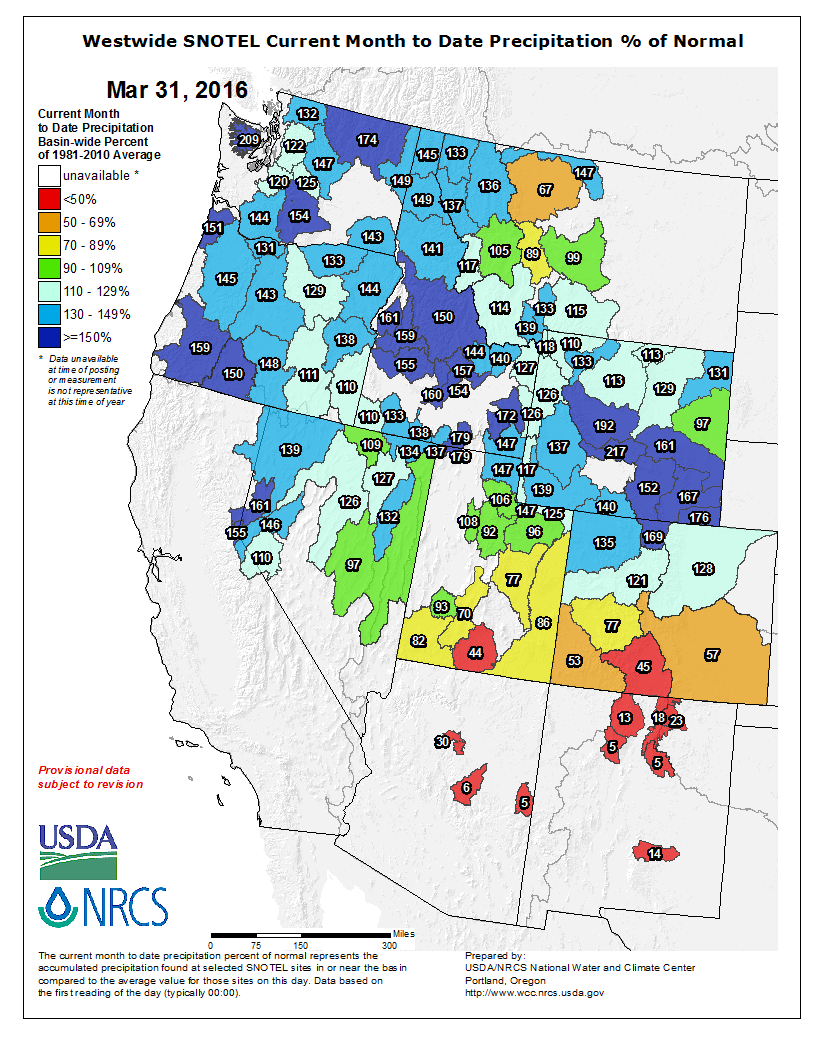
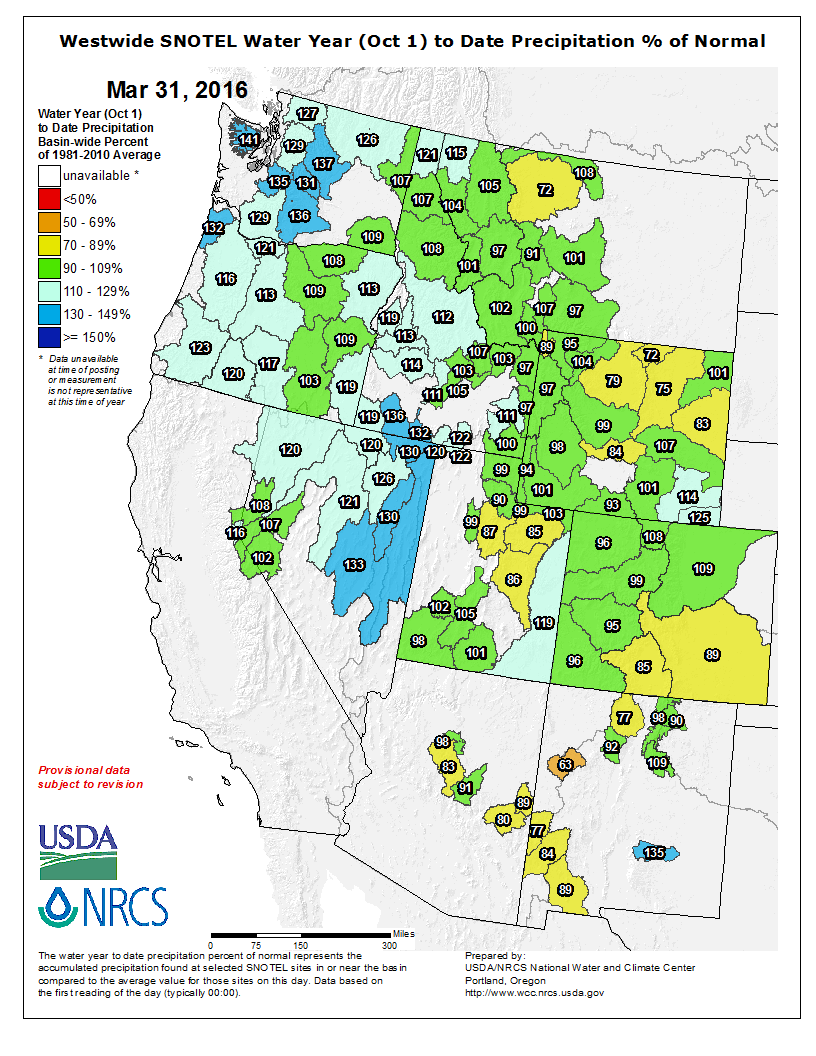
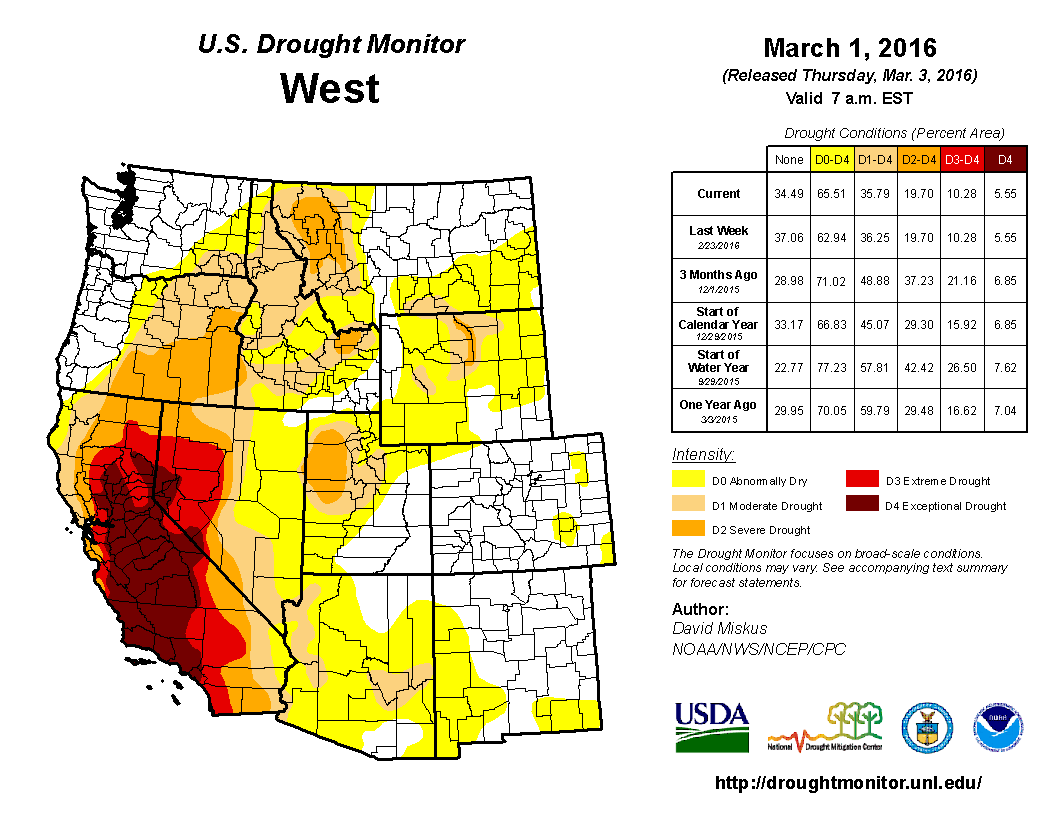
March was drier than normal across the Southwest and wetter than normal across the Pacific Northwest to Northern Rockies. This was reflected in the USDM change map which showed drought contraction in the Northwest and expansion in the Southwest. The water year-to-date (October 1, 2015-March 31, 2016) showed a similar precipitation anomaly pattern although the dryness in the Southwest was not as extreme. But the precipitation mostly missed some leeside Rocky Mountain locations, especially the Bighorn Mountain region of north central Wyoming. The winter-season storm systems helped build up the mountain snowpack to near- to above-normal levels in many areas and increased reservoir levels, which accounted for some improvement in hydrological drought conditions. But one wet season cannot make up for several years of moisture deficits, so drought continues in both the USDM and Palmer analyses. According to the USDM, 34.2 percent of the West was experiencing moderate to exceptional drought at the end of March, which is slightly less than the previous month. The Palmer Drought Index percent area statistic for the West increased slightly to 18.7 percent.
 |
 |
March 2016 was drier- and warmer-than-normal in the Primary Hard Red Winter Wheat agricultural belt, ranking as the 30th driest and sixth warmest March in the 1895-2016 record, regionwide. October marks the beginning of the growing season. The region was generally wetter- and warmer-than-normal for the growing season-to-date, with October 2015-March 2016 ranking as the 20th wettest and second warmest October-March in the 1895-2016 record, regionwide.
 |
 |
March serves as the beginning of the growing season for the Primary Corn and Soybean agricultural belt. March was warmer than normal in this region. Part of the region was drier than normal and part wetter than normal. Regionwide, March 2016 ranked as the 19th wettest and sixth warmest March in the 1895-2016 record.
NOAA Regional Climate Centers:
A more detailed drought discussion, provided by the NOAA Regional Climate Centers and others, can be found below.
West
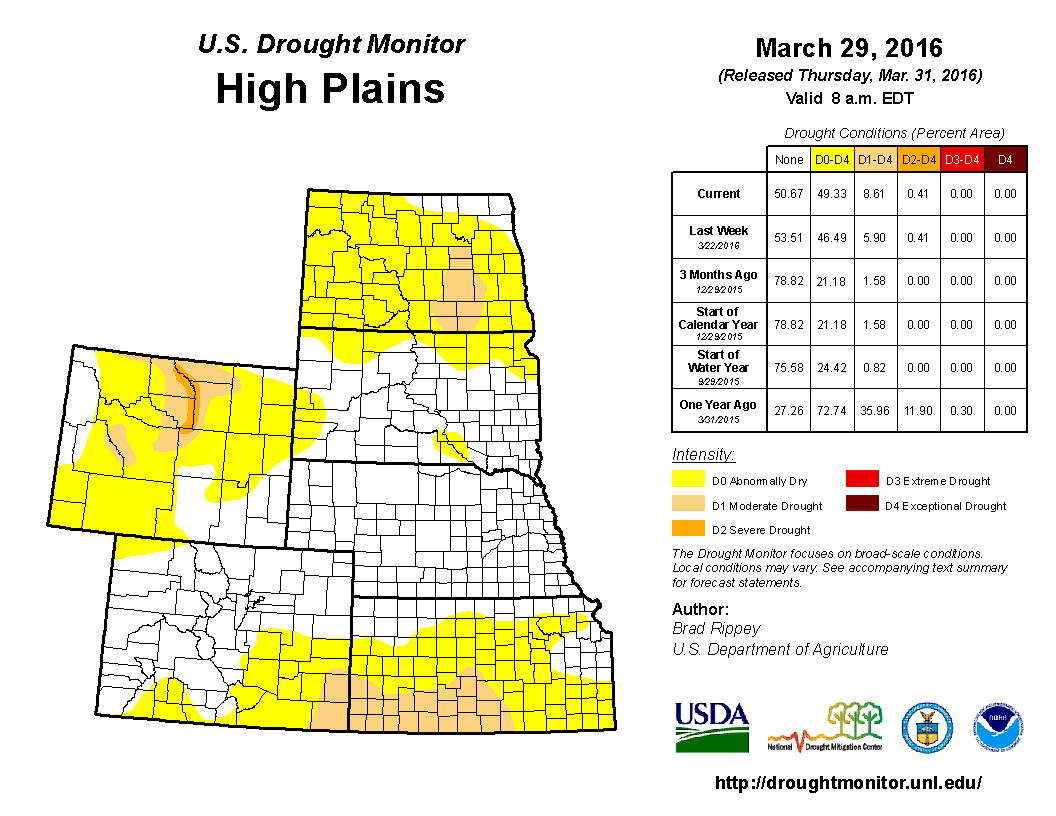
As described by the High Plains Regional Climate Center, the warm pattern that was evident in February continued into March throughout the High Plains. Wet and dry conditions were both prominent across the region. Above normal precipitation occurred throughout much of Wyoming and the Nebraska panhandle, which improved abysmal snowpack conditions in the Bighorn Mountains in Wyoming and prevented further development of drought in that area. Much of the rest of the region was dry, especially across southwestern Kansas and southeastern Colorado. A combination of the dryness and warm temperatures led to drought development in this area. Wildfires were a common feature in this region during March, and windy conditions caused them to spread quickly. In fact, Kansas had one of its largest wildfires in history, which burned nearly 400,000 acres. Warm and dry conditions prompted farmers to get out in their fields early to prepare for planting. As spring planting season nears, soil moisture conditions become very important to farmers. Reports from around the region stated that topsoil moisture in parts of North Dakota and Kansas was rather dry, which could negatively impact winter grains. Without ample precipitation, this could become more of a concern as the crop matures.
The warmth caused early green-up across the region, as trees and flowers bloomed much earlier than normal. There was particular concern for the winter wheat crop in southeastern Colorado and southwestern Kansas. Warm temperatures caused growth to progress quickly, and then a hard freeze occurred on March 20th that resulted in temperatures dipping down into the teens and single digits across the area. The accelerated growth, lack of snow cover, and the freeze may have caused damage to the crop. However, drought recently developed in this area, so it may be difficult to determine whether potential damage was caused by the freeze or the drought.
The persistent warmth and dryness in March led to further degradations in drought conditions during the month. The area in drought in the High Plains region increased from about 3 percent at the end of February to over 8 percent by the end of March, and nearly half the region was experiencing at least abnormal dryness (D0) by the end of the month. The area of moderate drought (D1) in North Dakota expanded due to much above normal temperatures and continued dryness. Impacts such as drying soils, low water levels in ponds, and dried up wetlands were reported. In Wyoming, the two areas in drought expanded at the beginning of March. Snowpack in the Wind River Mountains and the Bighorn Mountains had not been faring well due to warmth and dryness throughout the winter. However, above normal precipitation in March helped improve the snowpack in these mountain ranges, so drought conditions held steady during the rest of the month. An area of D1 developed in southeastern Colorado and southern Kansas during March. Additionally, D0 expanded across southern and eastern Colorado, as well as much of Kansas. This region was warm and extremely dry throughout the month. Western and central Kansas received only 50 percent of normal precipitation, at best. Warm, dry, and windy conditions caused numerous grass fires and blowing dust on March 22-23. Topsoil was also rather dry in this region. Without relief, this area in drought will likely expand in April.
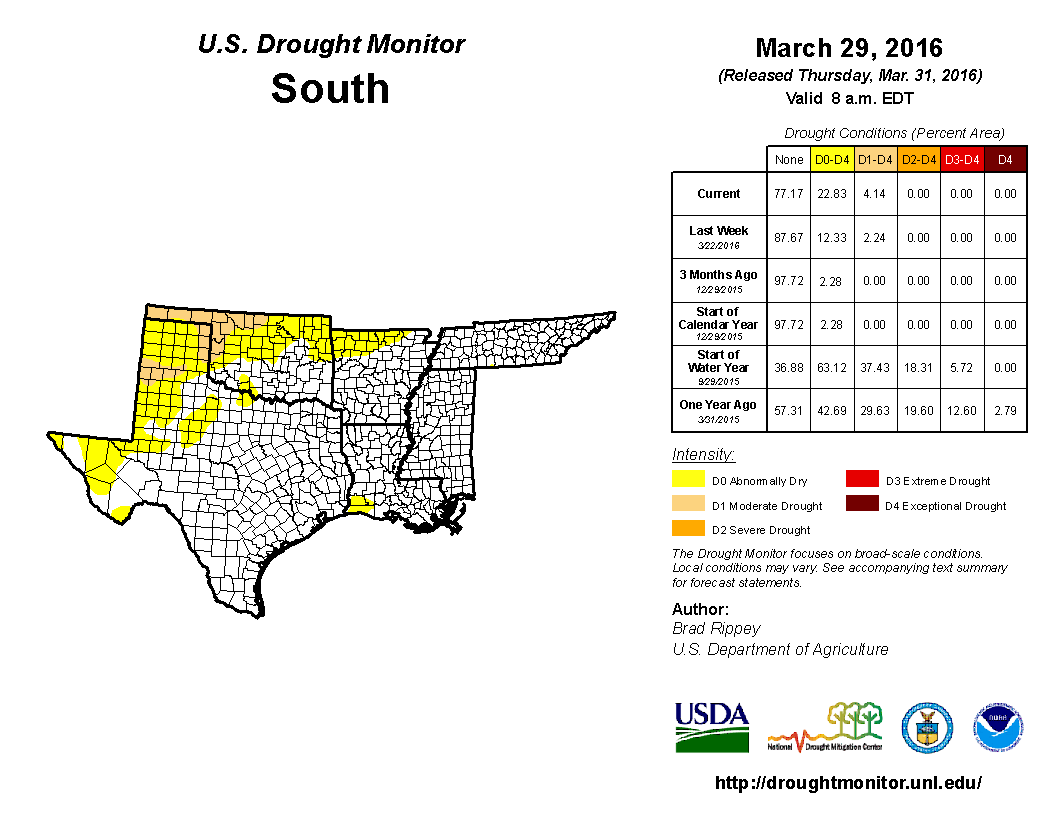
As explained by the Southern Regional Climate Center, as was the case in February, March average temperatures in the Southern region were consistently above normal for all six states. Precipitation varied dramatically with the northwestern and northeastern corners of the region experiencing much drier than normal conditions, while central portions of the region experienced flooding events from heavy rainfall totals which were mostly due to the passage of a slow moving cold front and Gulf of Mexico low pressure system. Because of excessive heat and lack of rainfall in the northwestern portions of the Southern region during March, some moderate drought conditions developed in the western counties of Oklahoma and in the northern Texas panhandle.
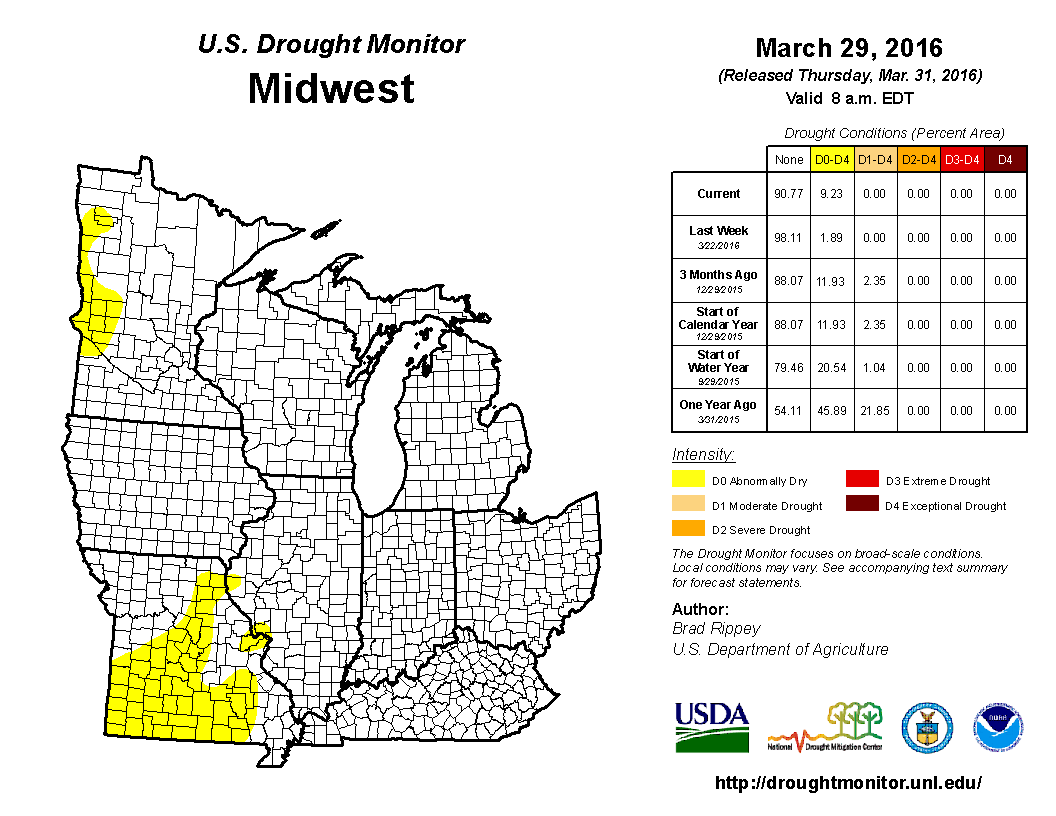
As summarized by the Midwest Regional Climate Center, March temperatures were well above normal in the Midwest, ranking 2016 as the 6th warmest March on record (out of 122 years) regionwide. March precipitation was mixed. Below normal totals were recorded in western Minnesota, eastern Kentucky, and most of Missouri. The USDM reported no drought in the Midwest for the third month in a row. The 13 consecutive weeks with no drought in the region is the longest such stretch in the history of the USDM which began in 2000. Small areas noted as abnormally dry persisted throughout the month and much of Missouri saw introduction of abnormally dry in the March 29 issue of the USDM.
As noted by the Southeast Regional Climate Center, temperatures were well above average across much of the Southeast and precipitation was generally below normal with several extremes recorded. The driest locations were found across portions of central and western North Carolina, Upstate South Carolina, and northeastern Georgia, where monthly precipitation totals were 3 to 4 inches (76.2 to 102 mm) below normal. Drought conditions (D1 and greater) were not observed across the Southeast region (excluding Puerto Rico) during March. The extent of moderate-to-severe (D1 through D2) drought conditions across eastern and southern portions of Puerto Rico remained near 19 percent during the month. Predominately warm, dry weather during the month allowed farmers across much of the region to prepare fields for spring planting, with corn plants already emerging in some locations. In addition, livestock producers in Georgia and Florida were able to reduce supplemental feeding of animals that had been required previously due to saturated pastures.
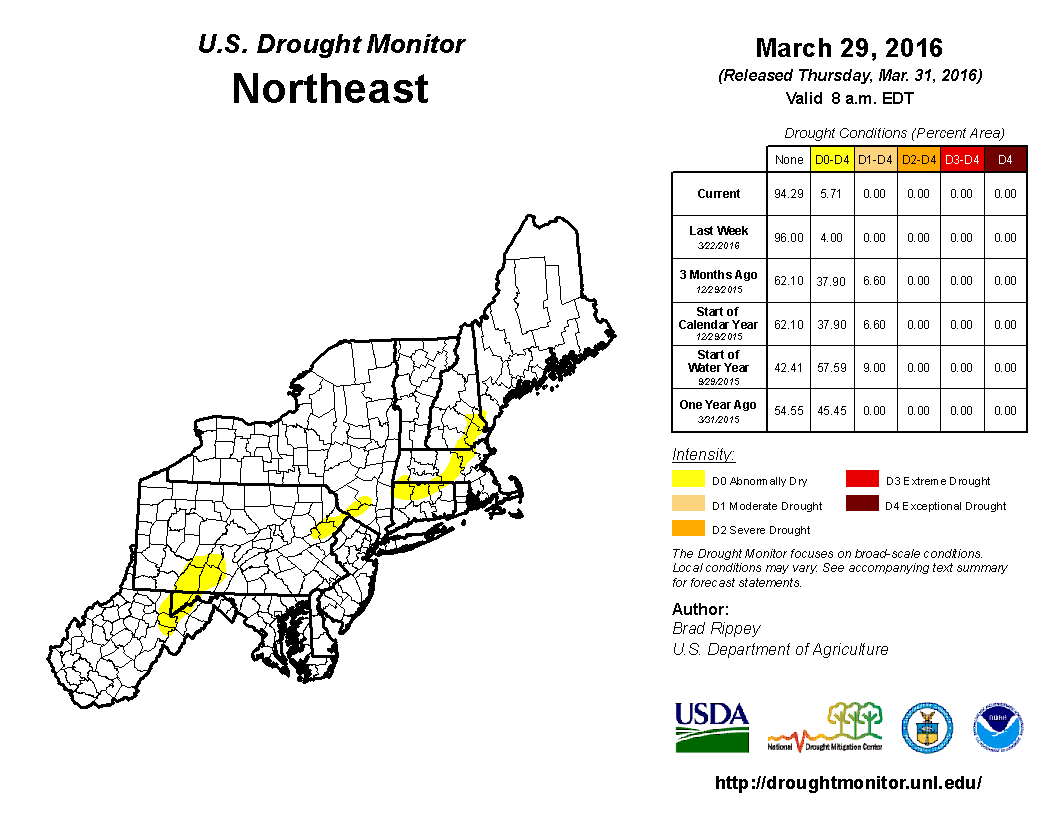
As explained by the Northeast Regional Climate Center, March was a warmer- and drier-than-normal month. The region picked up 2.50 inches (63.5 mm) of precipitation, 71 percent of normal. Eleven states saw below-normal precipitation, with six of them ranking this March among their top fourteen driest. According to the March 3 USDM, 4 percent of the Northeast was abnormally dry. Much of the region saw drier-than-normal conditions during March, which led to a slight expansion of abnormal dryness. By month's end, 6 percent of the region was abnormally dry.
As summarized by the Western Regional Climate Center, March saw a return to active weather following a warmer and drier than normal February in much of the West. Several strong storms impacted the region, boosting snowpack across most western mountains. As has been the general pattern this cool season, drier than normal conditions dominated over the southern tier of the region with wetter conditions in the Northwest, in contrast with the expectations of strong El Niño events.
Near to well-above normal temperatures were observed across the West in March. Well above normal precipitation was observed in the Pacific Northwest, northern California, and central Rockies this month and helped to alleviate drought conditions in a large swath from northern California to western Montana. Snowpack received a boost across the Sierra Nevada, Cascades, northern and central Rockies, and other ranges across the Northwest, with all but a handful of basins ending the month above normal. Basins south of 40 degrees N did not fare as well. Sierra Nevada snowpack averaged to 86% of normal at month's end. The southern Rockies were generally less than 75% of normal, and snowpack across Arizona and New Mexico was less than 35% of normal, or in many cases non-existent. Dry conditions seen in February persisted across the Southwest this month. No measurable March precipitation was recorded in Albuquerque, New Mexico, or Las Vegas, Nevada.
As during the past two months, March temperatures were above normal throughout Alaska. Average temperature at Fairbanks was 19.8 F (-6.8 C), 8.4 F (4.6 C) above normal and the 6th warmest since records began in 1929. Precipitation was below normal across much of the state, though above normal in the South central region. Anchorage received 1.23 in (31 mm), 205% of normal. Further south, dry conditions associated with El Niño persisted through March in Hawaii. Most stations in the state reported below normal precipitation, including Honolulu, which received only 0.22 in (6 mm), 11% of normal. Drought conditions worsened this month for parts of Big Island, Lanai, Oahu, Kauai and Molokai.
Pacific Islands: According to reports from National Weather Service offices, the Pacific ENSO Applications Climate Center (PEAC), and partners, conditions varied across the Pacific Islands.
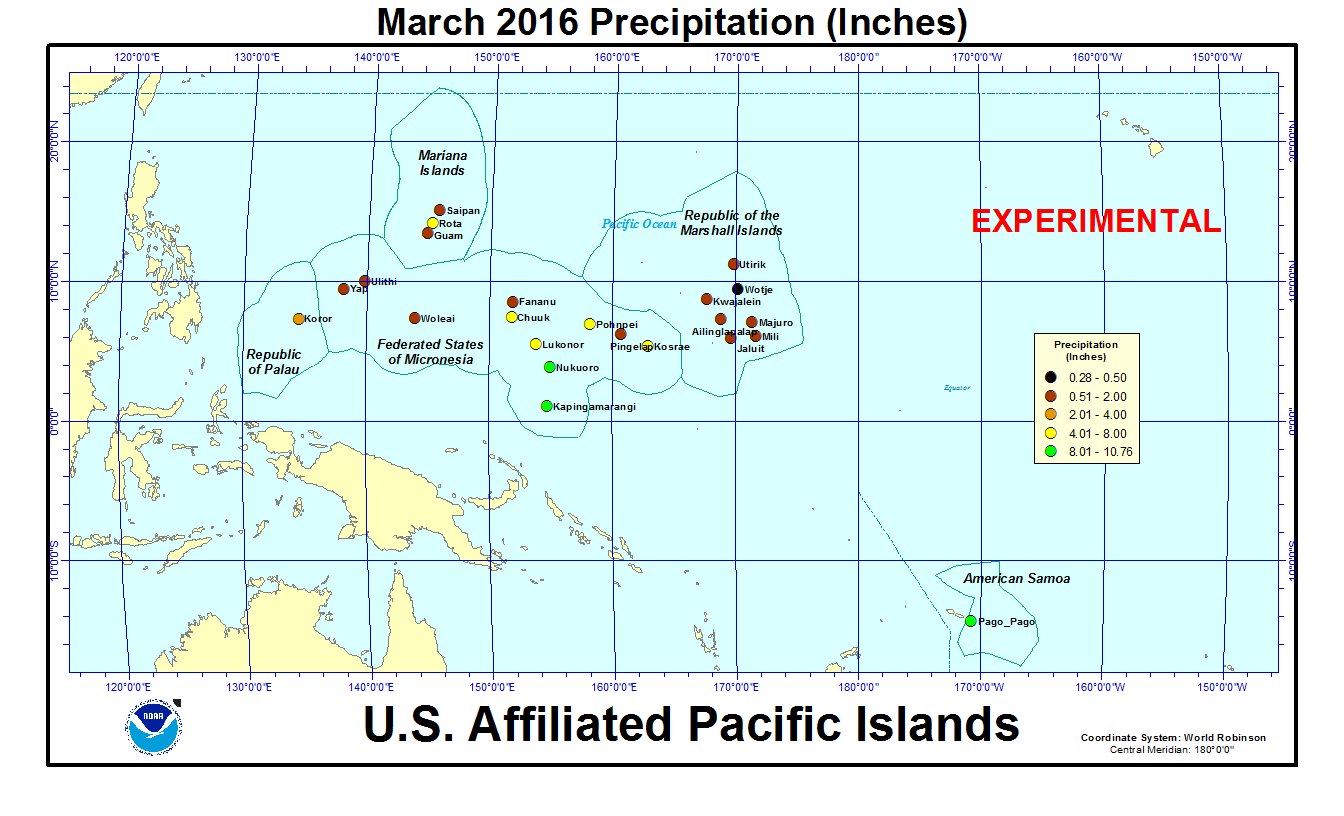
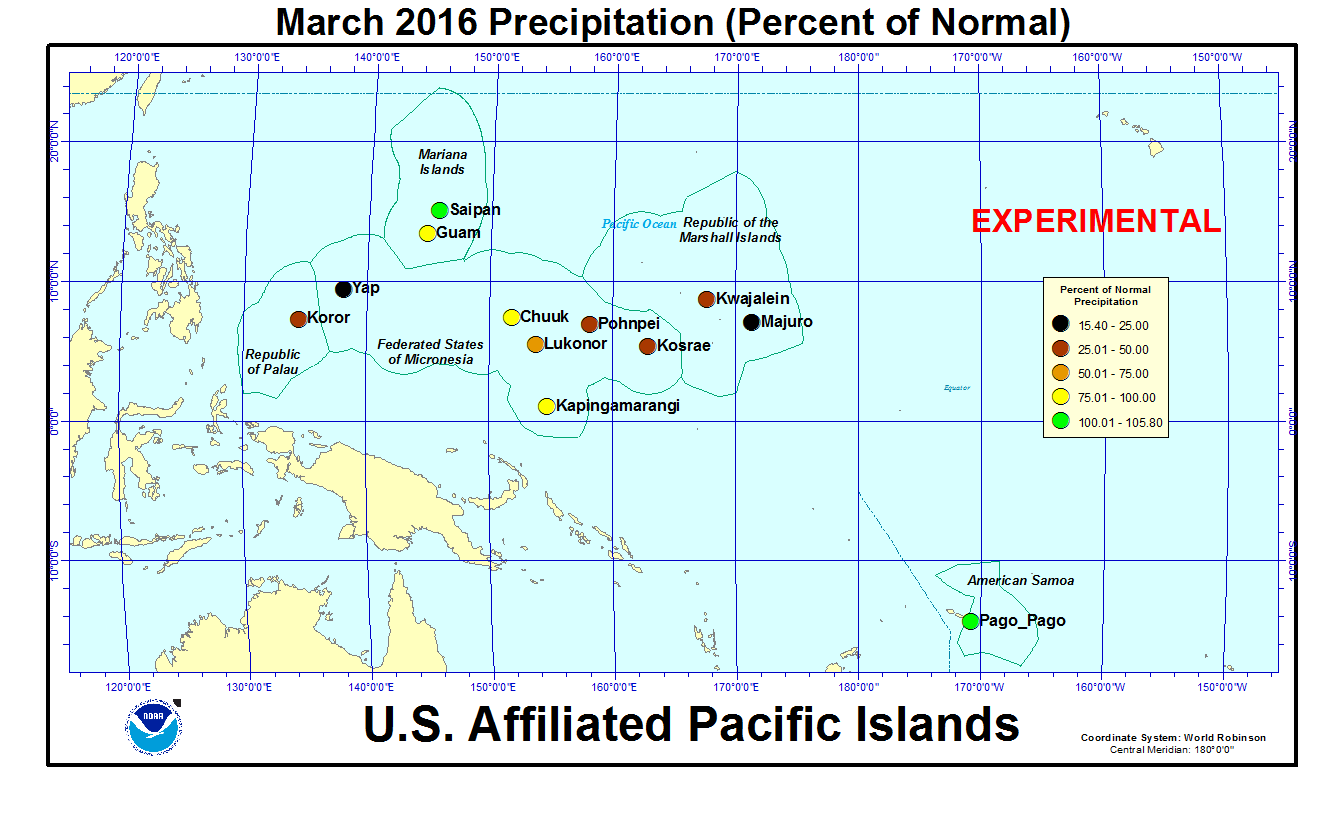
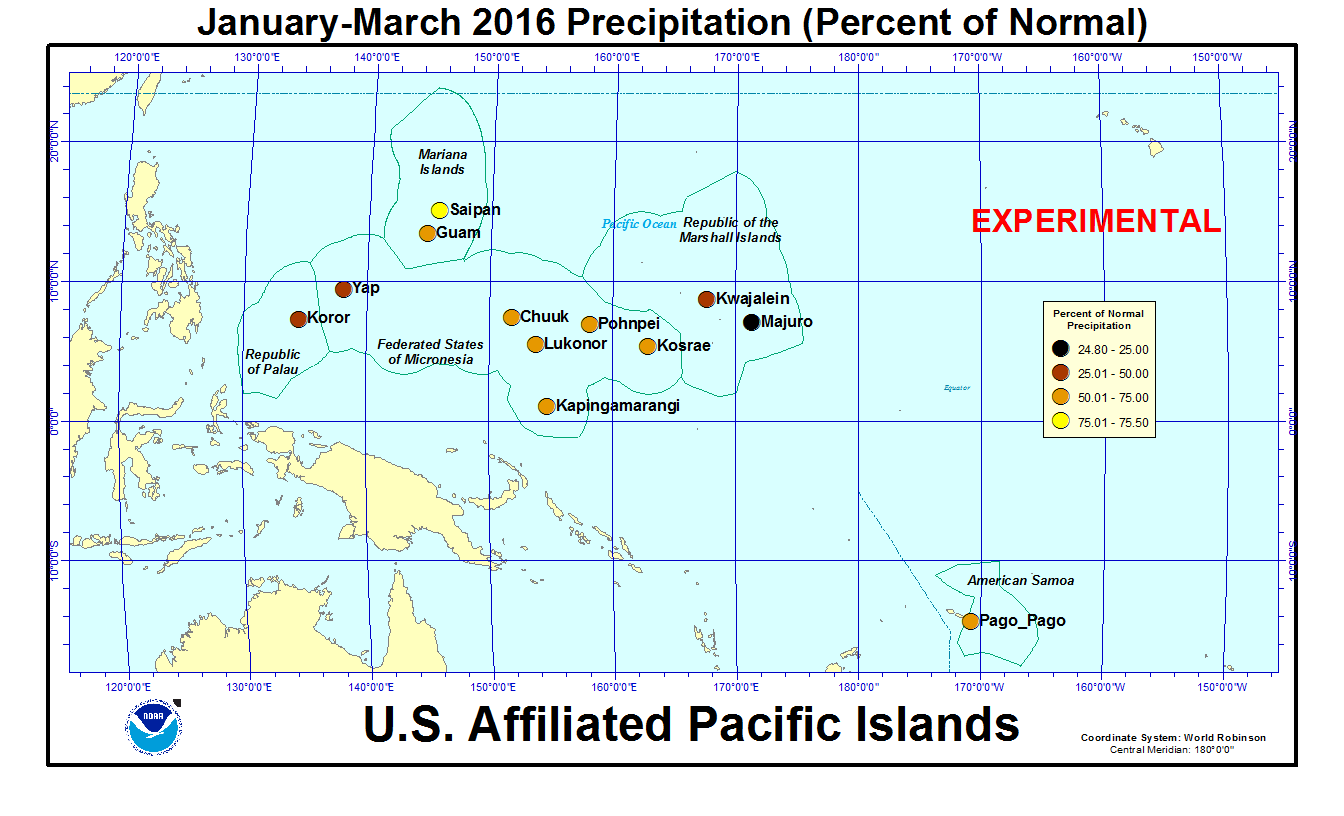
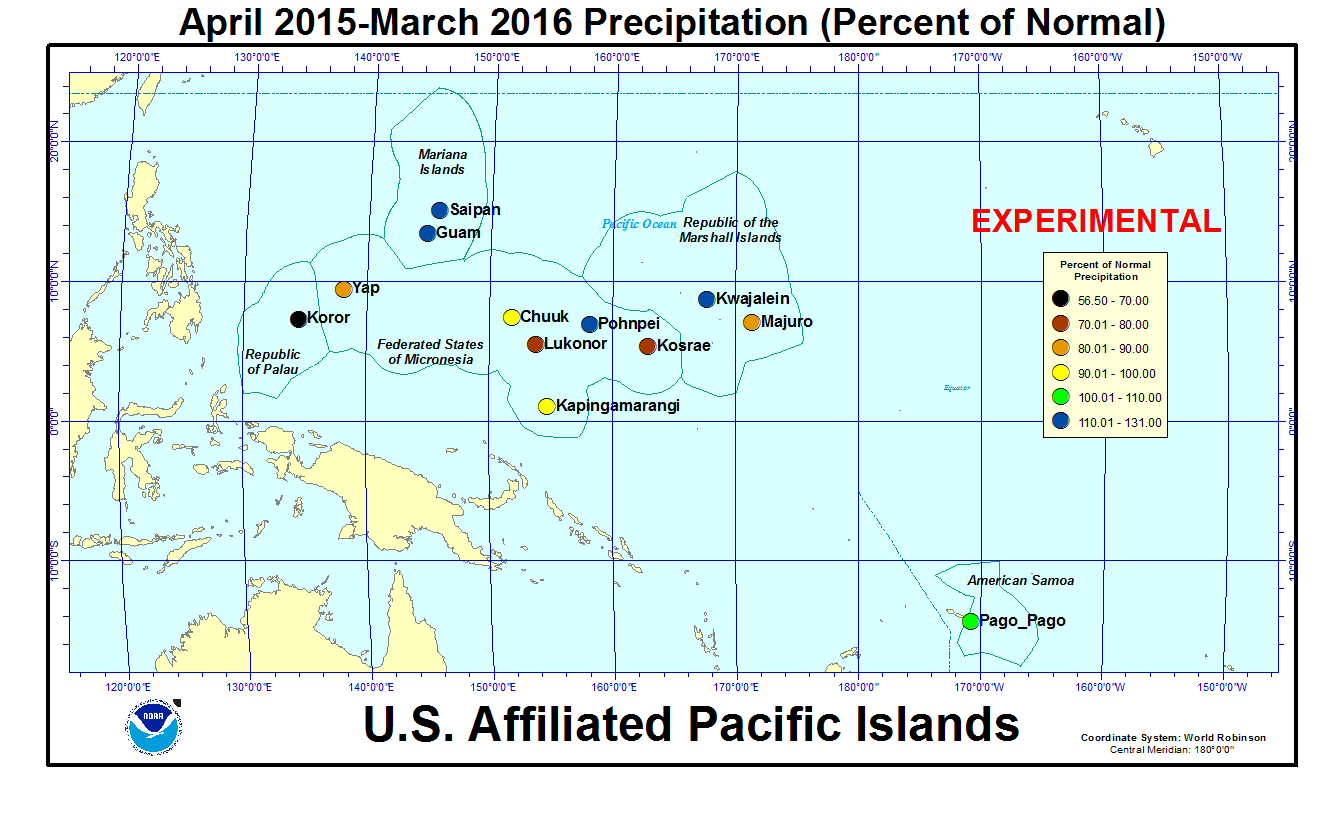
In the U.S. Affiliated Pacific Islands (maps — Federated States of Micronesia, Northern Mariana Islands, Marshall Islands, Republic of Palau, American Samoa, basinwide), March 2016 was wetter than normal at only Saipan, and near normal at Pago Pago. It was drier than normal at the rest of the primary stations.
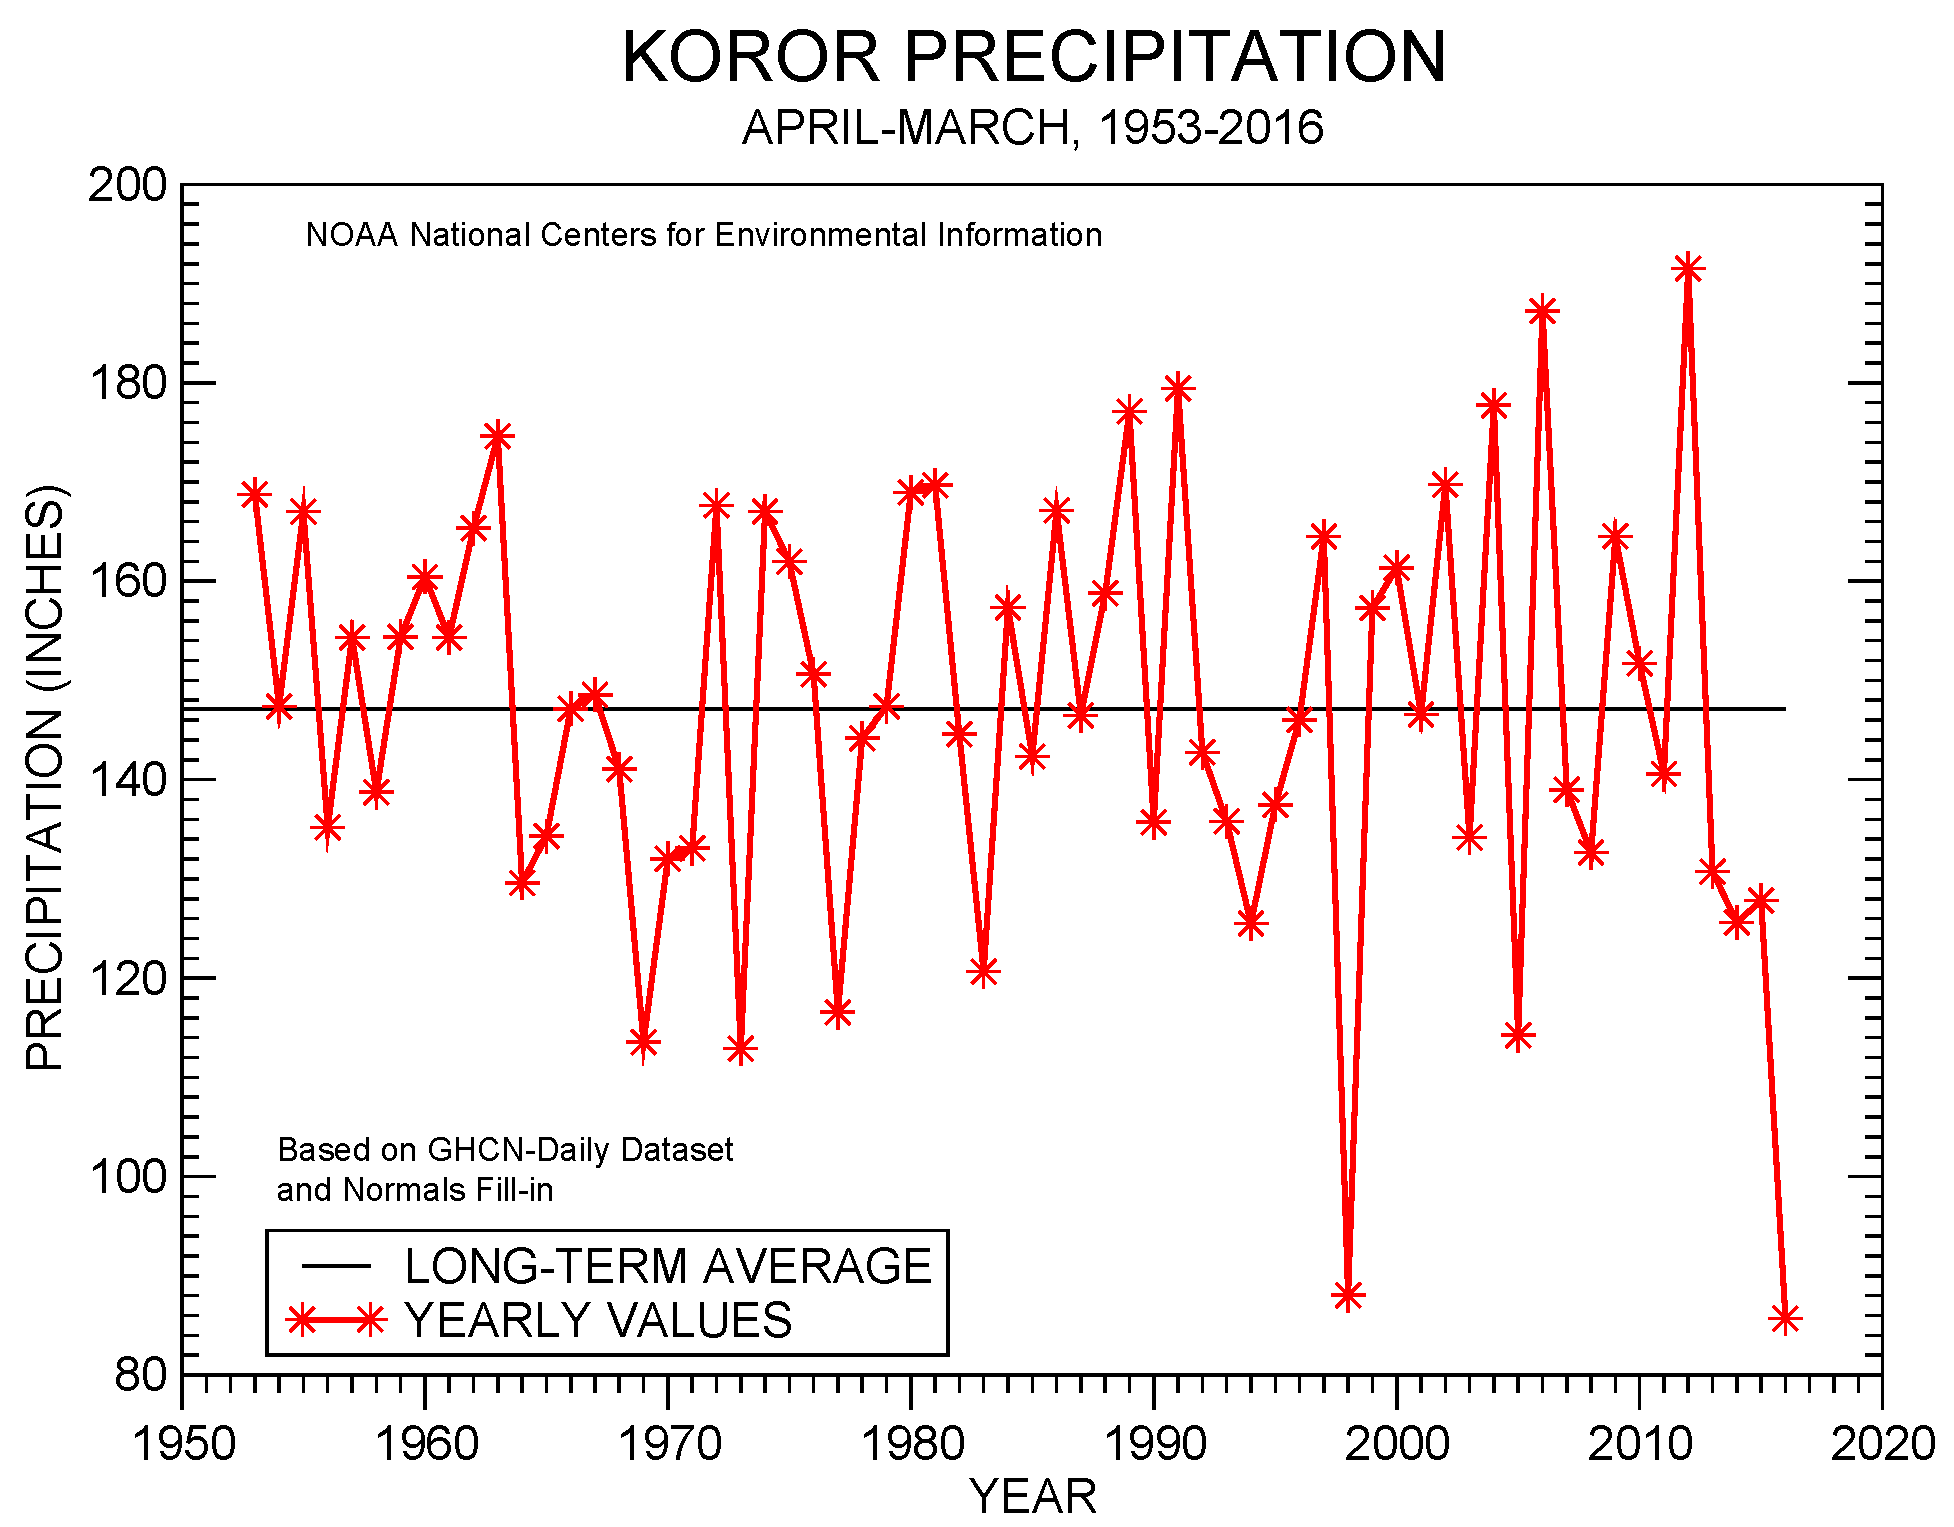
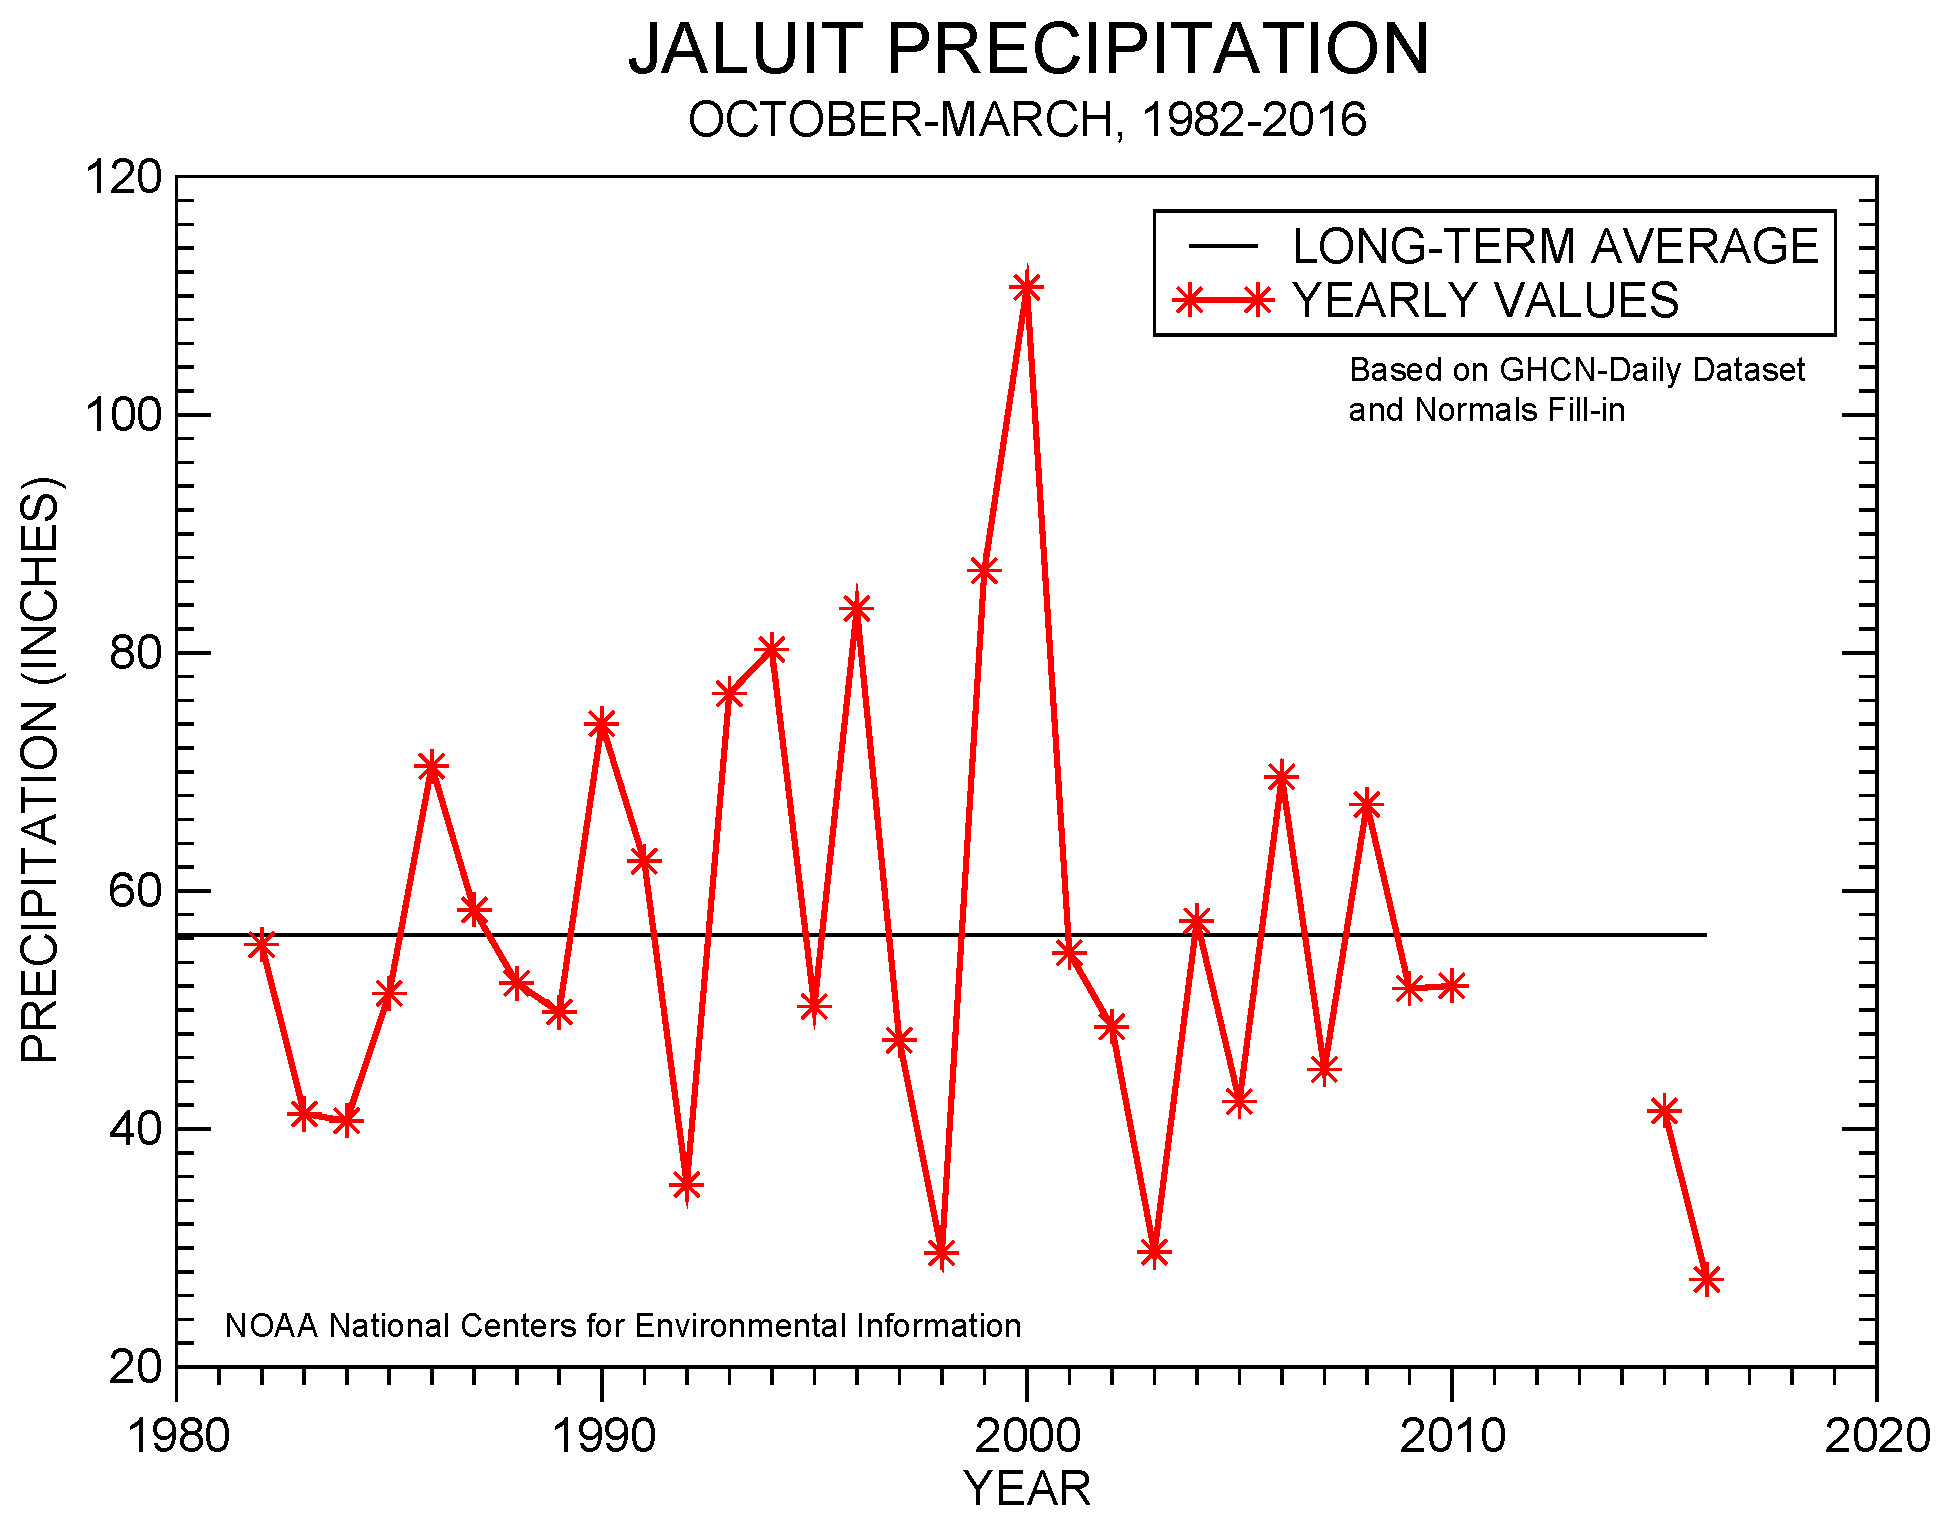
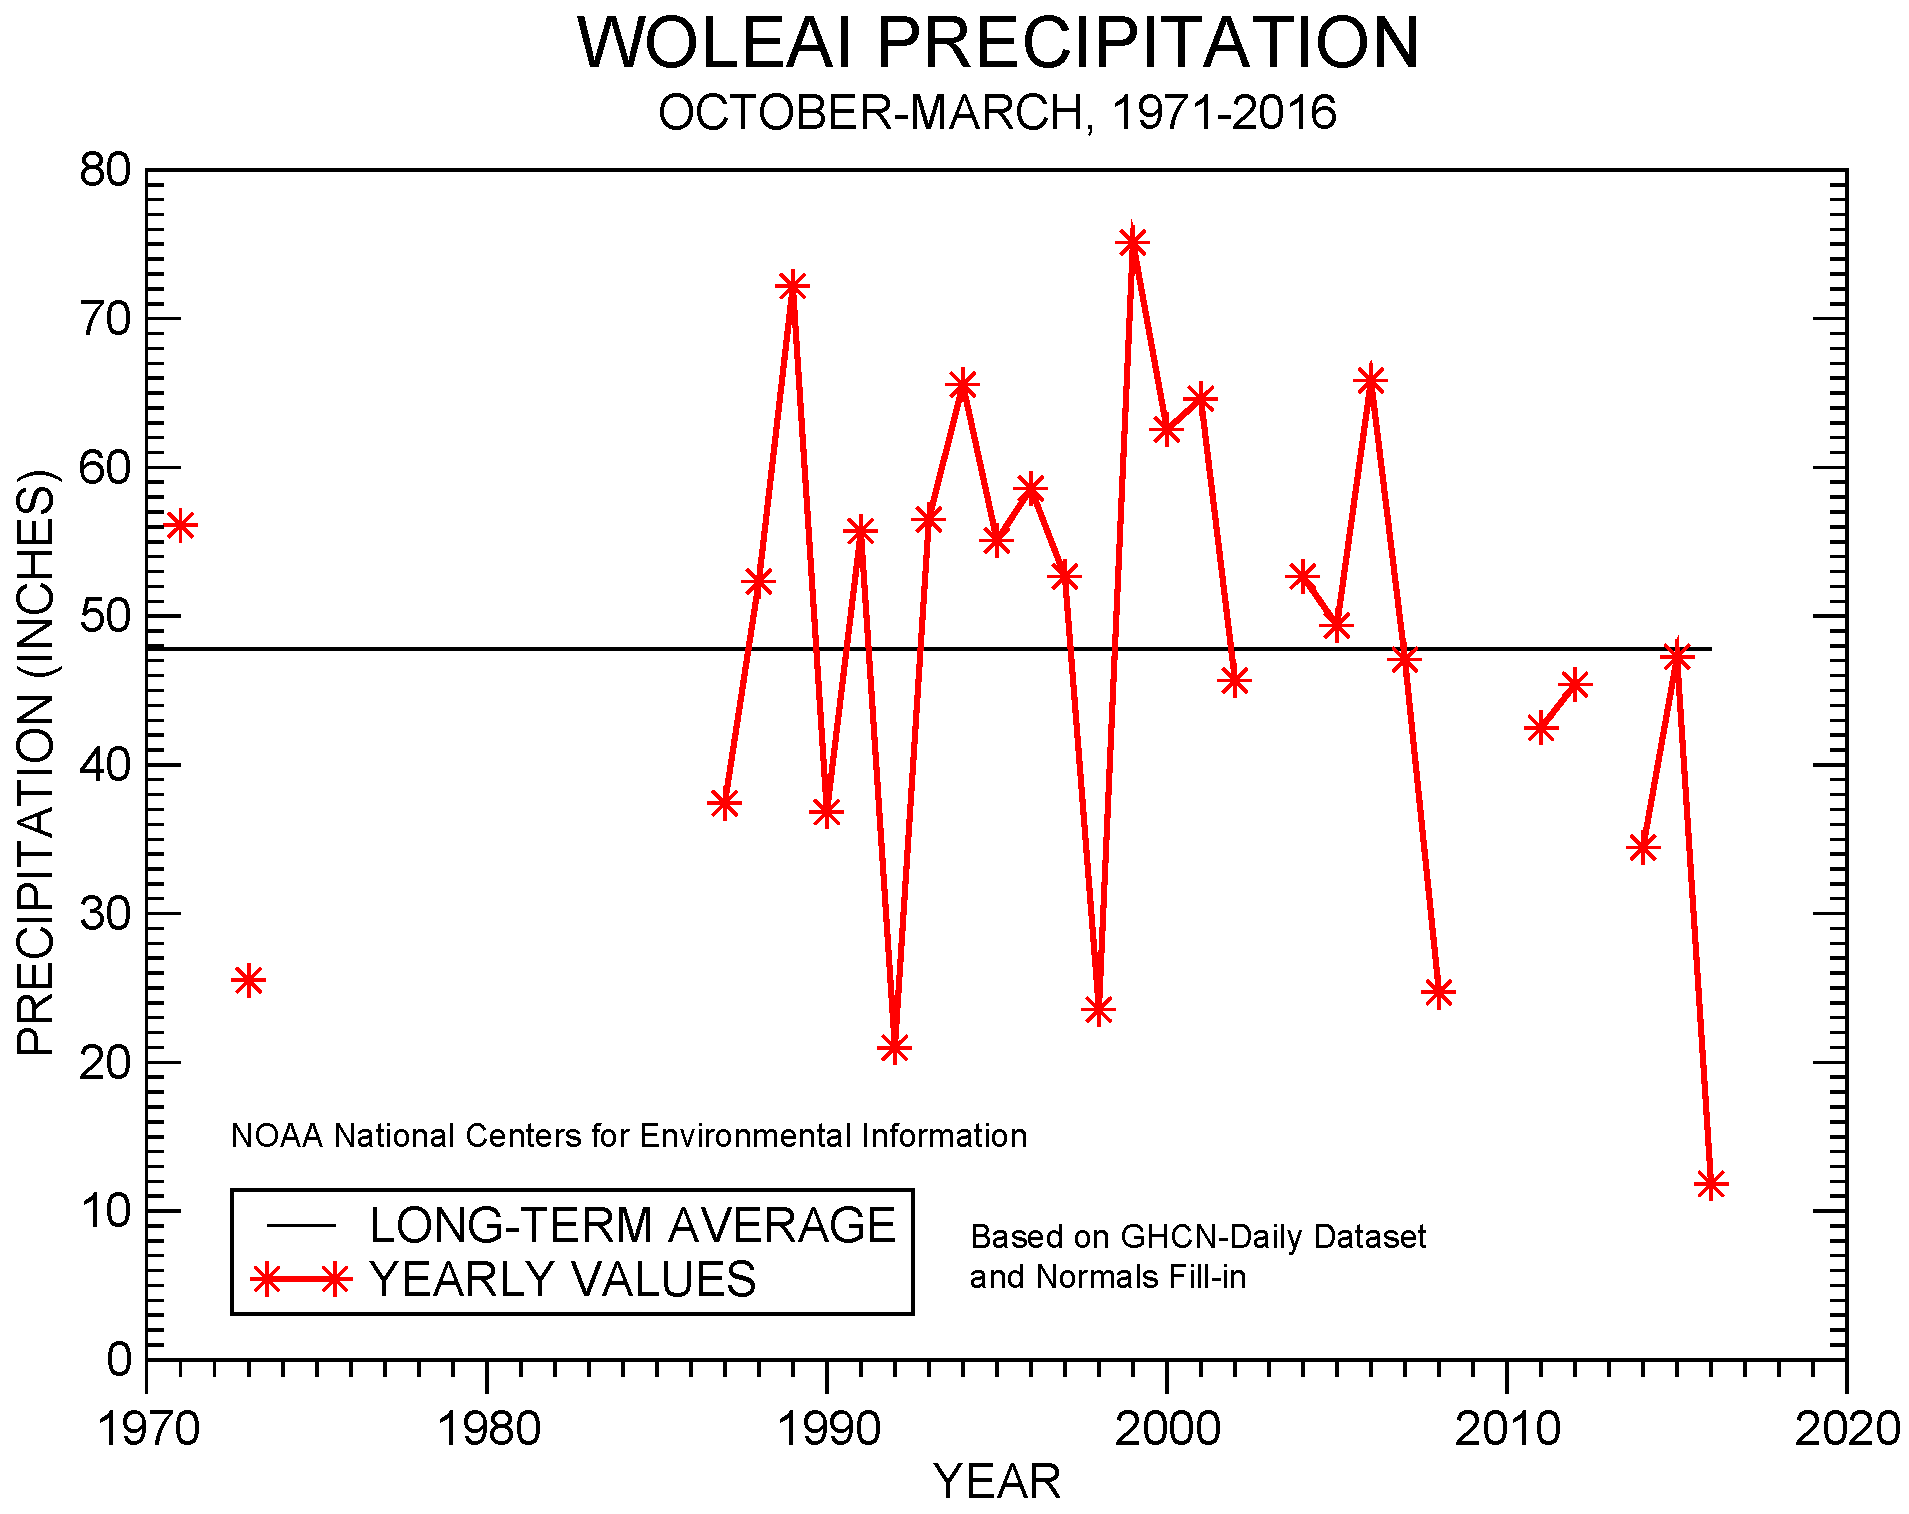
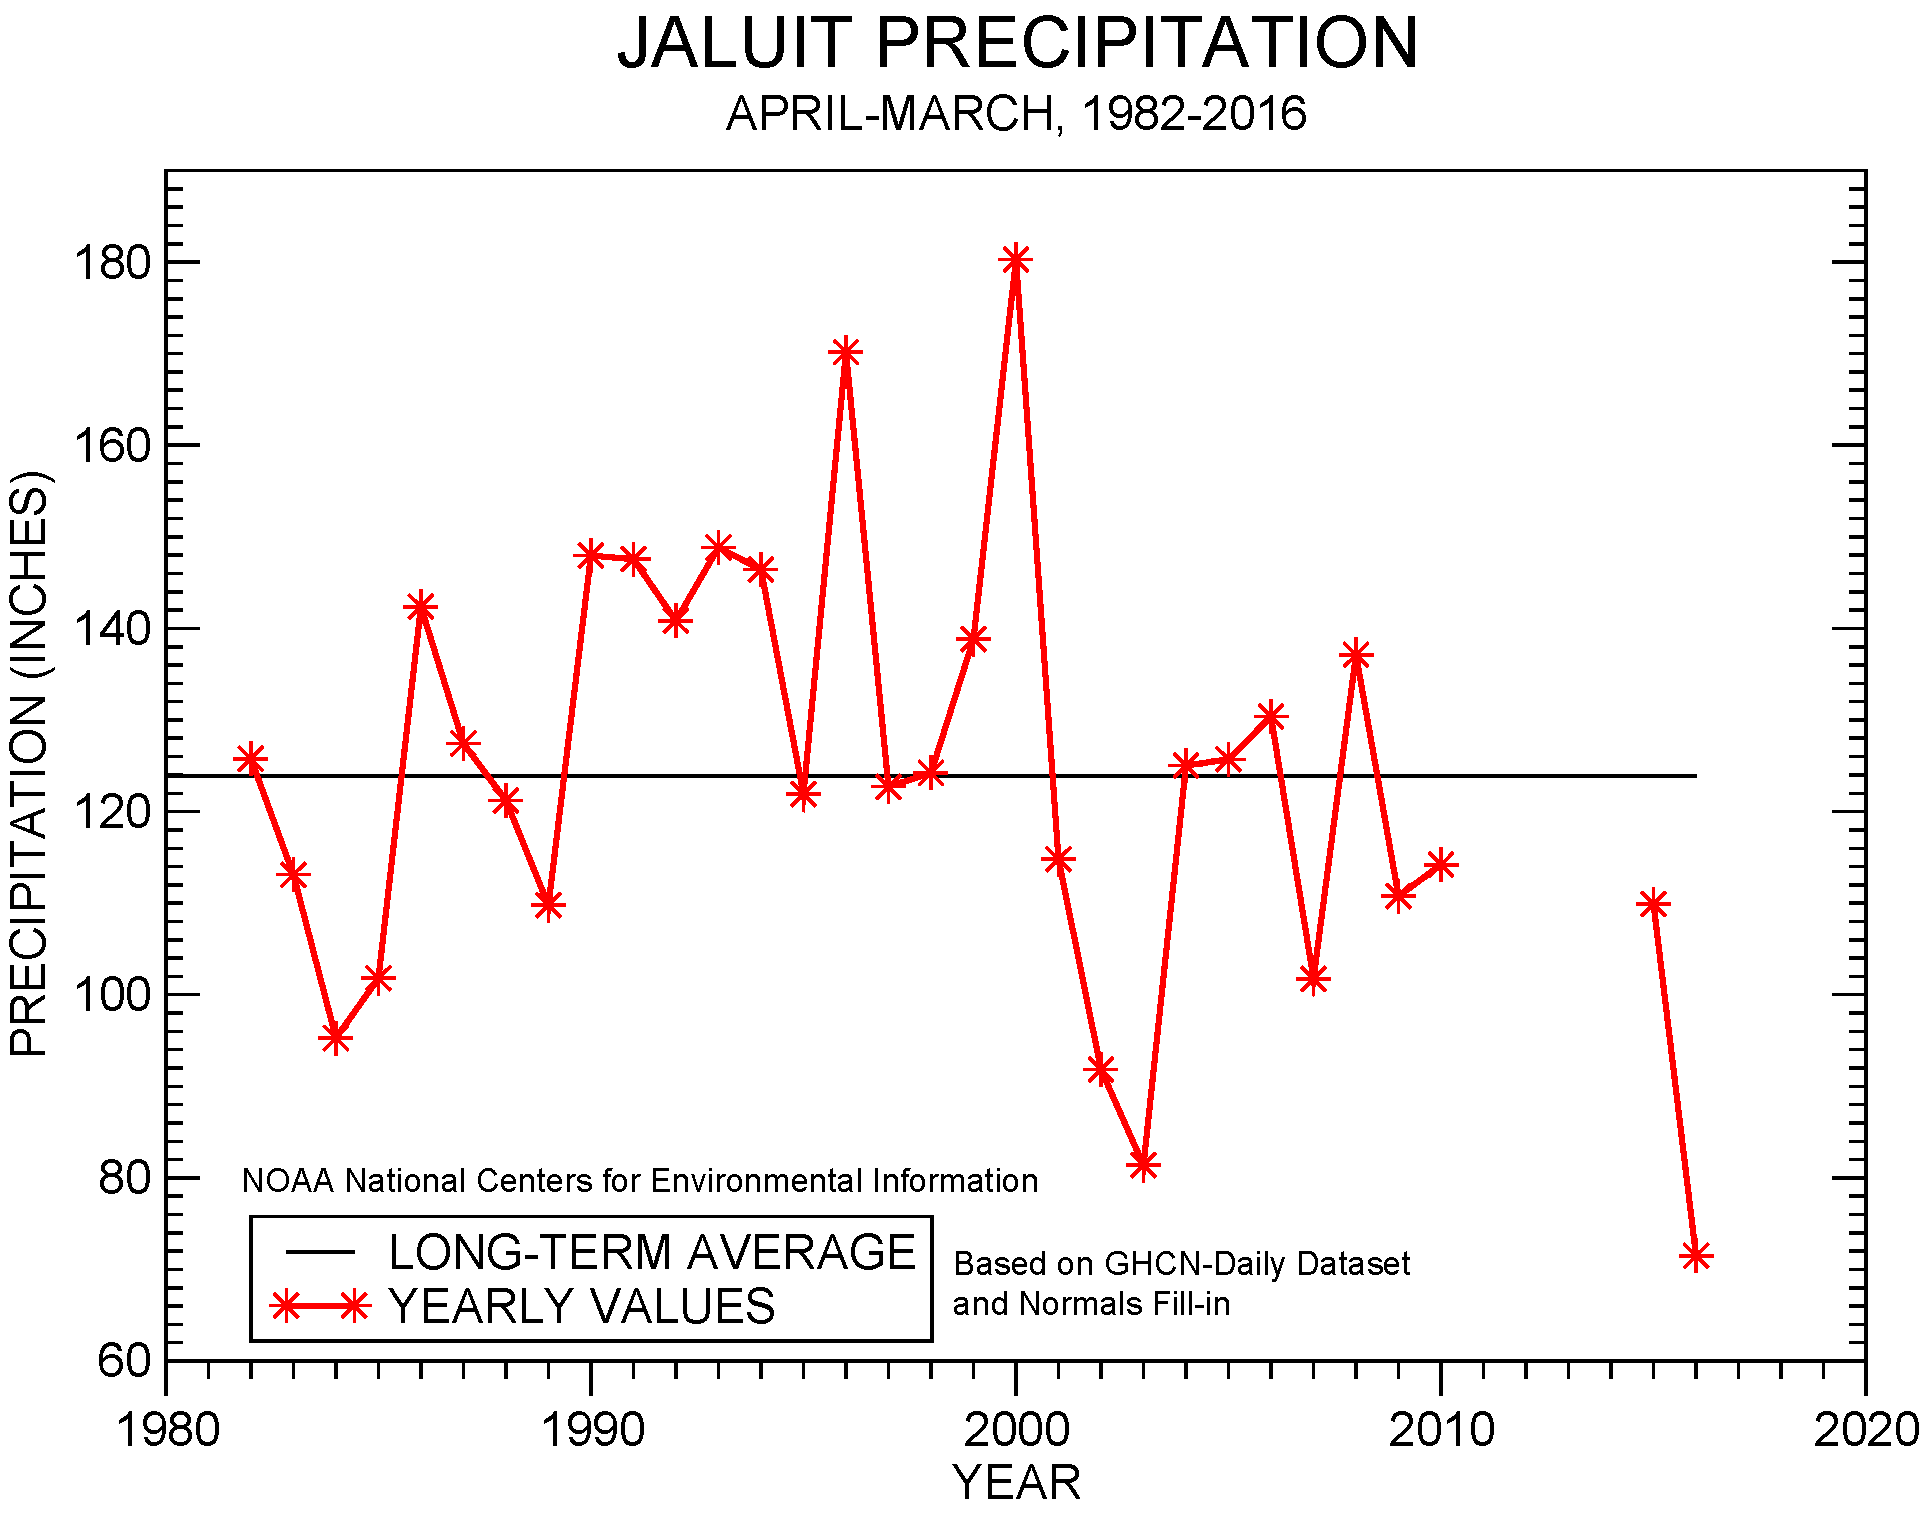
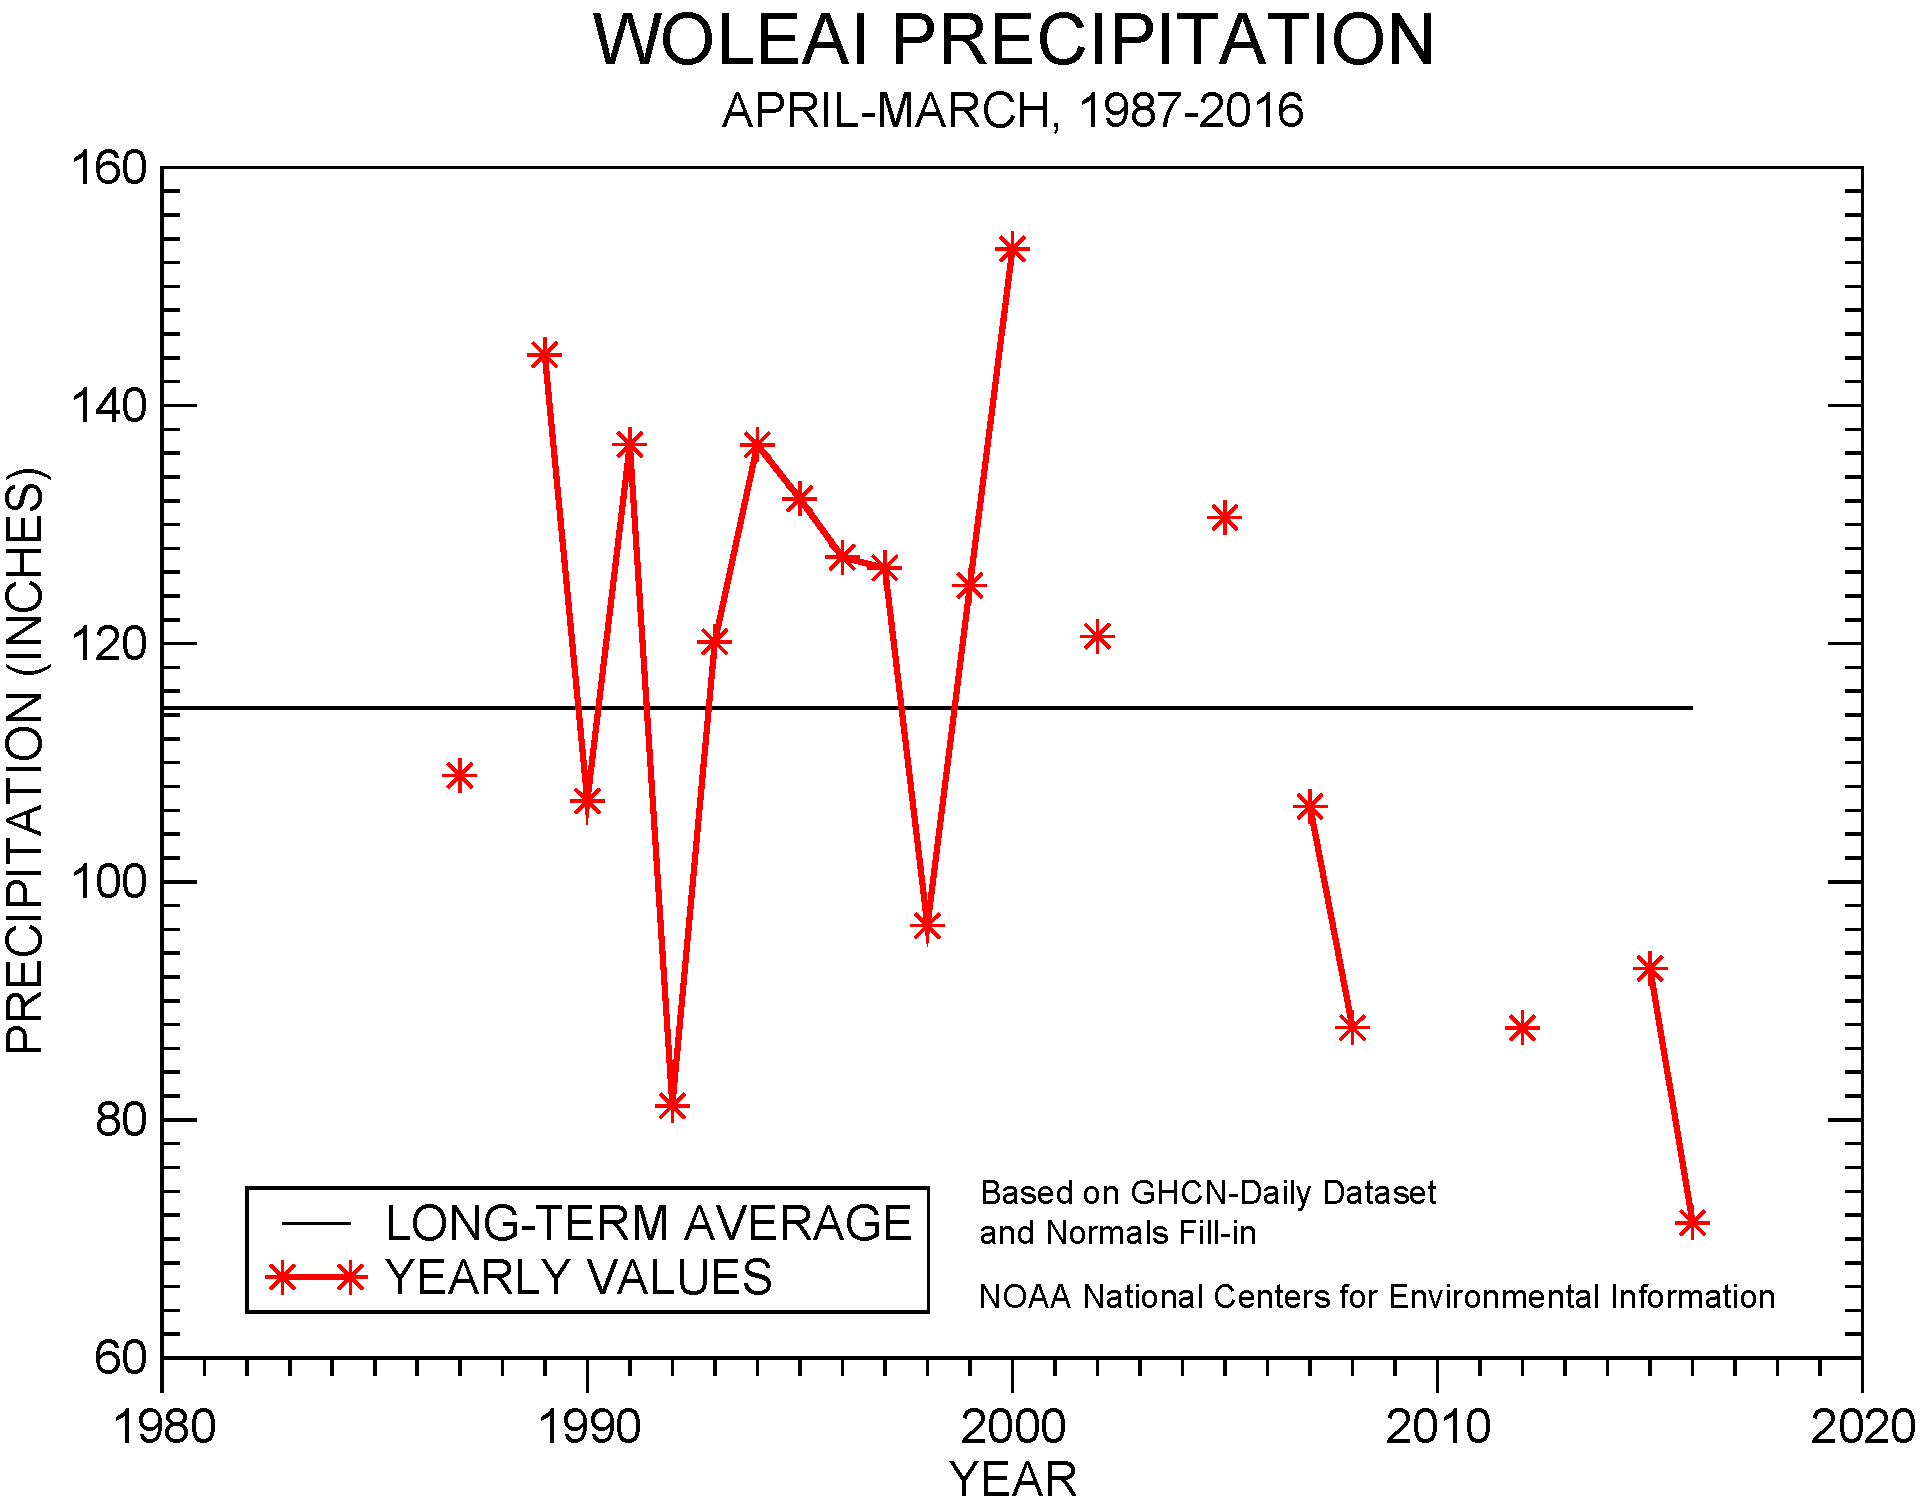
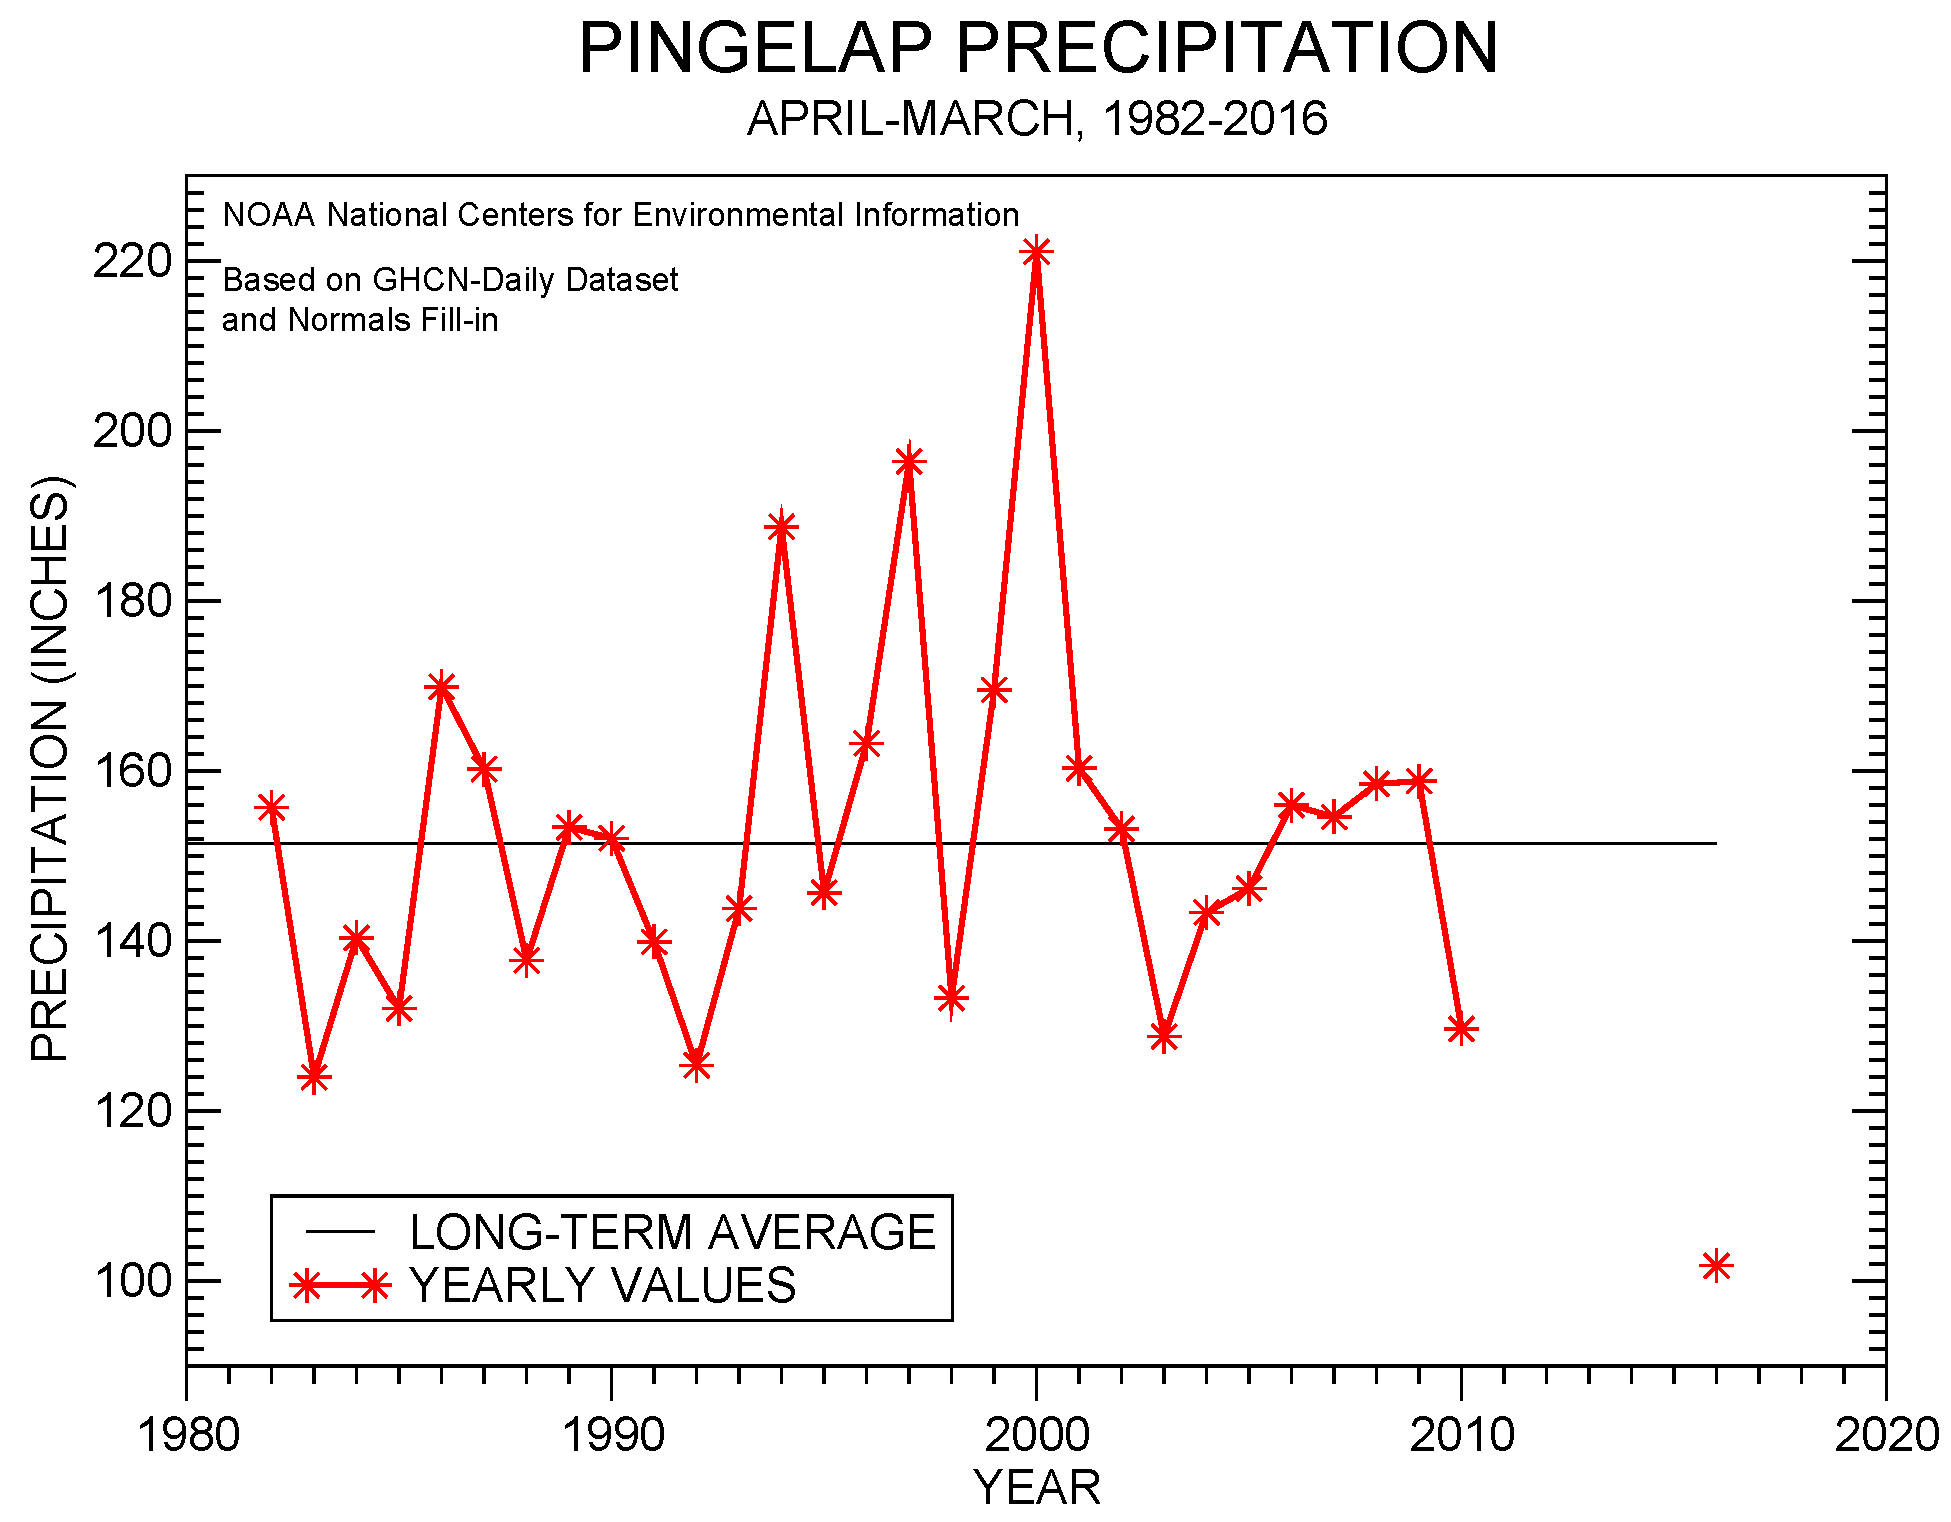
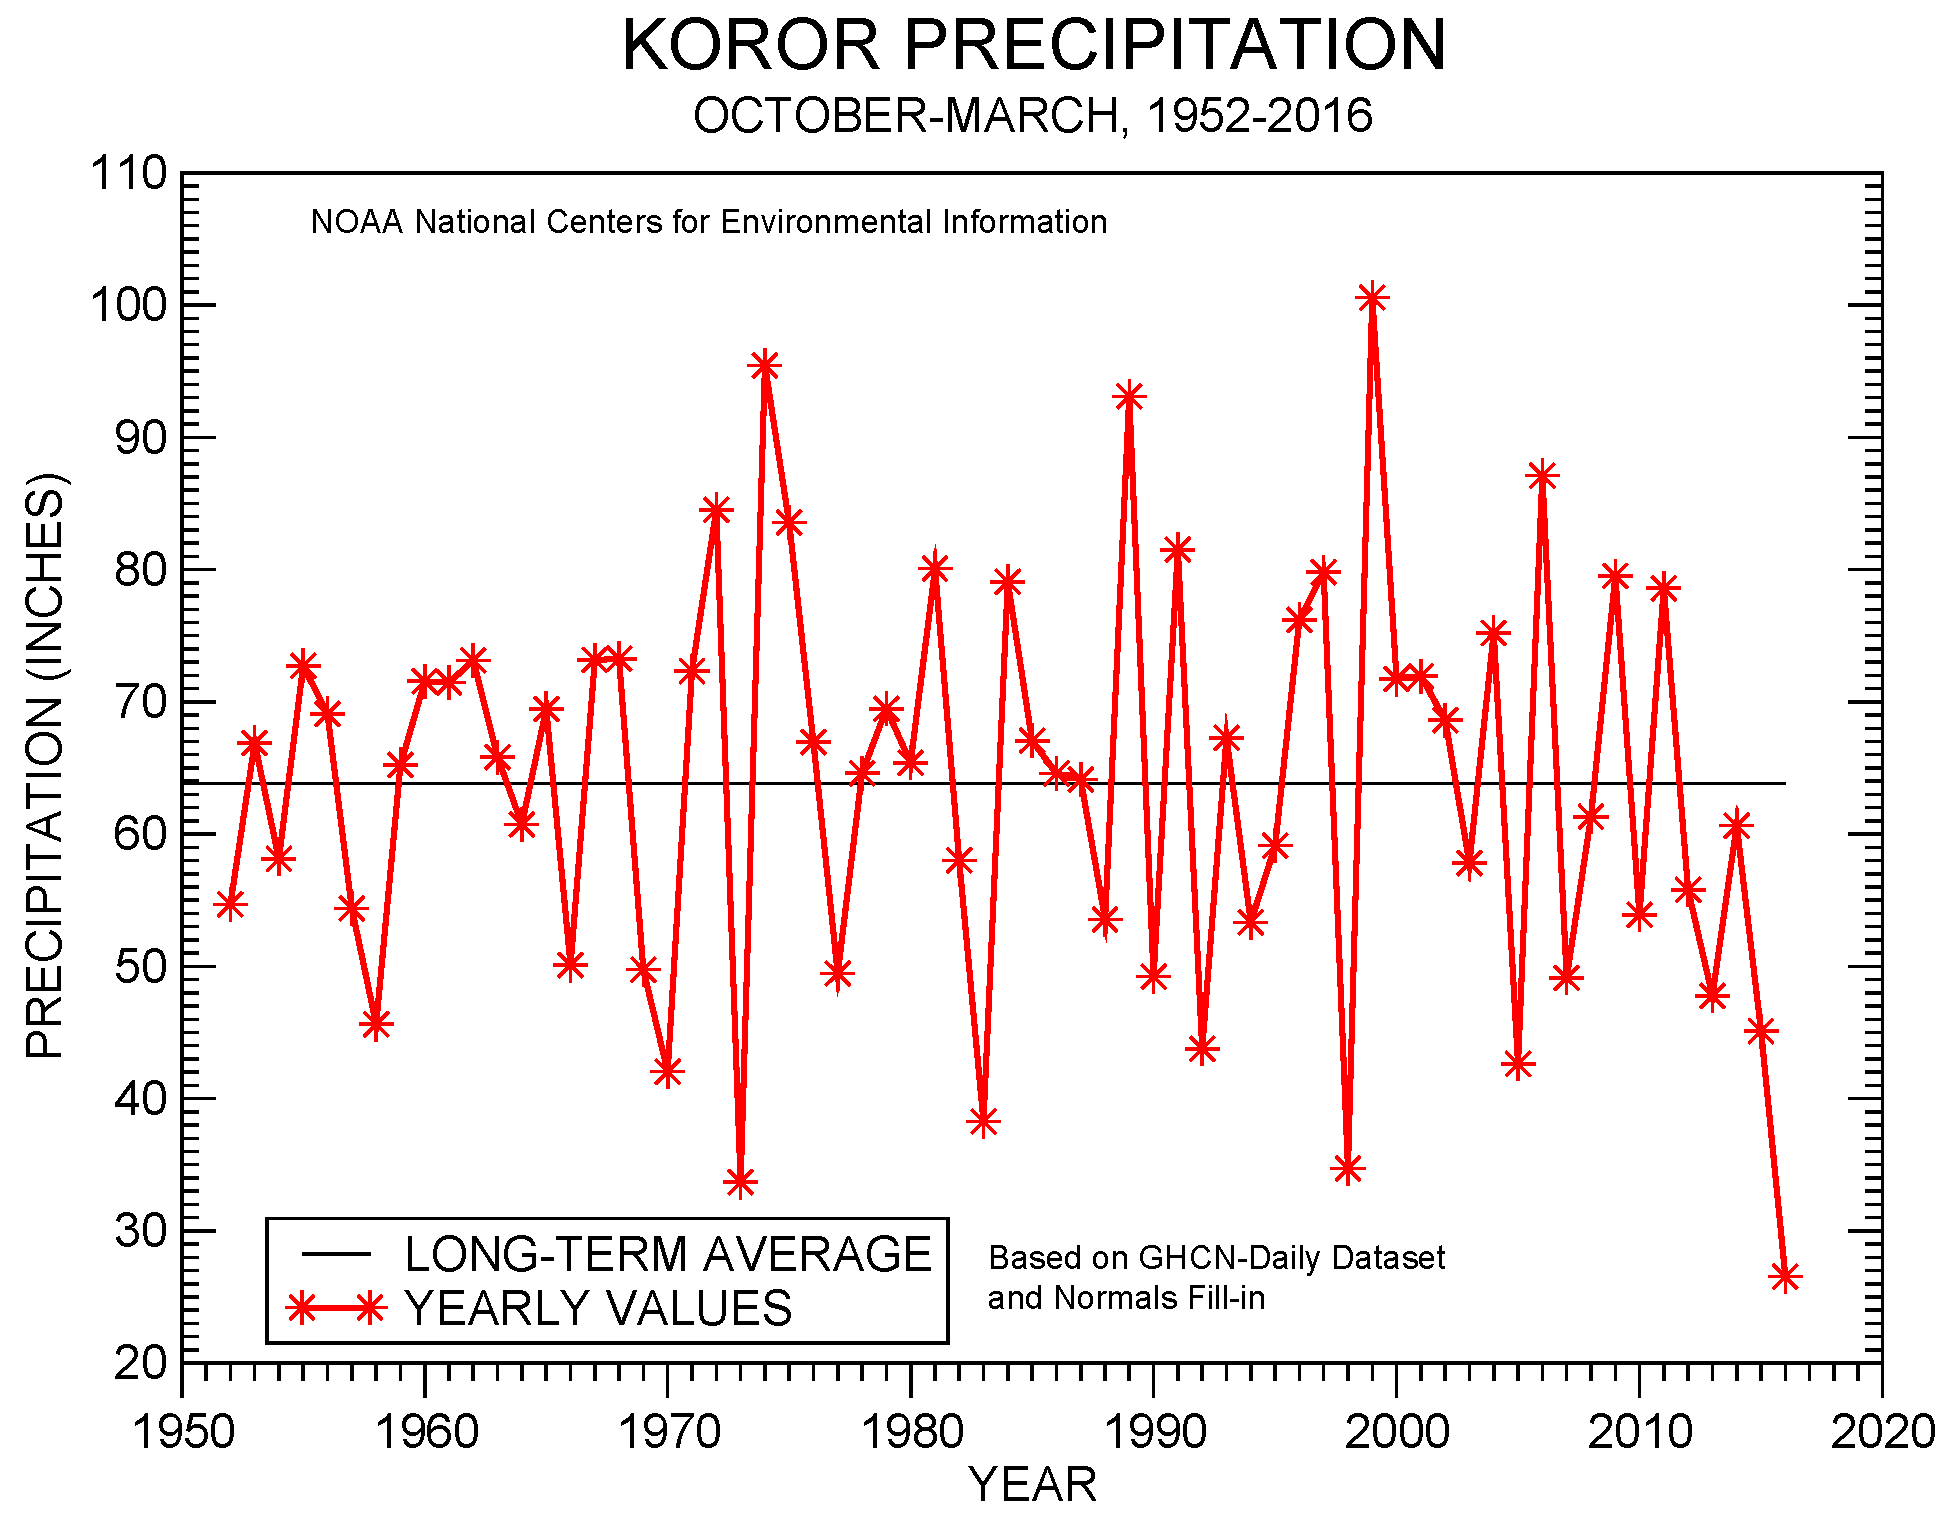
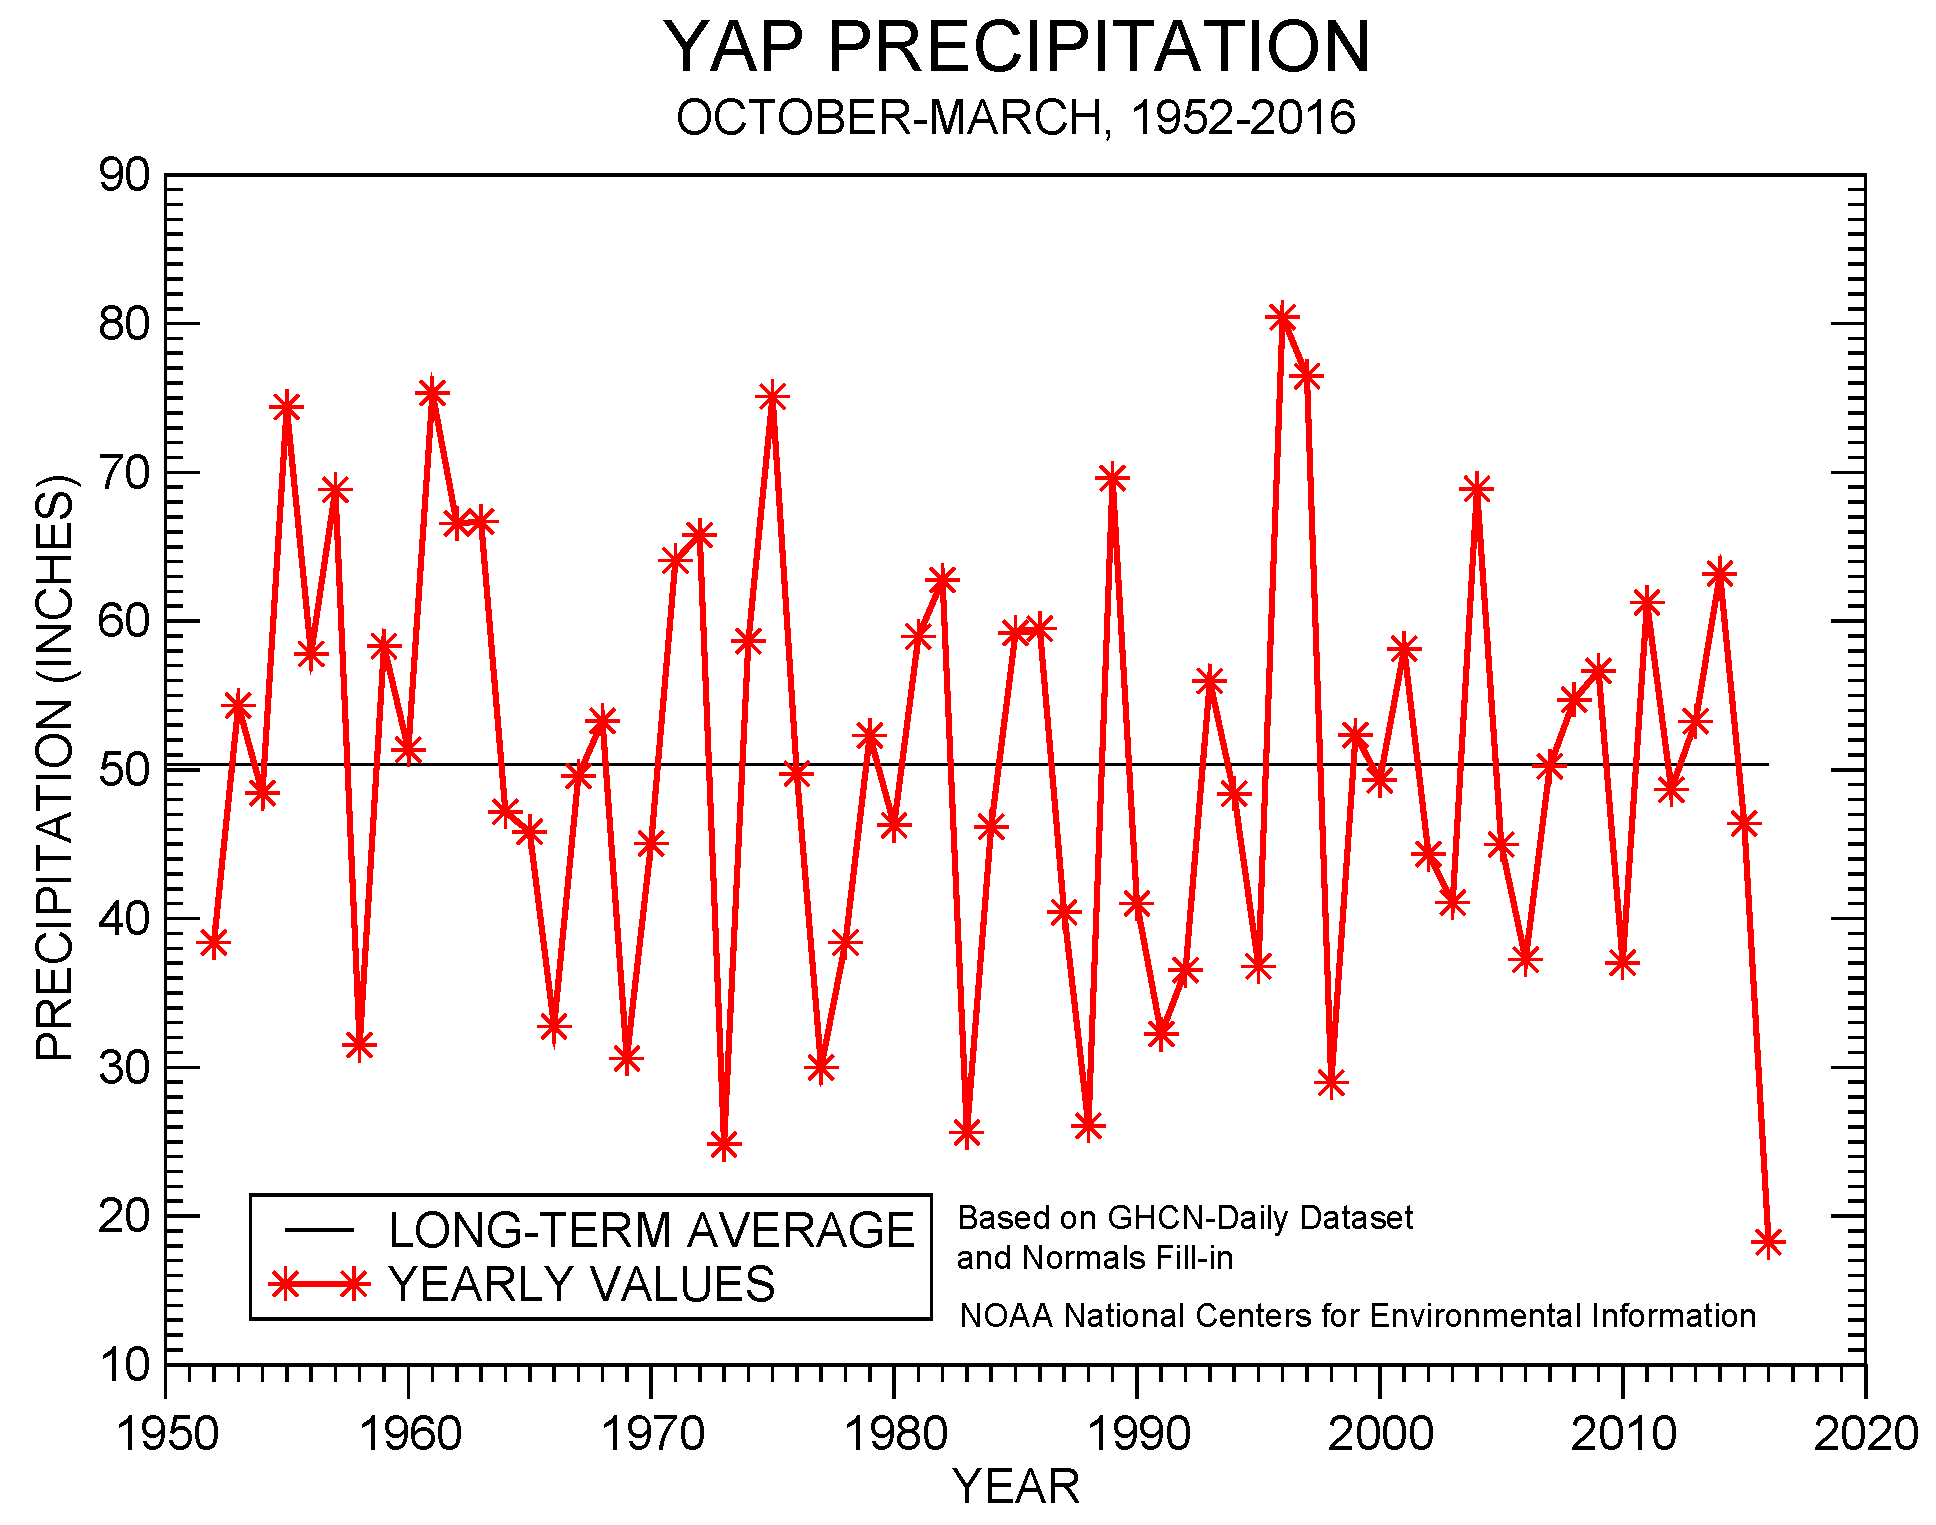
Rainfall amounts were below the minimum thresholds (4 or 8 inches) required to meet most monthly water needs at stations across the region. These included Guam and Saipan in the Mariana Islands; Koror in the Republic of Palau; Chuuk, Dugor, Fananu, Gilman, Kosrae, Lukonor, Luweech, Maap, North Fanif, Pingelap, Pohnpei, Rumung, Tamil, Tofol, Ulithi, Woleai, and Yap in the Federated States of Micronesia (FSM); and Ailinglapalap, Kwajalein, Majuro, Jaluit, Mili, Utirik, and Wotje in the Republic of the Marshall Islands. Only Kapingamarangi, Nukuoro, Pago Pago, and Rota had more than the monthly minimum threshold. Koror had 2.68 inches of rain in March, with the last six months, and 12 of the last 15 months, drier than 8 inches. In the FSM, Yap reported 0.70 inch of rain in March, with the last six months very dry. The stations on the islands around Yap have also been much drier than 8 inches for each of the last several months. Gilman and Ulithi have reported less than 8 inches for the last seven months, and Woleai for the last eight months. Woleai measured only 0.58 inch of rain for March. In the Marshall Islands, Ailinglapalap has had less than 8 inches of precipitation for 8 of the last 9, and 11 of the last 15, months; Jaluit for 11 of the last 14 months; and Mili for 12 of the last 17 months. Wotje received 0.28 inch of rain in March, Ailinglapalap 0.55 inch, and Utirik 0.77 inch. The 4- and 8-inch thresholds are important because, if monthly precipitation falls below the threshold, then drought becomes a concern. Below-normal rainfall is expected to continue for many of these stations as the strong El Niño persists.
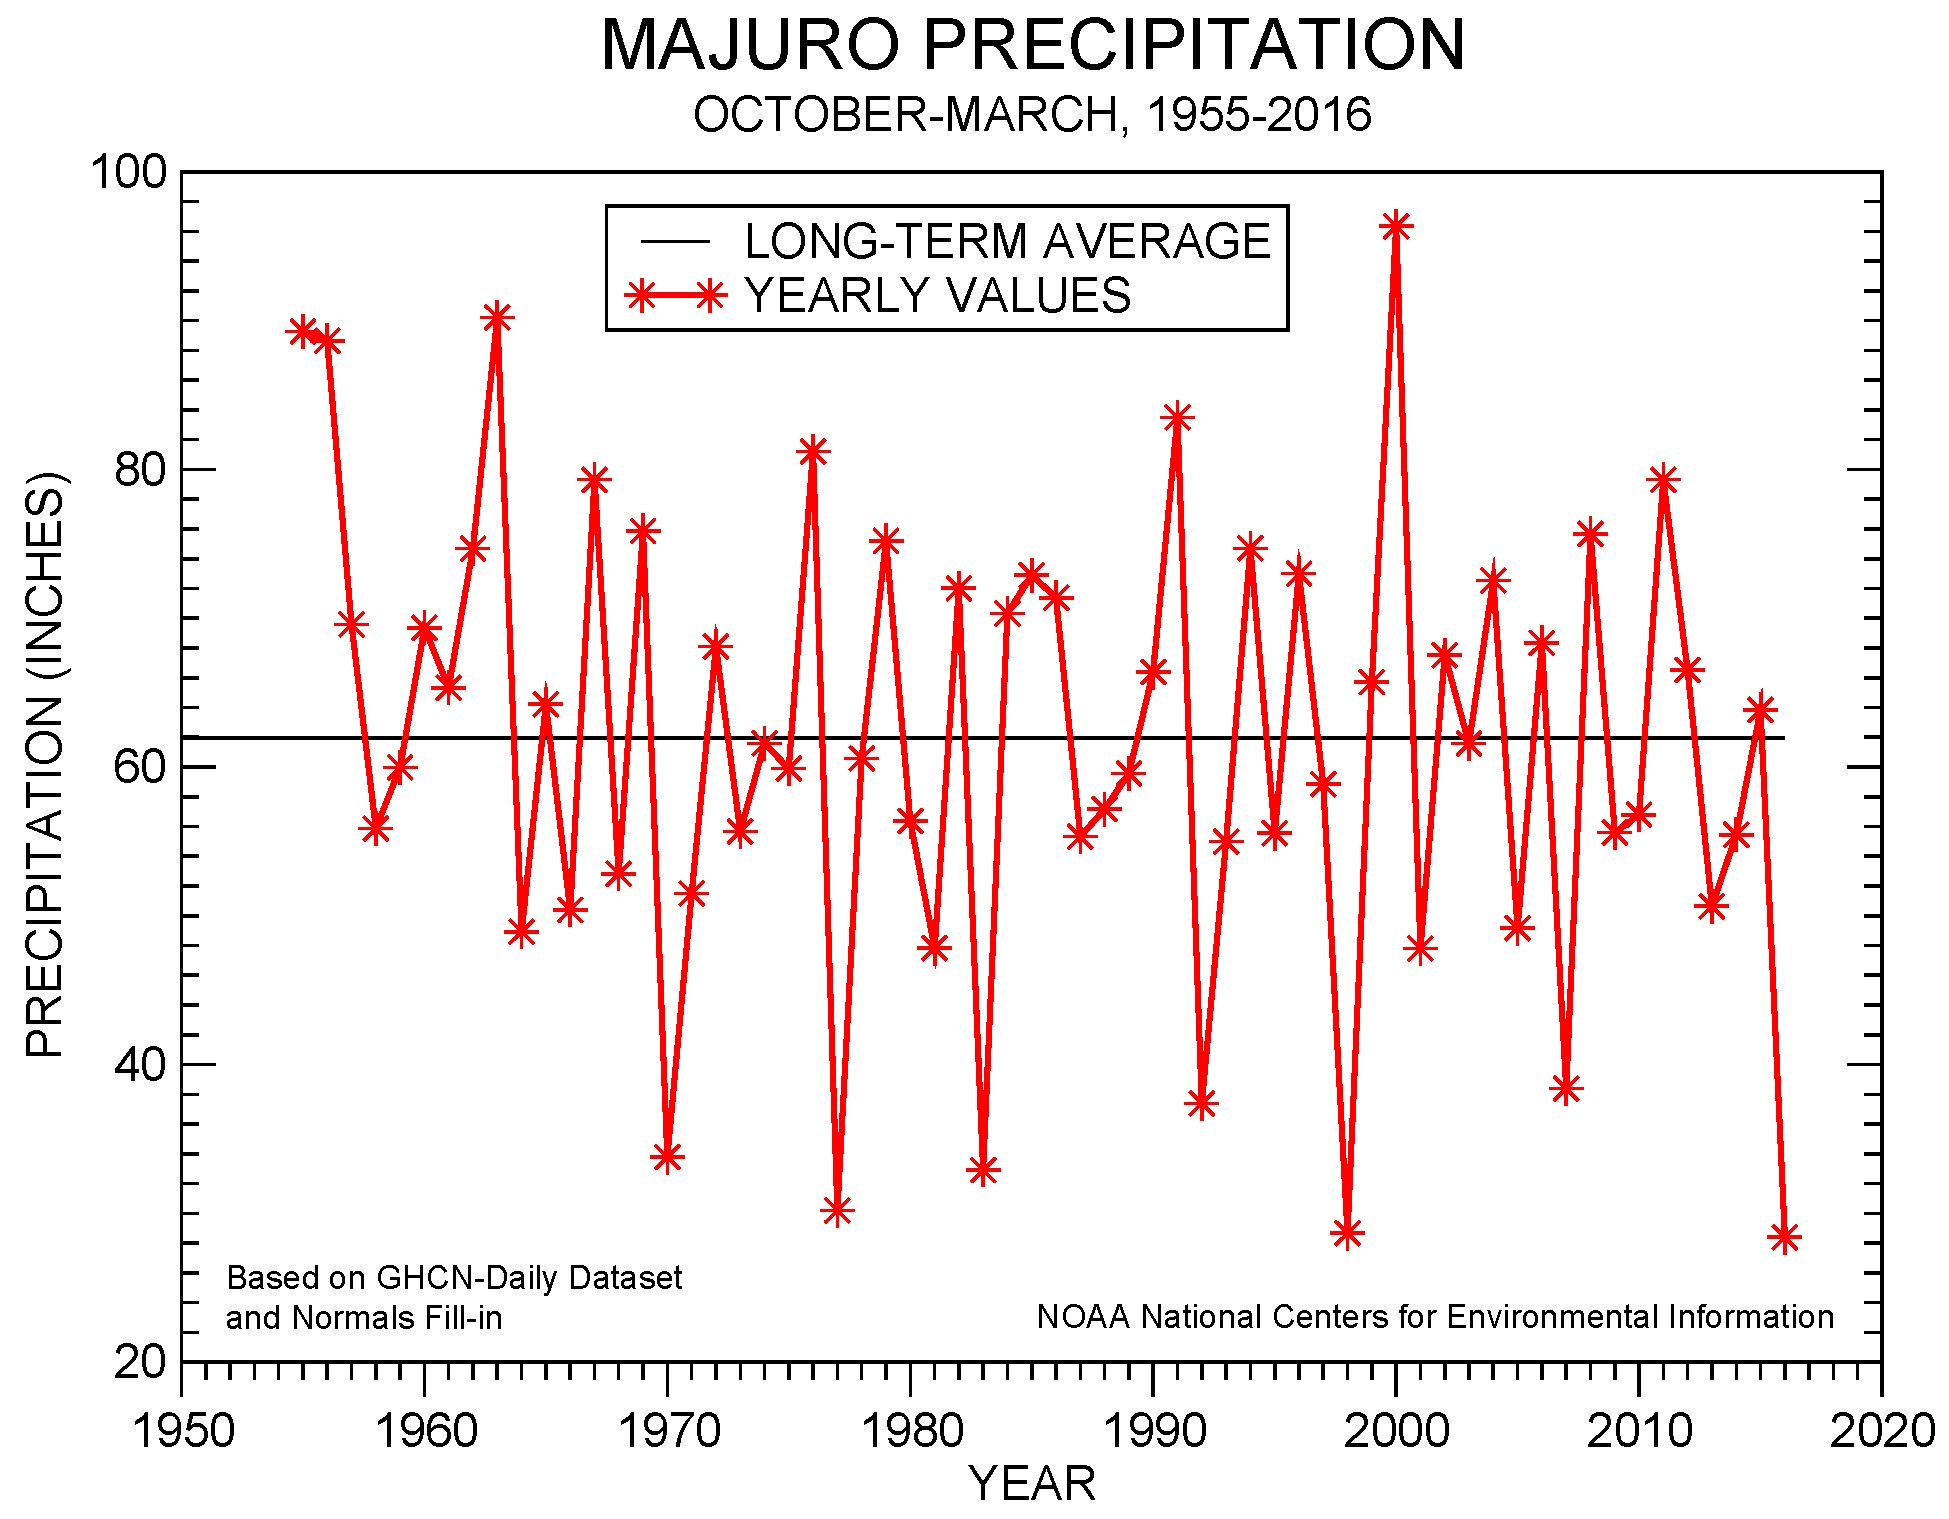
An analysis of historical data for the USAPI stations in the Global Historical Climatology Network-Daily (GHCN-D) dataset, augmented with fill-in data from the 1981-2010 Normals, indicated that several stations had record or near-record dryness during March, the last six months, and the last 12 months. Some stations have a long period of record and their dataset is fairly complete, while other stations have a shorter period of record and the dataset has some missing data. March 2016 was the driest March on record for Mili (out of 33 years) and Ulithi (out of 35 years). The last six months have been the driest October-March on record for Koror and Yap out of 65 years of data, for Majuro out of 62 years of data, for Jaluit out of 31 years of data, and for Woleai out of 28 years of data. April 2015-March 2016 was the driest such 12-month period for Koror (out of 64 years of data), Jaluit (31 years), Woleai (20 years), and Pingelap (30 years).
Rank of 1 = driest.
| Station | March 2016 Rank |
March No. of Years |
October 2015- March 2016 Rank |
October- March No. of Years |
April 2015- March 2016 Rank |
April- March No. of Years |
Period of Record |
| Jaluit | 3 | 33 | 1 | 31 | 1 | 31 | 1981-2016 |
| Koror | 4 | 65 | 1 | 65 | 1 | 64 | 1951-2016 |
| Woleai | 2 | 34 | 1 | 28 | 1 | 20 | 1968-2016 |
| Yap | 2 | 65 | 1 | 65 | 6 | 64 | 1951-2016 |
| Majuro | 6 | 62 | 1 | 62 | 15 | 61 | 1954-2016 |
| Mili | 1 | 33 | 2 | 31 | 4 | 31 | 1981-2016 |
| Ulithi | 1 | 35 | 2 | 33 | 12 | 33 | 1981-2016 |
| Ailinglapalap | 4 | 33 | 2 | 31 | N/A | 30 | 1981-2016 |
| Pingelap | 4 | 33 | 3 | 32 | 1 | 30 | 1981-2016 |
| Kosrae | 6 | 46 | 3 | 33 | 4 | 28 | 1954-2016 |
| Lukonor | 4 | 32 | 4 | 30 | 2 | 19 | 1981-2016 |
| Saipan | 23 | 35 | 4 | 27 | 2 | 27 | 1981-2016 |
| Pohnpei | 5 | 65 | 4 | 65 | 52 | 64 | 1951-2016 |
| Kwajalein | 8 | 64 | 5 | 64 | 42 | 63 | 1952-2016 |
| Kapingamarangi | 10 | 26 | 6 | 18 | 5 | 11 | 1962-2016 |
| Chuuk | 20 | 65 | 7 | 65 | 18 | 64 | 1951-2016 |
| Guam | 11 | 60 | 10 | 59 | 44 | 59 | 1957-2016 |
| Nukuoro | 5 | 33 | 14 | 31 | 23 | 30 | 1981-2016 |
| Pago Pago | 28 | 50 | 26 | 50 | 27 | 50 | 1966-2016 |
| Wotje | 5 | 33 | N/A | 30 | N/A | 30 | 1981-2016 |
| Utirik | 2 | 14 | N/A | 6 | N/A | 2 | 1985-2016 |
 |
 |
 |
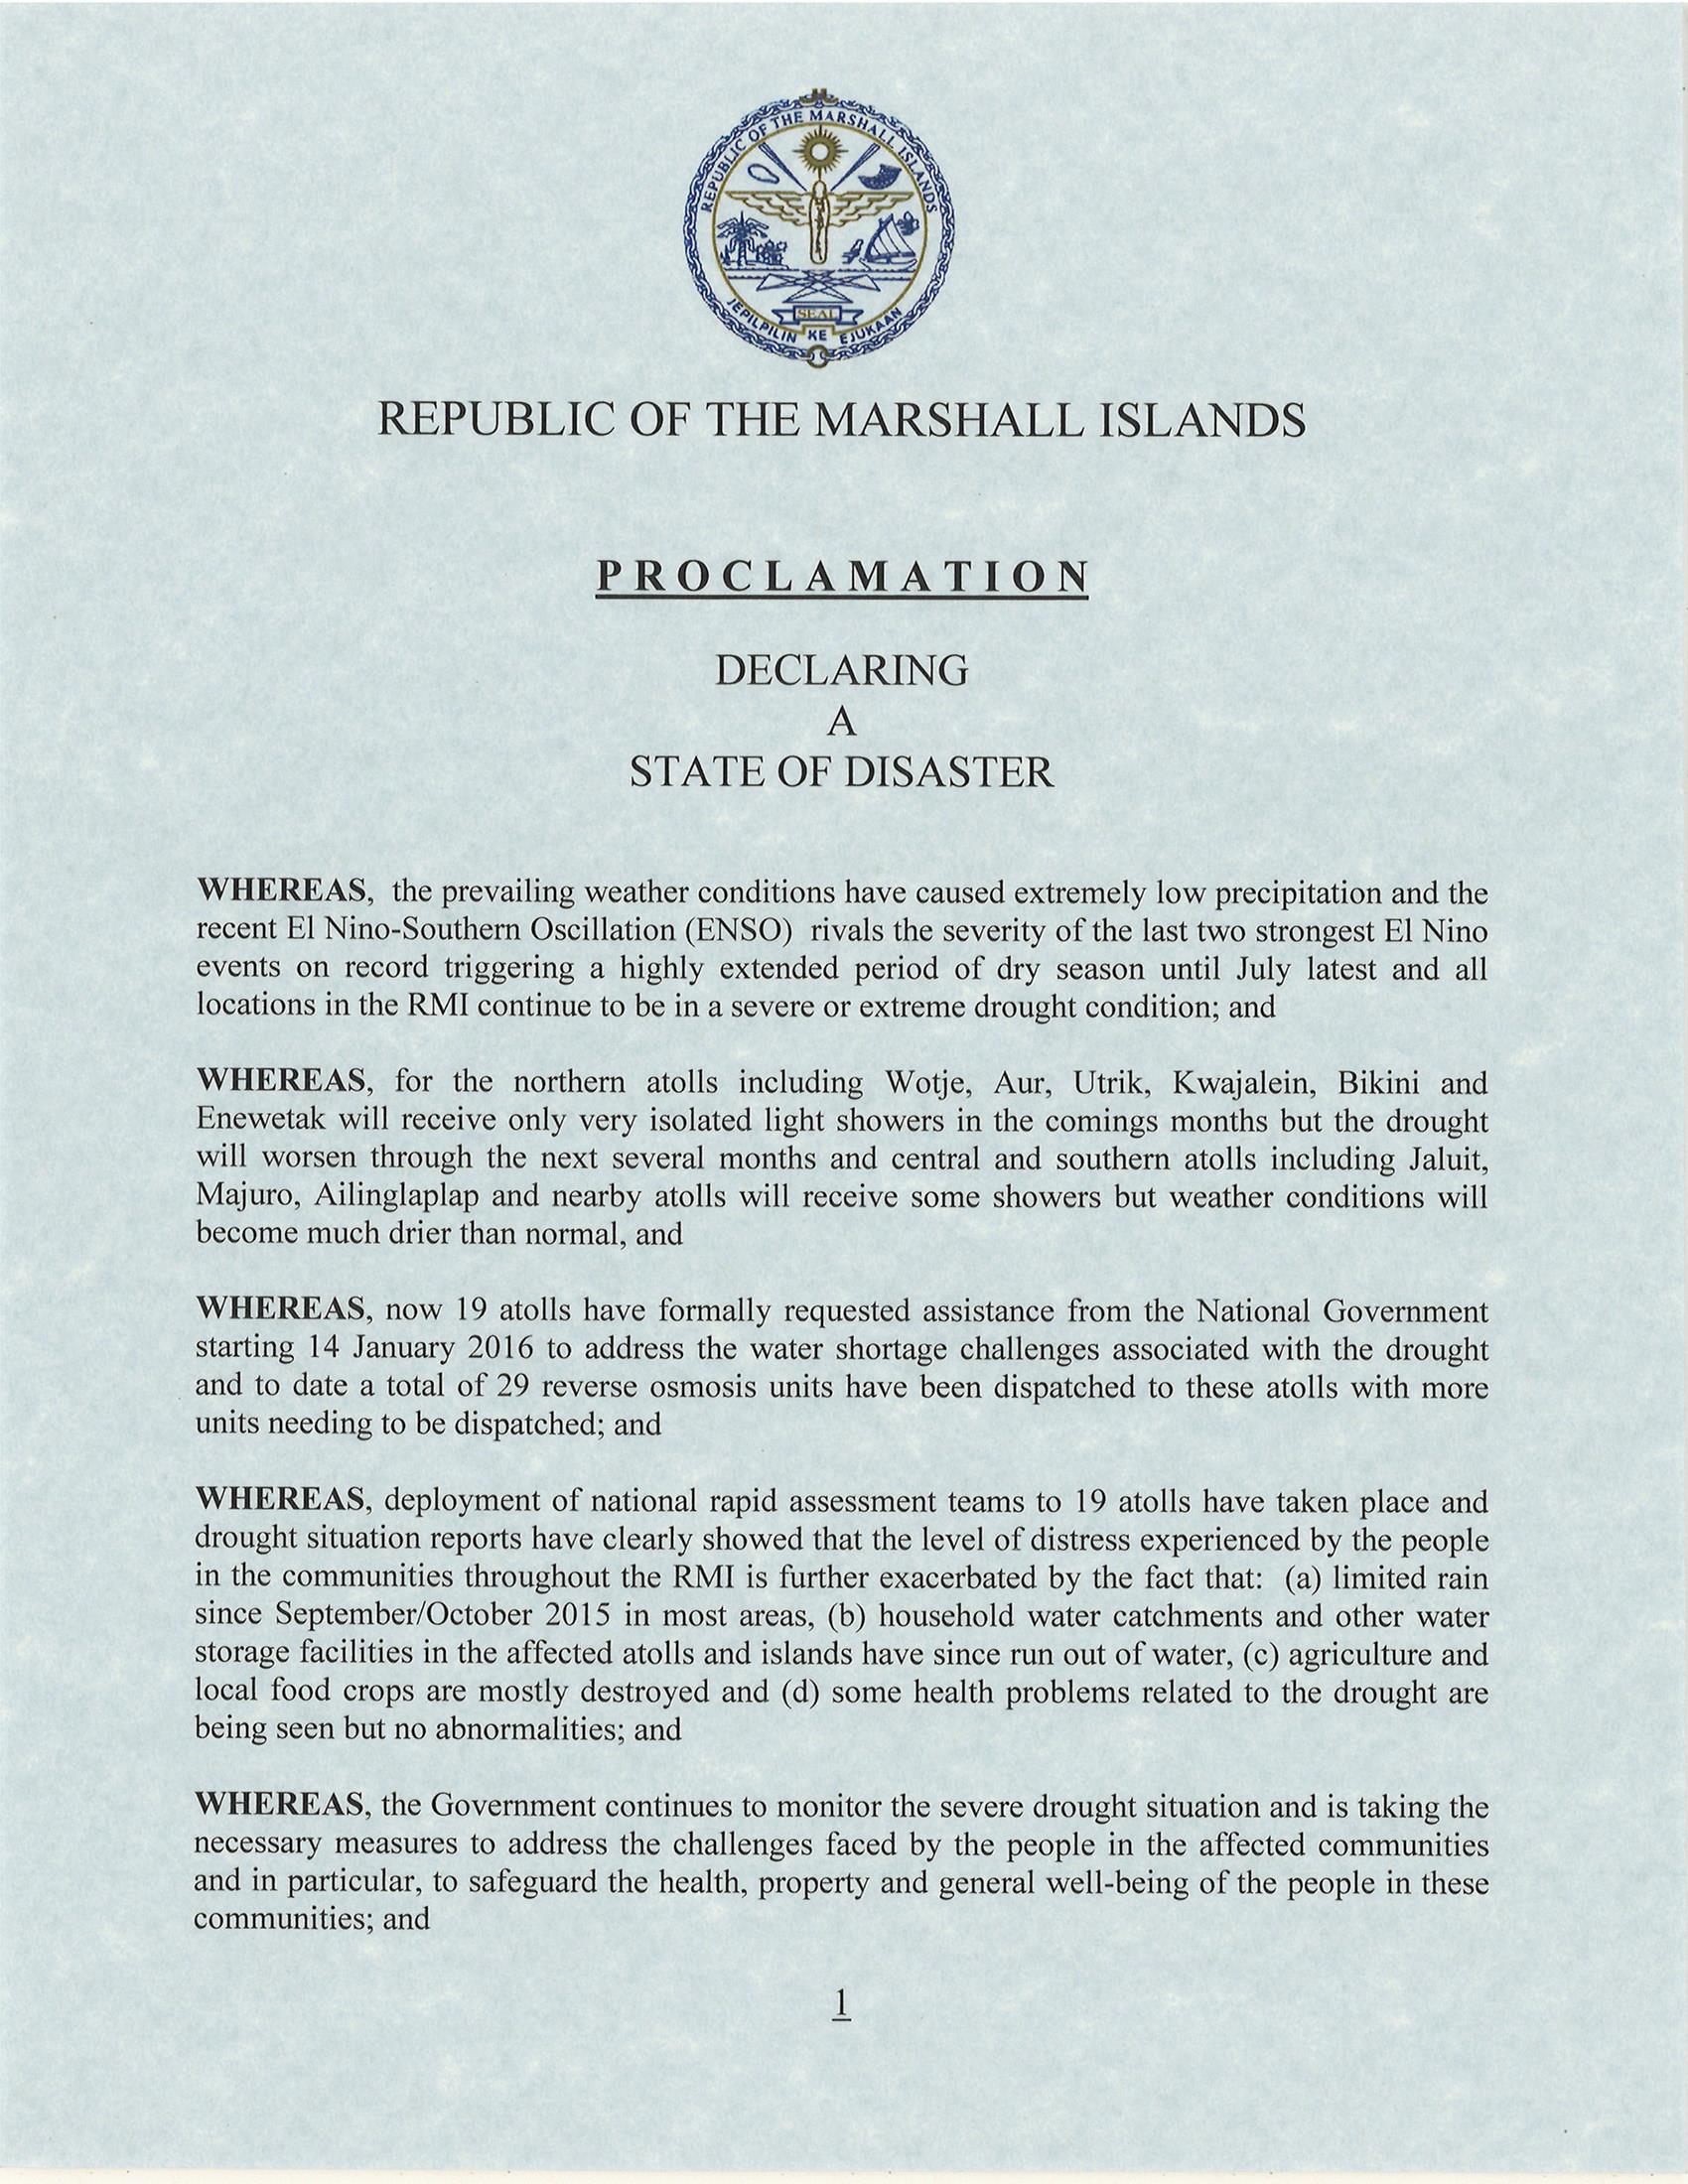
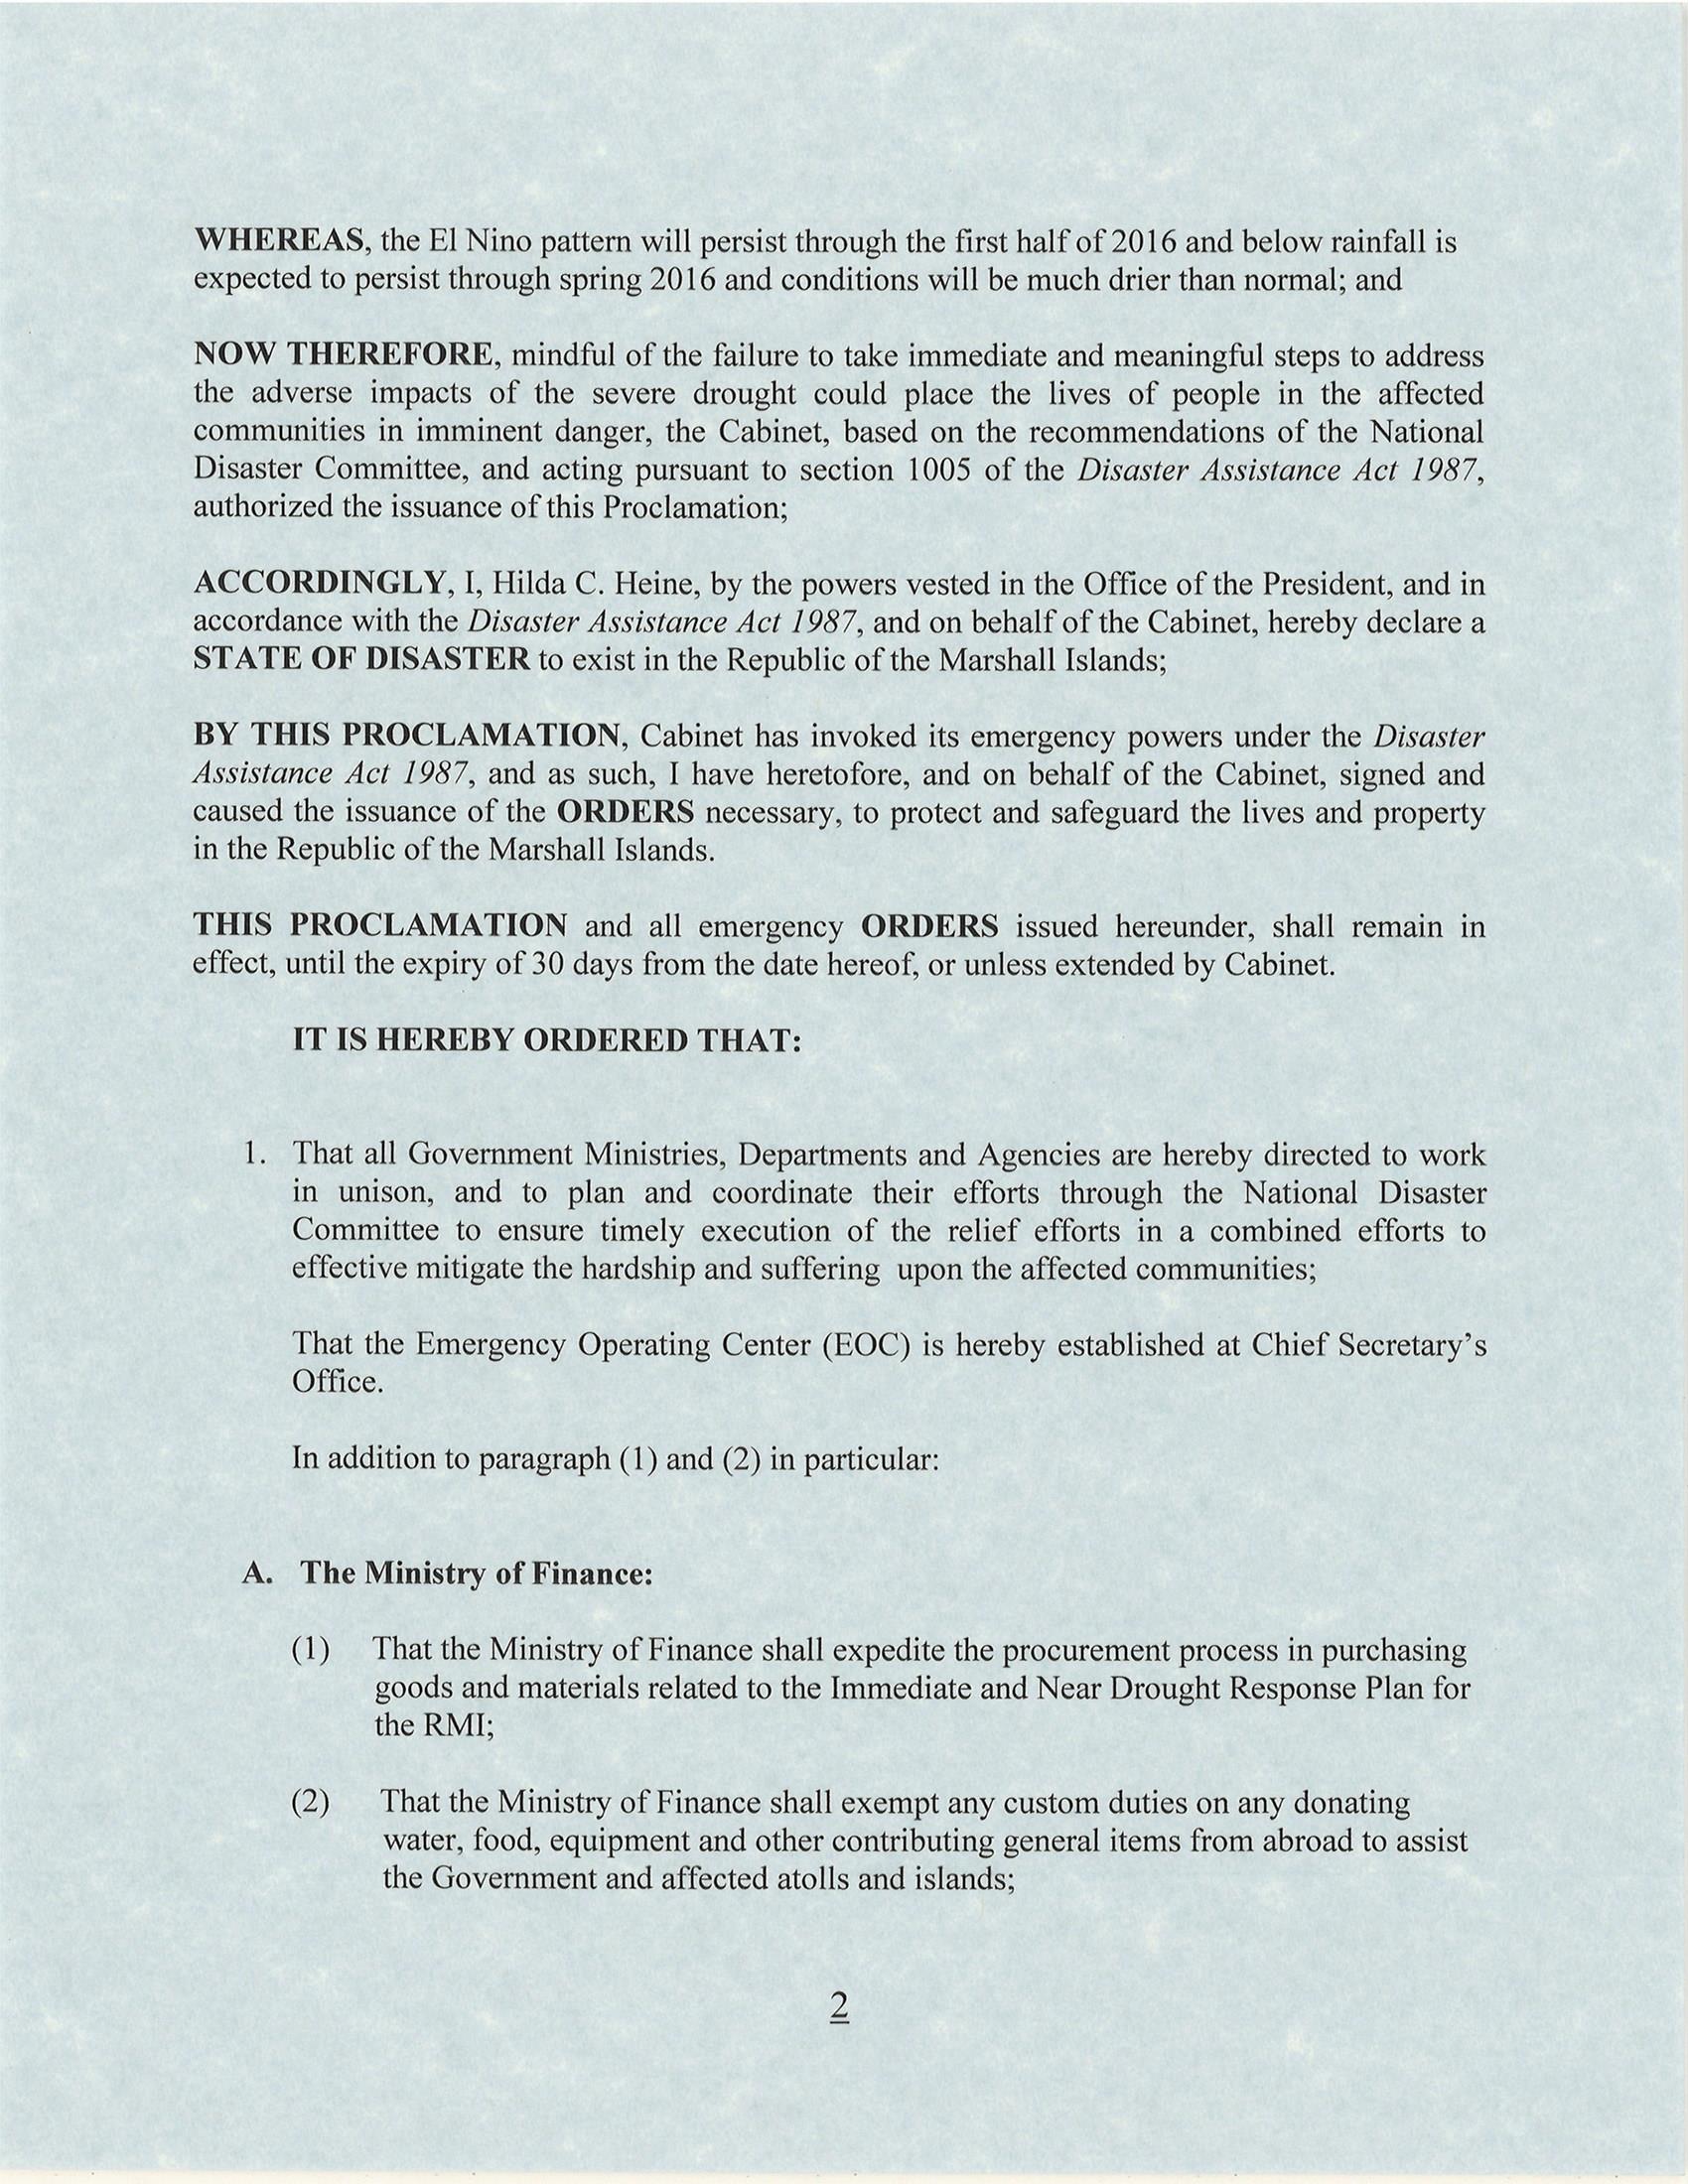
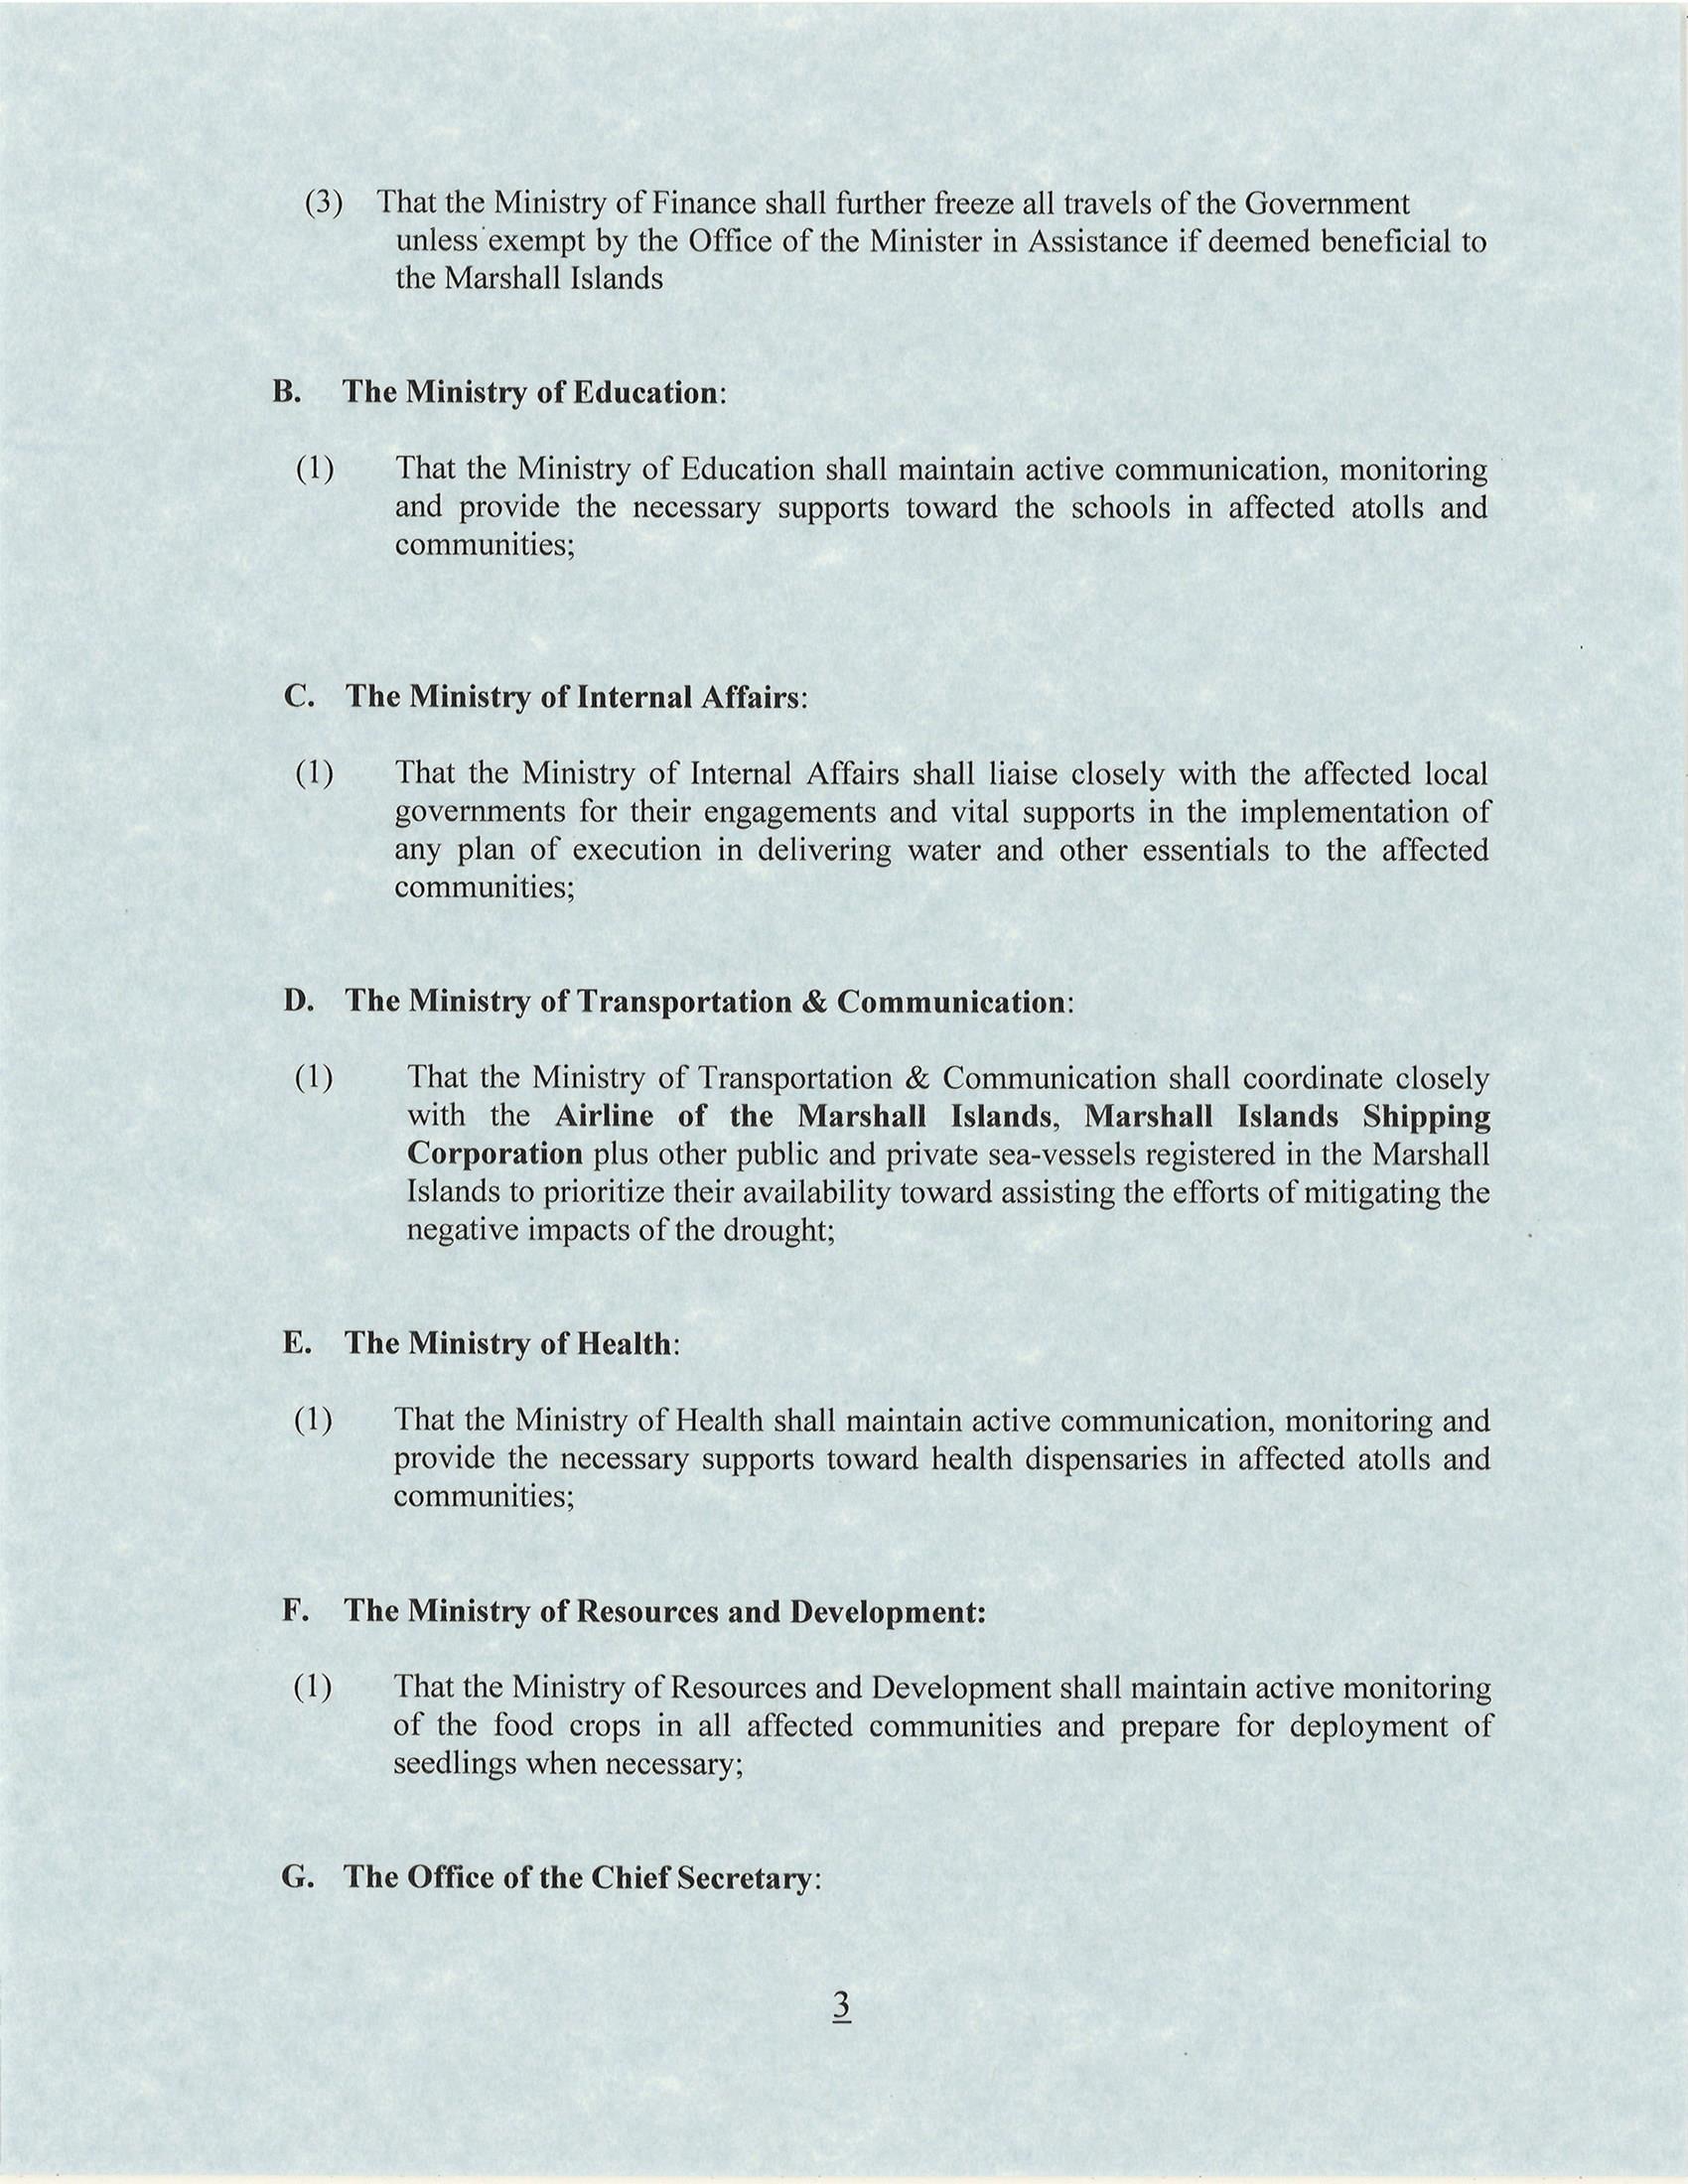
A State of Emergency has been declared by the government of the Republic of Palau and by the government of the Federated States of Micronesia (FSM) due to the drought. A State of Emergency has been declared by the state governors of the FSM States of Chuuk, Kosrae, Pohnpei, and Yap. In early March, a State of Disaster was declared by the government of the Republic of the Marshall Islands (proclamation pages 1, 2, 3, 4). In early April, the NOAA National Weather Service office in Guam updated the Drought Information Statement for the Republic of Palau, the Mariana Islands, the Marshall Islands, and FSM. The Drought Information Statement noted the very dry conditions of the last six months and urged close monitoring of water supplies, implementation of water conservation measures, and concern for grass fires and impacts on crops and other vegetation.
Drought impacts have included increased occurrence of fires, cracked soil, depletion of reservoirs and other water supplies, damage to vegetation and crops, and unsafe levels of salinity of water drawn from underground wells. In the Republic of Palau, reports have been received of yellowing of vegetation on the Rock Islands, and the Ngerimel Dam has run out of water with flow from the Ngerikill River reported very low. Water rationing has been implemented in Koror, and the Palau Public Utilities Corporation has implemented a new water rationing schedule. In Chuuk State, emergency transport of drinking water is occurring at several locations on Weno, Chuuk as public health is now being negatively affected by the consumption of unclean water, and drought impacts to food crops and vegetation have become more visible. Water rationing continues in Pohnpei State. In the Republic of the Marshall Islands, household water catchments and other water storage facilities in many atolls and islands have run out of water, and agriculture and local food crops are mostly destroyed.
As measured by percent of normal precipitation, Chuuk, Kapingamarangi, Koror, Kosrae, Lukonor, Majuro, and Yap have been drier than normal in the short term (March and the last 3 months [January-March 2016]) as well as the long term (last 12 months [April 2015-March 2016]). Guam, Kwajalein, and Pohnpei were drier than normal in the short term but wetter than normal in the long term. Pago Pago and Saipan were near to wetter than normal at the one-month and 12-month time scales, but drier than normal at the 3-month time scale.
| Station Name | Apr 2015 | May 2015 | Jun 2015 | Jul 2015 | Aug 2015 | Sep 2015 | Oct 2015 | Nov 2015 | Dec 2015 | Jan 2016 | Feb 2016 | Mar 2016 | Apr- Mar |
|---|---|---|---|---|---|---|---|---|---|---|---|---|---|
| Chuuk | 104% | 89% | 172% | 54% | 155% | 188% | 53% | 70% | 82% | 63% | 29% | 85% | 95% |
| Guam NAS | 263% | 291% | 86% | 215% | 146% | 108% | 125% | 81% | 74% | 65% | 120% | 79% | 112% |
| Kapingamarangi | 87% | 173% | 161% | 54% | 162% | 112% | 63% | 89% | 134% | 103% | 65% | 88% | 95% |
| Koror | 74% | 33% | 107% | 27% | 73% | 143% | 53% | 69% | 41% | 26% | 30% | 36% | 56% |
| Kosrae | 92% | 84% | 143% | 108% | 138% | 115% | 63% | 33% | 95% | 60% | 113% | 32% | 75% |
| Kwajalein | 322% | 204% | 117% | 104% | 171% | 95% | 105% | 88% | 59% | 64% | 17% | 45% | 116% |
| Lukonor | 83% | 89% | 136% | 77% | 75% | 149% | 40% | 123% | 56% | 123% | 61% | 51% | 77% |
| Majuro | 162% | 171% | 57% | 87% | 207% | 96% | 83% | 40% | 61% | 14% | 46% | 20% | 89% |
| Pago Pago | 153% | 172% | 170% | 72% | 125% | 18% | 88% | 210% | 183% | 34% | 54% | 101% | 101% |
| Pohnpei | 119% | 219% | 108% | 138% | 199% | 124% | 78% | 67% | 71% | 102% | 49% | 44% | 112% |
| Saipan | 203% | 341% | 115% | 112% | 141% | 92% | 198% | 64% | 154% | 54% | 105% | 106% | 131% |
| Yap | 139% | 235% | 92% | 82% | 148% | 68% | 43% | 37% | 58% | 35% | 34% | 15% | 82% |
| Station Name | Apr 2015 | May 2015 | Jun 2015 | Jul 2015 | Aug 2015 | Sep 2015 | Oct 2015 | Nov 2015 | Dec 2015 | Jan 2016 | Feb 2016 | Mar 2016 | Apr- Mar |
|---|---|---|---|---|---|---|---|---|---|---|---|---|---|
| Chuuk | 13.03" | 10.08" | 20.03" | 6.45" | 19.91" | 22.07" | 6.09" | 7.46" | 9.25" | 6.40" | 2.09" | 7.08" | 129.94" |
| Guam NAS | 6.65" | 9.91" | 5.32" | 21.80" | 21.54" | 13.71" | 14.26" | 5.96" | 3.77" | 2.62" | 3.63" | 1.63" | 110.8" |
| Kapingamarangi | 11.82" | 20.84" | 22.14" | 7.71" | 13.14" | 11.08" | 5.13" | 8.28" | 13.20" | 9.40" | 6.04" | 10.02" | 138.8" |
| Koror | 5.42" | 3.96" | 18.66" | 4.98" | 9.90" | 16.88" | 6.24" | 7.86" | 4.59" | 2.64" | 2.53" | 2.68" | 86.34" |
| Kosrae | 16.12" | 14.89" | 20.90" | 16.17" | 19.69" | 16.36" | 6.90" | 4.55" | 15.37" | 9.95" | 14.56" | 5.15" | 160.61" |
| Kwajalein | 16.94" | 13.69" | 8.12" | 10.28" | 16.63" | 10.24" | 11.71" | 9.98" | 3.90" | 2.02" | 0.46" | 1.05" | 105.02" |
| Lukonor | 9.36" | 10.36" | 15.83" | 12.22" | 10.55" | 15.15" | 4.53" | 11.18" | 6.35" | 10.37" | 5.44" | 4.75" | 116.09" |
| Majuro | 15.23" | 17.27" | 6.31" | 9.72" | 24.24" | 10.72" | 10.52" | 5.33" | 6.93" | 1.11" | 3.17" | 1.33" | 111.88" |
| Pago Pago | 14.35" | 16.59" | 9.07" | 3.99" | 6.75" | 1.20" | 8.15" | 21.33" | 23.53" | 4.49" | 6.49" | 10.76" | 126.7" |
| Pohnpei | 21.94" | 43.68" | 16.03" | 21.31" | 28.33" | 15.59" | 11.86" | 9.95" | 11.41" | 13.49" | 4.64" | 5.76" | 203.99" |
| Saipan | 5.34" | 8.11" | 4.15" | 10.00" | 18.51" | 9.26" | 21.00" | 3.61" | 5.94" | 1.36" | 2.72" | 2.00" | 92" |
| Yap | 7.80" | 18.41" | 11.07" | 12.39" | 21.99" | 9.21" | 5.29" | 3.31" | 4.93" | 2.23" | 1.77" | 0.70" | 99.1" |
| Station Name | Apr 2015 | May 2015 | Jun 2015 | Jul 2015 | Aug 2015 | Sep 2015 | Oct 2015 | Nov 2015 | Dec 2015 | Jan 2016 | Feb 2016 | Mar 2016 | Apr- Mar |
|---|---|---|---|---|---|---|---|---|---|---|---|---|---|
| Chuuk | 12.47" | 11.30" | 11.66" | 11.98" | 12.86" | 11.71" | 11.51" | 10.61" | 11.25" | 10.10" | 7.25" | 8.32" | 136.77" |
| Guam NAS | 2.53" | 3.40" | 6.18" | 10.14" | 14.74" | 12.66" | 11.44" | 7.38" | 5.11" | 4.01" | 3.03" | 2.07" | 99.09" |
| Kapingamarangi | 13.64" | 12.08" | 13.78" | 14.15" | 8.13" | 9.93" | 8.19" | 9.27" | 9.84" | 9.15" | 9.27" | 11.43" | 145.85" |
| Koror | 7.32" | 11.83" | 17.48" | 18.53" | 13.50" | 11.77" | 11.84" | 11.39" | 11.16" | 10.18" | 8.56" | 7.44" | 152.90" |
| Kosrae | 17.51" | 17.75" | 14.64" | 14.91" | 14.22" | 14.22" | 10.94" | 13.83" | 16.11" | 16.67" | 12.93" | 16.06" | 213.87" |
| Kwajalein | 5.26" | 6.72" | 6.93" | 9.87" | 9.74" | 10.74" | 11.18" | 11.28" | 6.66" | 3.16" | 2.64" | 2.35" | 90.41" |
| Lukonor | 11.31" | 11.69" | 11.65" | 15.93" | 14.04" | 10.15" | 11.32" | 9.08" | 11.27" | 8.41" | 8.93" | 9.26" | 151.36" |
| Majuro | 9.42" | 10.11" | 11.01" | 11.17" | 11.69" | 11.17" | 12.73" | 13.44" | 11.39" | 7.74" | 6.88" | 6.58" | 125.25" |
| Pago Pago | 9.39" | 9.66" | 5.33" | 5.55" | 5.38" | 6.53" | 9.26" | 10.14" | 12.84" | 13.34" | 12.00" | 10.68" | 125.57" |
| Pohnpei | 18.41" | 19.96" | 14.81" | 15.43" | 14.26" | 12.55" | 15.27" | 14.83" | 16.08" | 13.18" | 9.55" | 13.17" | 182.36" |
| Saipan | 2.63" | 2.38" | 3.62" | 8.91" | 13.13" | 10.09" | 10.62" | 5.61" | 3.85" | 2.53" | 2.59" | 1.89" | 70.25" |
| Yap | 5.63" | 7.85" | 12.04" | 15.08" | 14.82" | 13.50" | 12.18" | 8.83" | 8.51" | 6.39" | 5.19" | 4.56" | 120.31" |

[top]
State/Regional/National Moisture Status
A detailed review of drought and moisture conditions is available for all contiguous U.S. states, the nine standard regions, and the nation (contiguous U.S.):
| northeast u. s. | east north central u. s. | central u. s. |
| southeast u. s. | west north central u. s. | south u. s. |
| southwest u. s. | northwest u. s. | west u. s. |
| Contiguous United States |
[top]
Contacts & Questions