Note: This Synoptic Discussion describes recent weather events and climate anomalies in relation to the phenomena that cause the weather. These phenomena include the jet stream, fronts and low pressure systems that bring precipitation, high pressure systems that bring dry weather, and the mechanisms which control these features — such as El Niño, La Niña, and other oceanic and atmospheric drivers (PNA, NAO, AO, and others). The report may contain more technical language than other components of the State of the Climate series.
Summary
The strong El Niño continued during March 2016 and contributed to a stronger-than-normal Aleutian Low which energized the upper-level circulation pattern over the contiguous United States (CONUS). An onshore flow and northerly storm track brought above-normal precipitation to Northern California and the northern states, contracting drought, while a slow-moving cutoff low funneled flooding precipitation into the Lower Mississippi Valley and Southern Plains. The wetter fronts and low pressure systems missed the Southwest, Central to Northern Plains, and Southeast to southern New England, resulting in below-normal precipitation and expanding areas of abnormal dryness and moderate drought. The contracted jet stream resulted in warmer than normal temperatures for most of the country and a below-average number of tornadoes. The upper-level circulation, temperature, and precipitation anomaly patterns suggest that the weather and climate of March 2016 were largely the result of atmospheric drivers originating over the Atlantic and Arctic Oceans, but also to some degree from the Pacific Ocean. See below for details.
Synoptic Discussion
 |
 |
In the Northern Hemisphere, March marks the beginning of climatological spring which is the time of year when solar heating increases with the rising sun angle, arctic air masses are not as cold, and a contracting circumpolar vortex forces the jet stream northward. Polar air masses influence the weather over the contiguous U.S. (CONUS) less, and the warm, dry subtropical high pressure belts influence the weather more.
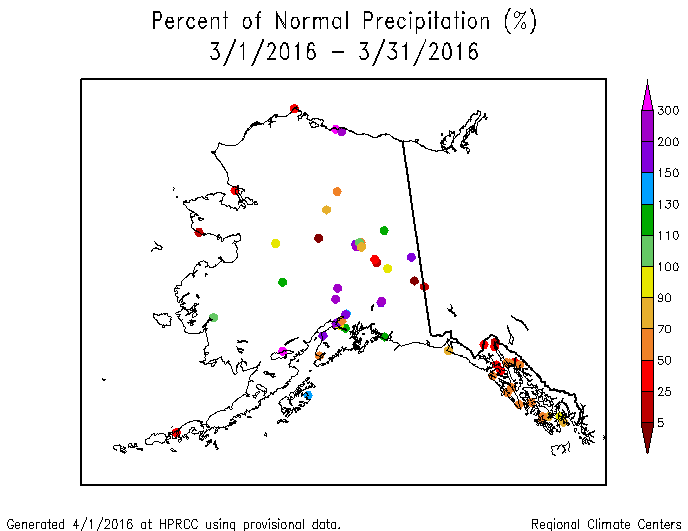
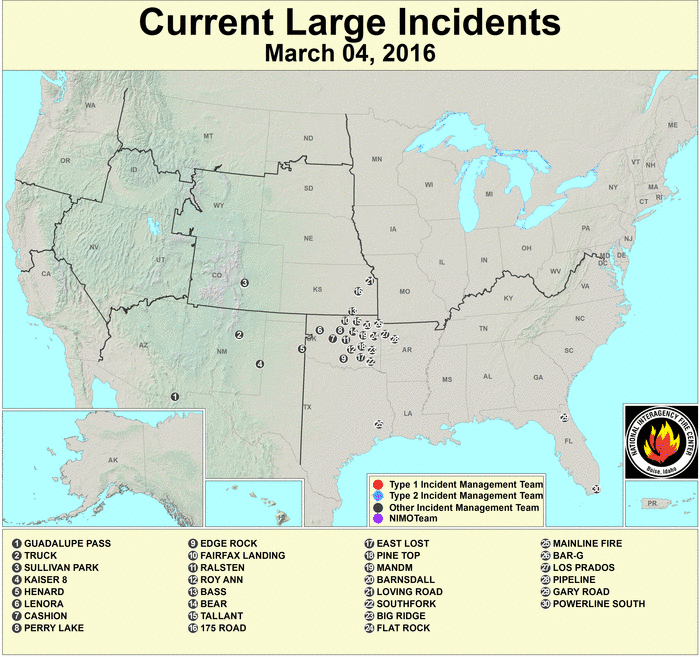
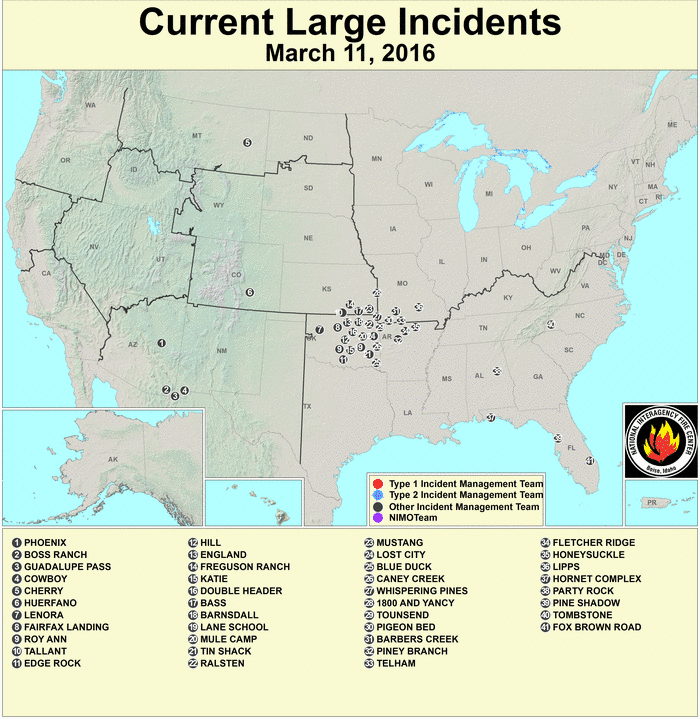
March 2016 followed this seasonal script — for the most part. A wild card was the strong El Niño which energized the atmosphere and produced a stronger-than-normal Aleutian Low. The Aleutian Low fed an atmospheric circulation that was very active with several upper-level troughs and low pressure systems which moved across the CONUS. The strong Aleutian Low also contributed to a warm southerly flow over Alaska which resulted in another warmer-than-normal month, wetter-than-normal conditions for some southern coastal locations, and drier-than-normal conditions for much of the rest of the state. At the surface, this circulation pattern pushed a stream of Pacific weather systems into western North America. Above-normal precipitation fell across Northern California to the Pacific Northwest and Northern Rockies, increasing mountain snowpackand improving drought conditions. However, the North Pacific subtropical high pressure center was also active this month and reinforced an upper-level ridge just off the coast of Southern California. This ridge deflected storms away from drought-stricken Southern California and the southwestern U.S., resulting in a much drier-than-normal month which expanded areas of abnormal dryness and moderate drought. By the time the Pacific weather systems crossed the Rockies, they had lost most of their moisture. This resulted in the drier-than-normal area extended from the Southwest into the Central and Northern Plains. Fronts that passed through the Central to Southern Plains brought wind but little rain. With warm temperatures and low humidity, this contributed to numerous large wildfires, especially over Oklahoma, which continued from last month.

Some of the low pressure systems moving in the jet stream flow skirted the edge of the North Pacific High and moved into the southern CONUS. One such system plunged deep into Mexico and formed a cutoff low. The cutoff low funneled huge amounts of Gulf of Mexico moisture into the Southern Plains and Lower Mississippi Valley. Over a period of three days (March 9, 10, 11), this circulation pattern combined with a complex surface frontal system to generate persistent heavy rains and widespread flooding.
Most of the air masses moving in the jet stream flow originated over the Pacific, but some of them were drawn down from Canada. The Canadian air masses were cold enough to cause the precipitation to fall as snow instead of rain. The month began with about 18 percent of the CONUS snow-covered. As below-freezing Canadian air was entrained behind each low pressure system, the snow cover expanded, reaching a peak of about 25 percent of the CONUS on the 4th and 24th. But temperatures are warming this time of year, and warm southerly winds between the snowstorms rapidly melted the snow cover, which reached a minimum of about 8 percent in the middle of the month. March ended with about 14 percent of the CONUS snow-covered.
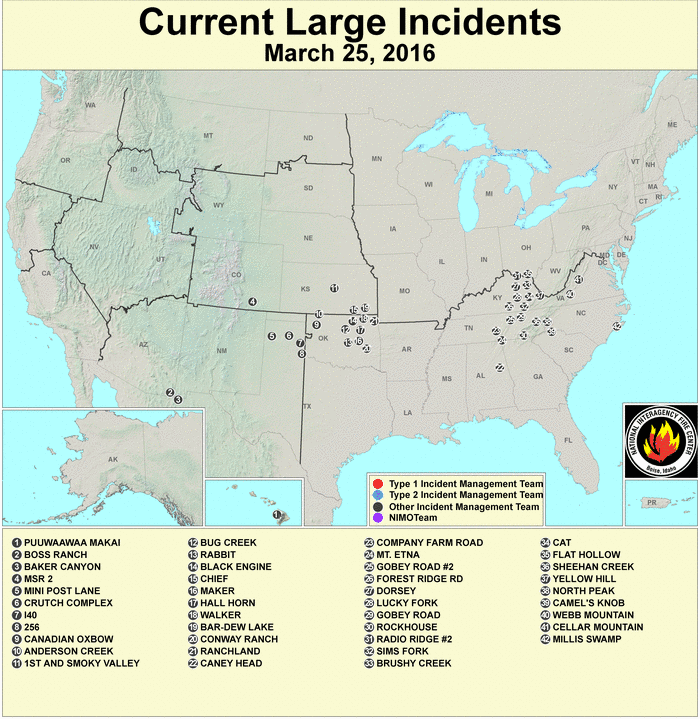
The Bermuda High (also known as the North Atlantic High) was stronger than normal this month and influenced the weather over the western North Atlantic and eastern CONUS. It weakened low pressure systems and fronts as they moved across the Southeast to southern New England, reducing their precipitation and contributing to a drier-than-normal month. By the end of the month, several large wildfires had developed in and around the Southern Appalachians. With the North Pacific High to the west and Bermuda High to the east, severe weather was funneled in between them, mainly from the Southern Plains to Ohio Valley. There were 67 tornadoes nationwide during March (according to preliminary reports), which is below the March average of 80.
The seasonally contracting jet stream, ridges migrating in the jet stream flow, and dominance of the Bermuda High combined to enable warmer-than-normal air to dominate the CONUS. By month's end, there were 5,956 record warm daily high (2,484) and low (3,472) temperature records, which is about 22 times the 266 record cold daily high (154) and low (112) temperature records, with the CONUS ranking fourth warmest nationally for March. The REDTI (Residential Energy Demand Temperature Index) for March 2016 ranked fifth lowest in the 1895-2016 record for March, illustrating how the unusually warm temperatures in the major metropolitan areas across the country reduced heating demands.
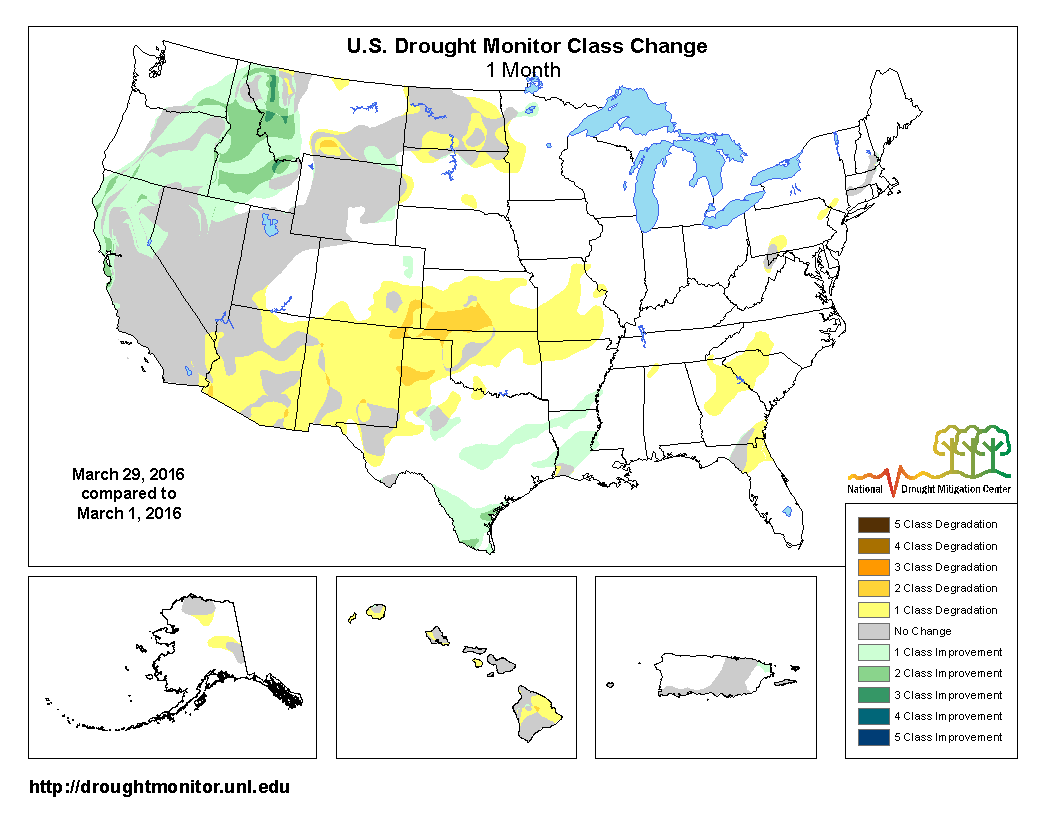
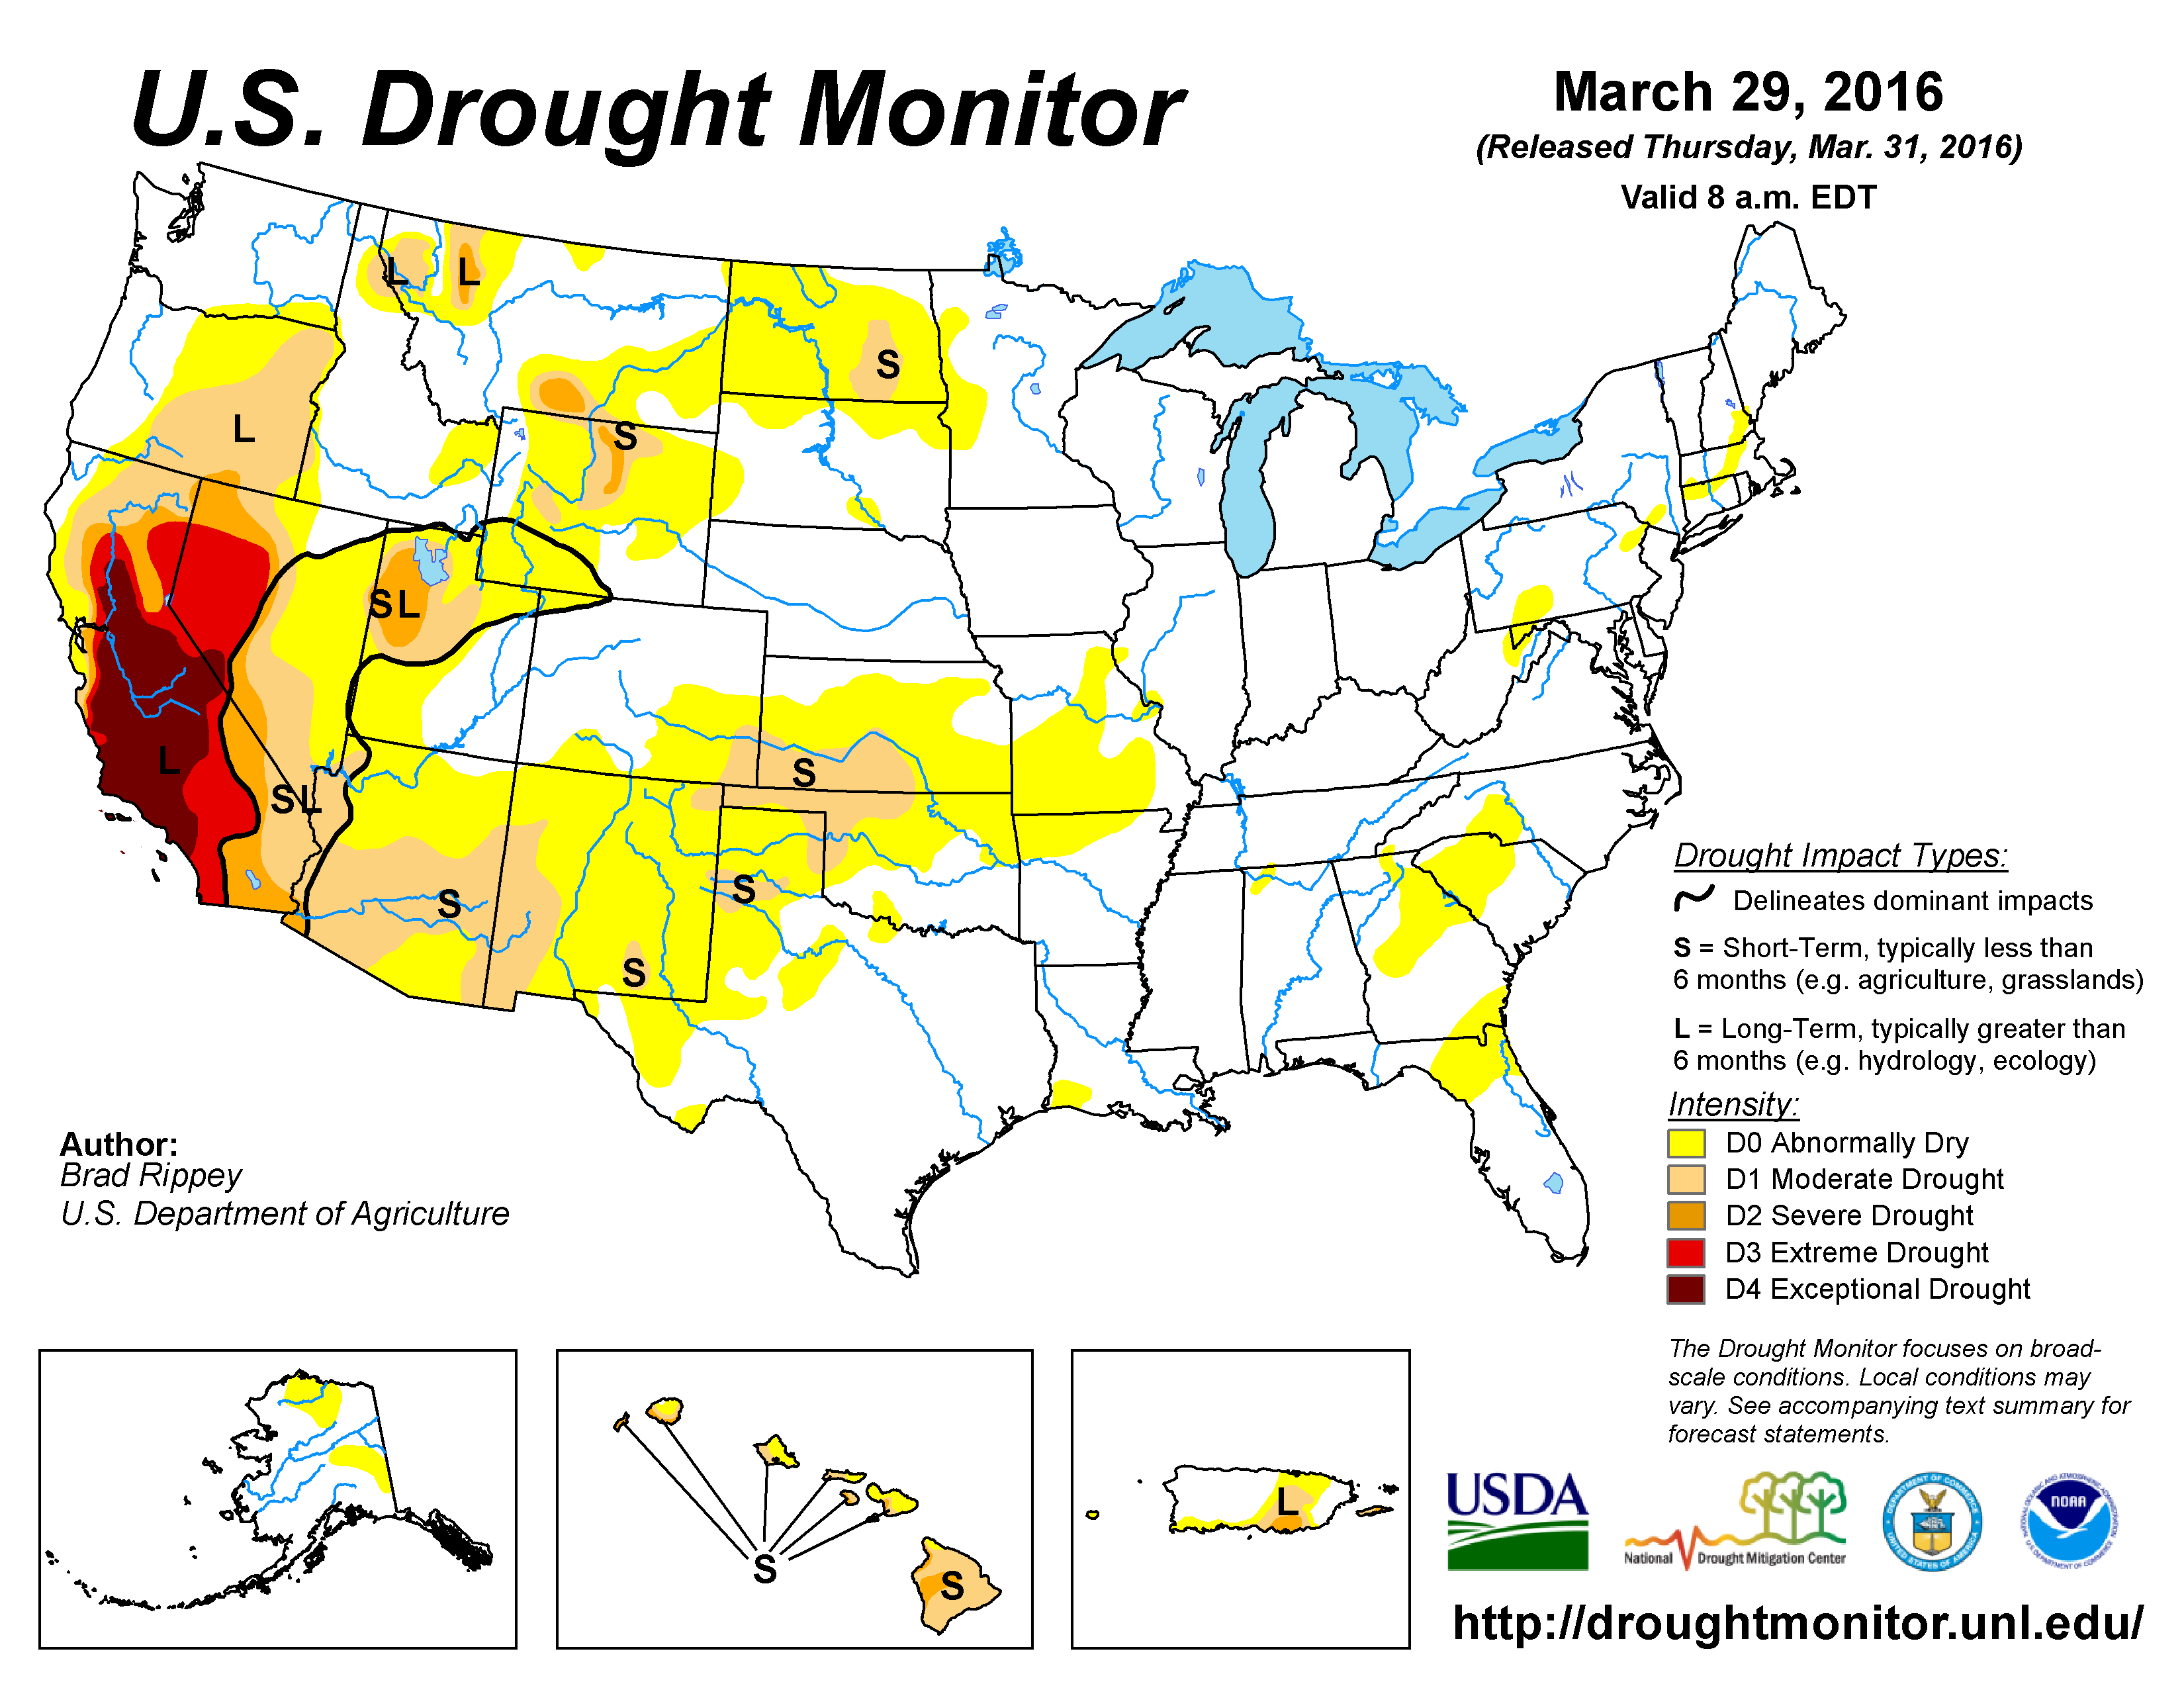
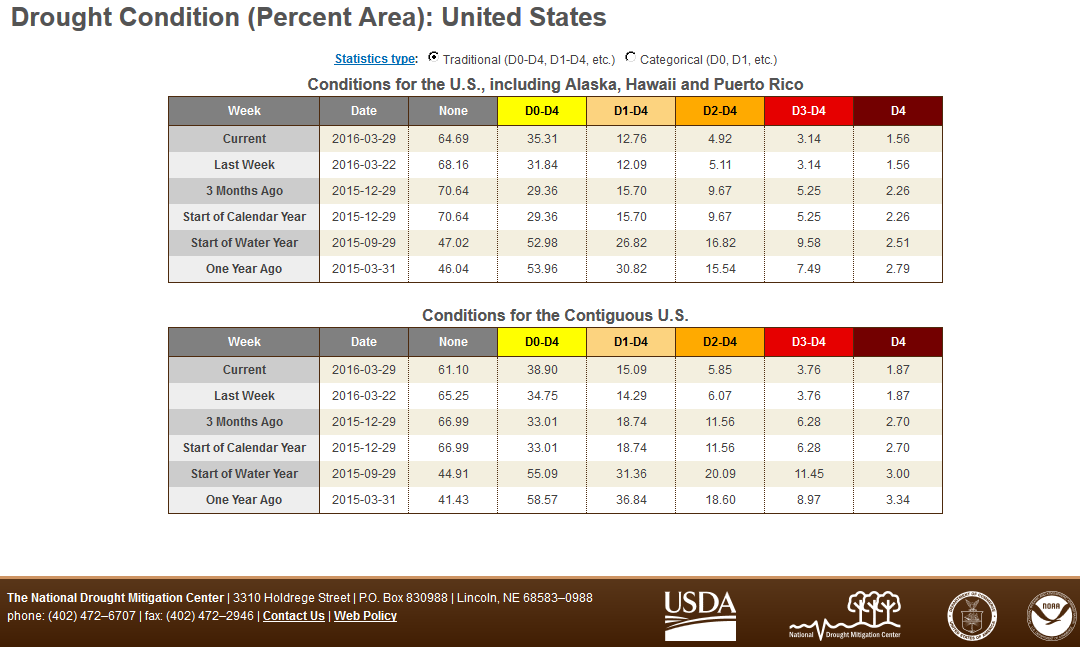
Nationally, March 2016 ranked as the 26th wettest March on record. The wet conditions in Northern California to the Northern Rockies helped contract drought in those parts of the West. But the drier-than-normal conditions from the Southwest to Northern Plains expanded drought in those areas. Overall, the national moderate-to-exceptional drought footprint grew slightly to 12.8 percent of the U.S. as a whole, and 15.1 percent of the CONUS.
The Climate Extremes Index (CEI) aggregates temperature and precipitation extremes across space and time. Several parts of the U.S. experienced March extremes which were manifested in top-ten ranks for warm maximum and minimum temperatures. Only one region (East North Central region) ranked in the top ten category for the regional CEI. With the sixth highest warm minimum temperature component, ninth highest warm maximum temperature component, eighth highest wet spell component, and 15th highest days with precipitation component, the East North Central region had the fourth highest regional CEI. When aggregated across the nation, March 2016 had the seventh most extreme national March CEI on record, with the third most extreme warm minimum and fourth most extreme warm maximum temperature components and 19th most extreme 1-day precipitation component contributing.
 North America monthly upper-level circulation pattern and anomalies. As the troughs and ridges migrated through the jet stream flow across North America, and the North Pacific and North Atlantic Highs exerted their influence, the circulation pattern favored ridging over the Southwest and eastern CONUS. A below-normal 500-mb height anomaly pattern prevailed across much of the North Pacific and extended into the northwestern CONUS. |
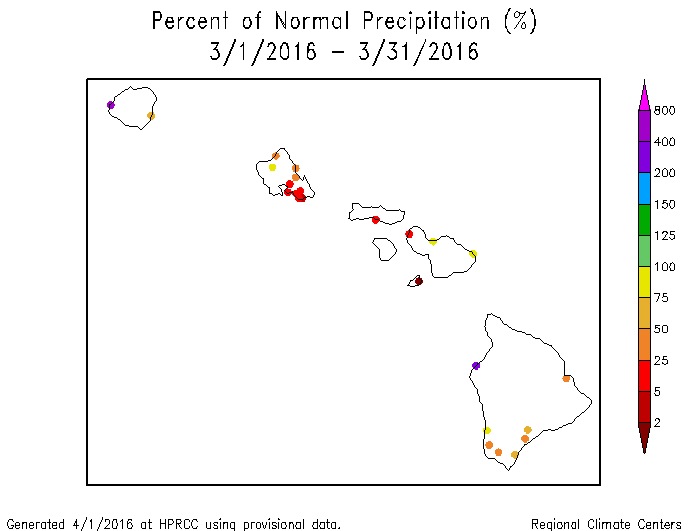
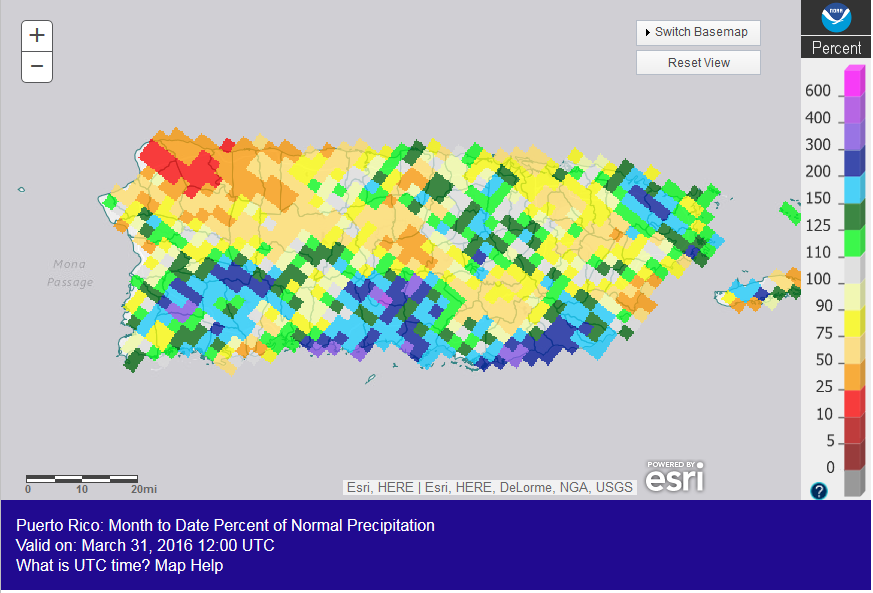
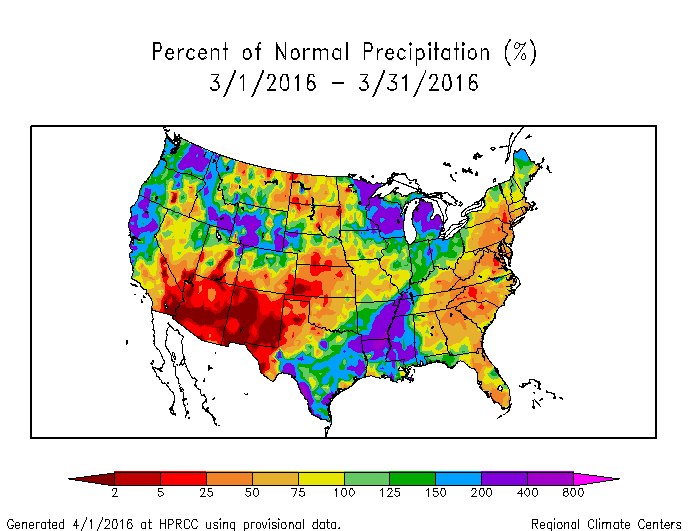 Map of monthly precipitation anomalies. March 2016 was drier than normal across the Southwest to Central and Northern Plains, Southeast to southern New England, most of Hawaii, and parts of Alaska and Puerto Rico. It was wetter than normal from Northern California to the Pacific Northwest, the Northern Rockies, Lower Mississippi Valley, Great Lakes, and parts of the Southern Plains, Alaska, and Puerto Rico. |
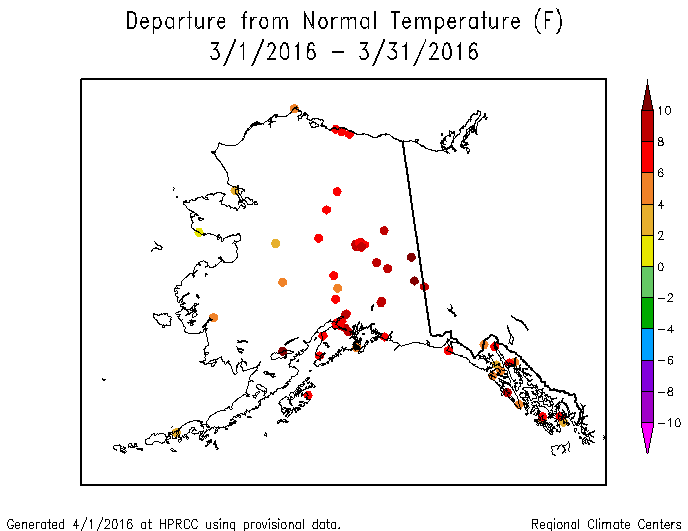
 Map of monthly temperature anomalies. March 2016 was warmer than normal across Alaska and the CONUS. |

Northern Hemisphere monthly upper-level circulation pattern and anomalies.
Atmospheric Drivers
Subtropical highs, and fronts and low pressure systems moving in the mid-latitude storm track flow, are influenced by the broadscale atmospheric circulation. The circulation of the atmosphere can be analyzed and categorized into specific patterns. The Tropics, especially the equatorial Pacific Ocean, provides abundant heat energy which largely drives the world's atmospheric and oceanic circulation. The following describes several of these modes or patterns of the atmospheric circulation, their drivers, the temperature and precipitation patterns (or teleconnections) associated with them, and their index values this month:
-
El Niño Southern Oscillation (ENSO)
- Description: Oceanic and atmospheric conditions in the tropical Pacific Ocean can influence weather across the globe. ENSO is characterized by two extreme modes: El Niño (warmer-than-normal sea surface temperature [SST] anomalies in the tropical Pacific) and La Niña (cooler-than-normal SST anomalies), with the absence of either of these modes termed "ENSO-neutral" conditions.
- Status: During March 2016, El Niño conditions were observed as above-average SSTs continued across the western and central equatorial Pacific and continued to be coupled to the tropical atmosphere. Collectively, the atmospheric and oceanic features reflected a strong but weakening El Niño.
- Teleconnections (influence on weather): To the extent teleconnections are known, the typical temperature and precipitation patterns associated with El Niño during March include above-normal precipitation along the West Coast, Gulf of Mexico Coast, and East Coast, and in the Southwest and Central Plains; below-normal precipitation in parts of the interior Northwest and Ohio Valley to Great Lakes; above-normal temperatures in the interior Northwest, western Great Lakes, and Maine, but below-normal temperatures across most of the rest of the CONUS.
- Comparison to Observed: The March 2016 precipitation anomaly pattern agrees in northern California and the western Gulf of Mexico coast, but does not match across the rest of the country where teleconnections exist with an El Niño. The temperature anomaly pattern is nearly opposite to that expected historically with an El Niño in most areas.
-
Madden-Julian Oscillation (MJO)
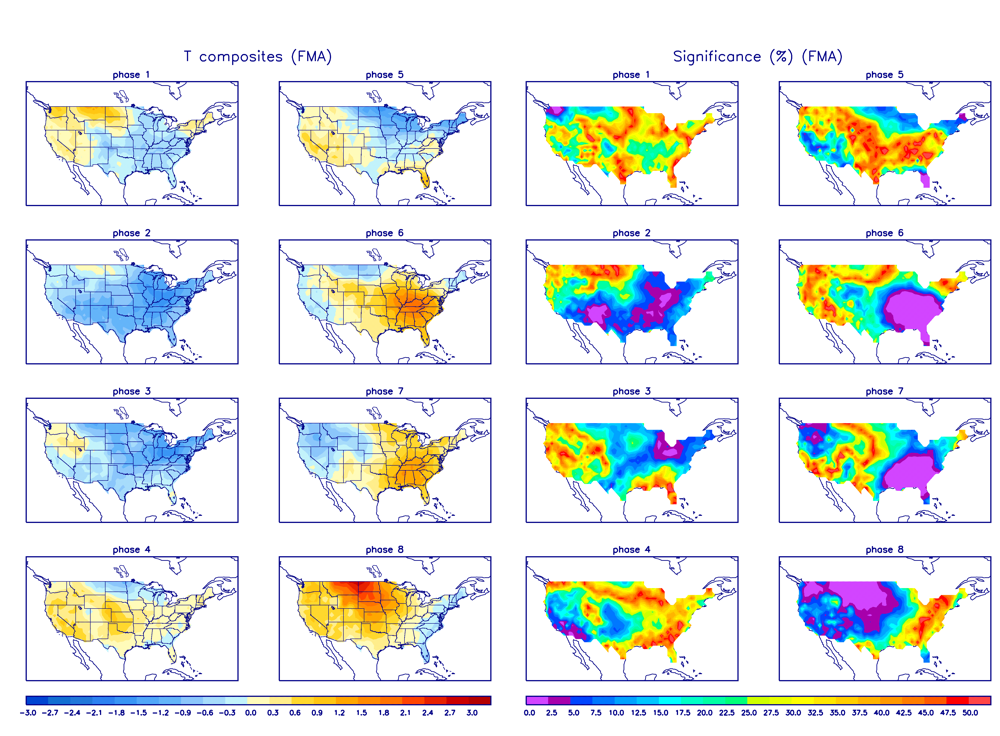
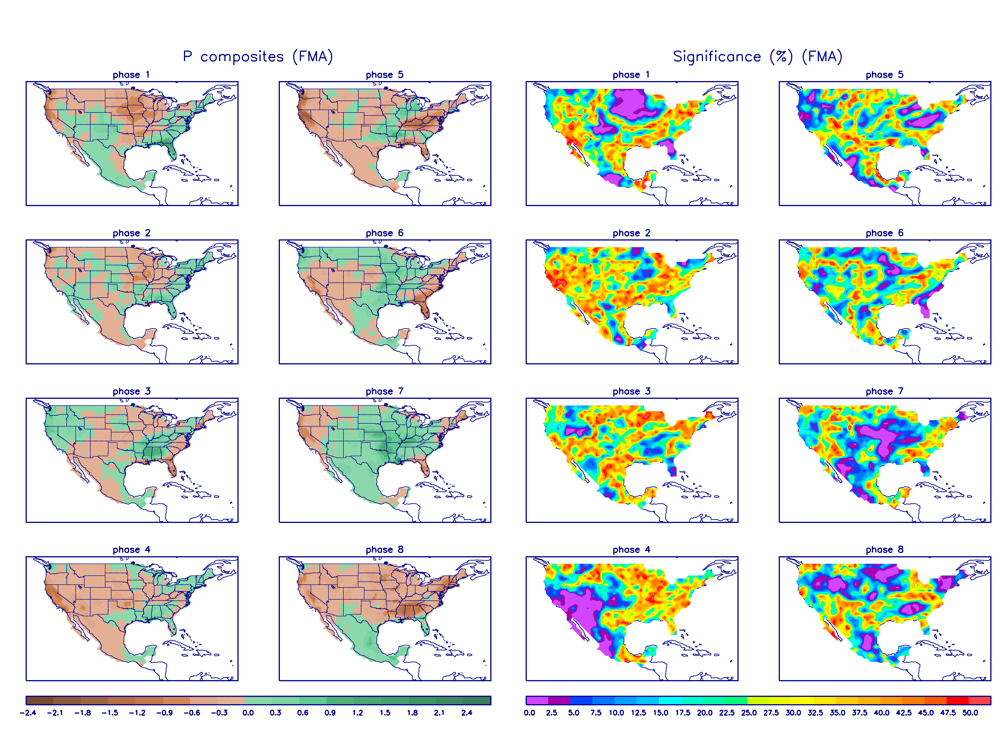
- Description: The MJO is a tropical disturbance or "wave" that propagates eastward around the global tropics with a cycle on the order of 30-60 days. It is characterized by regions of enhanced and suppressed tropical rainfall. One of its indices is a phase diagram which illustrates the phase (1-8) and amplitude of the MJO on a daily basis. The MJO is categorized into eight "phases" depending on the pattern of the location and intensity of the regions of enhanced and suppressed tropical rainfall. The MJO can enter periods of little or no activity, when it becomes neutral or incoherent and has little influence on the weather. Overall, the MJO tends to be most active during ENSO-neutral years, and is often absent during moderate-to-strong El Niño and La Niña episodes.
- Status: The MJO index started the month in phase 8, but rapidly weakened and progressed weakly through phases 1 to 6, ending the month back in phase 8. During the month, the MJO destructively interfered with the El Niño, which reduced its influence (MJO updates for March 7, 14, 21, and 28).
- Teleconnections (influence on weather): The MJO's temperature and precipitation teleconnections to U.S. weather depend on time of year and MJO phase. To the extent teleconnections are known, the February-April teleconnections for temperature are shown here and for precipitation are shown here.
- Comparison to Observed: The MJO is transitory and can change phases (modes) within a month, so it is more closely related to weekly weather patterns than monthly. In the case of March 2016, the temperature anomalies for the first week matched the teleconnections for phase 8 reasonably well, but the patterns for the remaining weeks (weeks 2, 3, 4, 5) and the monthly temperature temperature anomaly pattern did not match the corresponding MJO phases. There was some agreement in some areas between the teleconnection patterns and the weekly precipitation anomaly patterns (weeks 1, 2, 3, 4, 5) for some weeks, and the monthly precipitation anomaly pattern, but not in other areas.
- The Pacific/North American (PNA) pattern
- Description: The PNA teleconnection pattern is associated with strong fluctuations in the strength and location of the East Asian jet stream. PNA-related blocking of the jet stream flow in the Pacific can affect weather downstream over North America, especially the West and especially in the winter half of the year.
- Status: The daily PNA index was positive for the first half of the month and neutral (near zero) for the last half, averaging positive for the month as a whole. The 3-month-averaged index was also positive.
- Teleconnections (influence on weather): To the extent teleconnections are known, a positive PNA for this time of year (April on the teleconnection maps) is correlated with below-normal temperatures over the Southern Plains to East Coast; above-normal temperature anomalies along the West Coast and across western Canada and Alaska; below-normal precipitation in the western Great Lakes; above-normal precipitation in Colorado and Kansas; near-normal (low correlation) for the rest of the CONUS and Alaska; above-normal upper-level circulation anomalies over most of Canada and the northwestern CONUS; and below-normal circulation anomalies over the Southern Plains to East Coast and over the North Pacific.
- Comparison to Observed: The March 2016 temperature, precipitation, and upper-level circulation anomaly patterns show little agreement with those expected with a positive PNA.
- The Arctic Oscillation (AO) pattern
- Description: The AO teleconnection pattern relates upper-level circulation over the Arctic to circulation features over the Northern Hemisphere mid-latitudes and is most active during the cold season.
- Status: The daily AO index began the month negative and ended the month positive, averaging positive for the month. The 3-month-averaged index was slightly positive to near zero.
- Teleconnections (influence on weather): To the extent teleconnections are known, a neutral AO this time of year (February-April) is typically associated with dry conditions from northern California to most of Oregon, in the Central Plains, and from the Central Gulf of Mexico coast to the Mid-Atlantic coast; wet conditions from northeast Texas to Kentucky and in western Washington; above-normal temperatures from the Plains to the East Coast; near-normal temperatures across the West; and upper-level circulation anomalies which are above normal in the North Central Pacific and eastern CONUS and below normal over the Arctic Ocean and into northern Canada.
- Comparison to Observed: The March 2016 monthly temperature and precipitation anomaly patterns match those expected with a positive AO in the CONUS east of the Rockies, but not across much of the West. The March 2016 monthly upper-level circulation anomaly pattern agrees over the eastern CONUS, but generally not across most of the rest of the Hemisphere.
- The North Atlantic Oscillation (NAO) pattern
- Description: The NAO teleconnection pattern relates upper-level circulation over the North Atlantic Ocean to circulation features over the Northern Hemisphere mid-latitudes.
- Status: The daily NAO index was positive for most of the month, averaging positive for the month. The 3-month-averaged index was positive.
- Teleconnections (influence on weather): To the extent teleconnections are known, a positive NAO during this time of year (April on the teleconnection maps) is associated with above-normal temperature and upper-level circulation anomalies over most of the CONUS. The precipitation teleconnections are very weak, with drier-than-normal anomalies in northern California to Nevada, the Central Plains, and Southeast.
- Comparison to Observed: The March 2016 temperature anomaly pattern agrees with that expected with a positive NAO across the CONUS except in the Southeast. The upper-level circulation anomaly pattern agrees across most of the CONUS except in the Northwest. The precipitation anomaly pattern has few teleconnections, but they do match in the Central Plains and Southeast.
- The West Pacific (WP) pattern
- Description: The WP teleconnection pattern is a primary mode of low-frequency variability over the North Pacific and reflects zonal and meridional variations in the location and intensity of the (East Asian) jet stream in the western Pacific.
- Status: The monthly WP index was slightly negative to near zero while the three-month average WP index was positive.
- Teleconnections (influence on weather): To the extent teleconnections are known, a negative WP during this time of year (April on the maps) is typically associated with above-normal temperatures in the Southwest; below-normal temperatures from the Mid-Mississippi Valley to northwest Canada and northern Alaska; above-normal precipitation in Washington (although there are few other teleconnections); above-normal circulation anomalies over the Southwest; and below-normal circulation anomalies over the Northern Plains into southwest Canada.
- Comparison to Observed: The March 2016 monthly temperature anomaly pattern shows some hint of agreement with that expected with a negative WP in the Southwest, but not elsewhere. The precipitation anomaly pattern has few teleconnections. The upper-level circulation anomaly pattern agrees over North America where teleconnections exist.
- The East Pacific-North Pacific (EP-NP) pattern
- Description: The EP-NP teleconnection pattern relates SST and upper-level circulation patterns (geopotential height anomalies) over the eastern and northern Pacific to temperature, precipitation, and circulation anomalies downstream over North America. Its influence during the winter is not as strong as during the other three seasons.
- Status: The colder-than-normal SST anomaly pattern in the north central portion of the North Pacific, with the warmer-than-normal ring along its southern, eastern, and northeastern edges, continued during March 2016. The warm anomalies along the Mexican and California coast got slightly less warm, while the warm anomalies along the Canadian to southern Alaskan coast got slightly warmer. The cooler-than-normal SST anomalies in the north central North Pacific were roughly located beneath the stronger-than-normal Aleutian Low, and the warmer-than-normal SST anomalies along the North American coast roughly coincided with the upper-level ridging across the southwestern CONUS and adjacent North Pacific. The March monthly EP-NP index was slightly positive and 3-month running mean was near zero.
- Teleconnections (influence on weather): To the extent teleconnections are known, a positive EP-NP index during this time of year (April on the maps) is typically associated with cooler-than-normal temperatures across central to eastern Canada and across the CONUS east of the Rockies, and warmer-than-normal temperatures across Alaska and the extreme West Coast of the CONUS; above-normal upper-level circulation anomalies (stronger upper-level ridge) over Alaska to the western CONUS, and below-normal upper-level circulation anomalies (stronger upper-level trough) over eastern Canada and the adjacent CONUS. The precipitation teleconnections are weak but show evidence of wetter-than-normal conditions over Wyoming and the Ohio Valley.
- Comparison to Observed: The March 2016 temperature anomaly pattern agrees with that expected for a positive EP-NP over Alaska, but not most of the CONUS. The upper-level circulation anomaly pattern does not agree with that expected for a positive EP-NP. The precipitation anomaly pattern shows some agreement to the few teleconnections to compare to.
Examination of the available circulation indices and their teleconnection patterns, and comparison to observed March 2016 temperature, precipitation, and circulation anomaly patterns, suggest that the weather over the CONUS in March reflected influences from Atlantic and Arctic atmospheric drivers with some possible influence from the Pacific drivers. The El Niño was pumping energy and moisture from the tropical Pacific into the mid-latitudes, priming the atmosphere for action. This energy was reflected in an intense Aleutian Low over the north central North Pacific. This contributed to an active jet stream and numerous Pacific weather systems. These weather systems and their storm tracks gave above-normal precipitation to some parts of the CONUS that normally expect it during an El Niño and active MJO. But the March 2016 temperature anomaly pattern did not agree with those expected with an El Niño and active MJO, which indicates that these two drivers were not the primary drivers. The temperature anomaly pattern had more in common with those expected with the AO and NAO. The WP and EP-NP indices were very weak (near zero), and the PNA teleconnections showed little similarity to the observed patterns, so these Pacific drivers likely had little influence on March's weather. But the upper-level circulation anomaly pattern agreed with the WP pattern where teleconnections exist, suggesting that there was some influence. The NAO teleconnection pattern agreed most closely with the observed upper-level circulation anomaly pattern, with the AO also showing some agreement. In summary, the temperature and upper-level circulation patterns show the best agreement with the AO and NAO, while the Pacific drivers (WP, MJO, and El Niño) showed some agreement for precipitation and (for WP) upper-level circulation.
This month illustrates how the weather and climate anomaly patterns can reflect the combined influence of atmospheric drivers (or modes of atmospheric variability) from several regions — primarily the Atlantic and Arctic, but also the Pacific.