|
Contents Of This Report: |

|
National Drought Overview
|
|
[top]
Detailed Drought Discussion
Overview
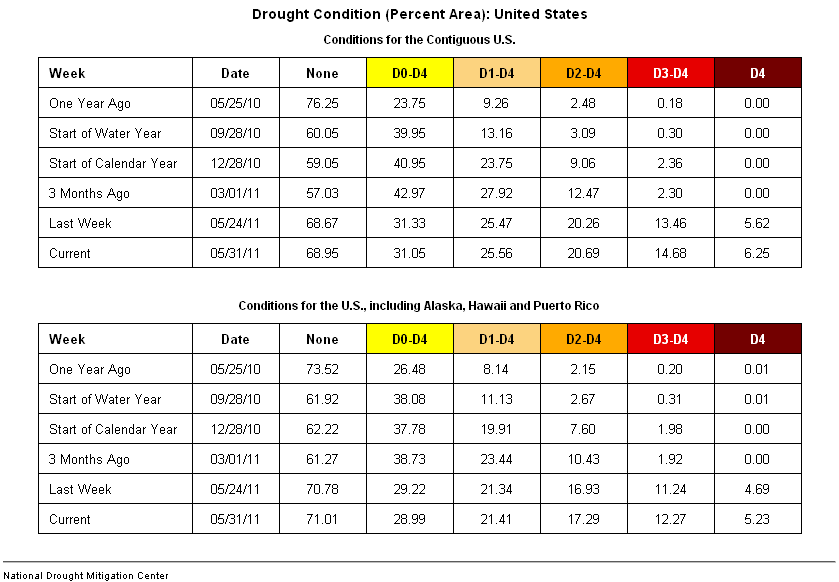
May 2011 was a wet and cool month (27th wettest and 25th coolest, based on data back to 1895) when weather conditions are averaged across the country. But this reflected regional extremes (in both monthly precipitation and temperature) which resulted from persistent weekly regional patterns of precipitation (weeks 1, 2, 3, 4) and temperature (weeks 1, 2, 3, 4) anomalies throughout the month. Drought conditions improved in Hawaii, where beneficial above-normal rains fell, but a third (33 percent) of the state remained in moderate to severe drought. Drought intensified in the Southern Plains, along the Gulf Coast, and into the Mid-Atlantic Coast, where rainfall was below normal. Another month of little to no rain over parts of the Southern Plains and Southwest resulted in continued deterioration with four-fifths (81 percent) of Texas and two-thirds (67 percent) of New Mexico falling in the extreme (D3) to exceptional (D4) USDM drought categories by May 31. The drought, accompanied by unusually hot weather in places, further dessicated soils and ravaged crops, with wildfires spreading rapidly. September 2010 was the last month that Texas had above-normal precipitation on a statewide basis. May 2011 marked the latest in a string of very dry months for the Lone Star State, with March-May 2011, December 2010-May 2011, and October 2010-May 2011 being the driest such periods in the 1895-2011 record. About 26 percent of the contiguous U.S. was experiencing moderate to exceptional (D1-D4) drought at the end of May, roughly the same as the end of April. But nearly 15 percent was in the extreme to exceptional (D3-D4) category, reflecting a steady rise in drought extent for these categories over the last 15 consecutive weeks.
The U.S. Drought Monitor drought map valid May 31, 2011.
By the end of the month, the core drought areas in the U.S. included:
- a large area of moderate (D1) to exceptional (D4) drought across the Southwest and Southern Plains, extending into the Central Plains;
- areas of moderate to extreme (D3) drought stretching along the Gulf Coast and further into the Southeast with areas of moderate to severe (D2) drought along the Mid-Atlantic Coast; and
- parts of Hawaii, where moderate to severe drought persisted.
Synoptic Discussion
The  weather pattern over the contiguous United States during May 2011 was a continuation of the westerly flow which dominated April, but strong troughs, ridges, and cutoff lows frequently dug into the flow this month. This was a recipe for heavy rain, violent weather, and large temperature swings across parts of the country. The main storm track kept to the northern states, bringing record and near-record precipitation to parts of the northern Rockies and northern High Plains, and helping to keep temperatures below normal across much of the West and northern Plains. The weather was drier than normal north and south of the storm track, with dryness extending across the southern tier states into Mexico as well as across much of the Canadian Prairies. Large cold fronts, with cooler-than-normal Canadian air behind them, swept across the U.S. at times, especially during the middle part of the month. By the end of the month, the Bermuda High strengthened over the southern to eastern third of the country, bringing a reinforcing shot of hot and dry weather.
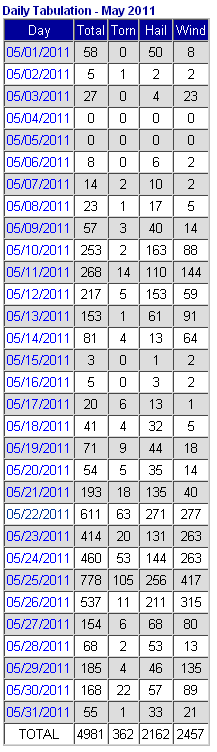
Most of the severe weather occurred from the Plains to Midwest and Northeast during the last half of the month in association with a couple very strong  upper-level low pressure systems which tracked across the area. Initial estimates by the National Weather Service (NWS) put the tornado count for May 2011 at 362 tornadoes, with 159 deaths — the majority of which occurred from a twister that struck Joplin, Missouri. There were over 2100 reports of hail damage and over 2400 reports of wind damage.
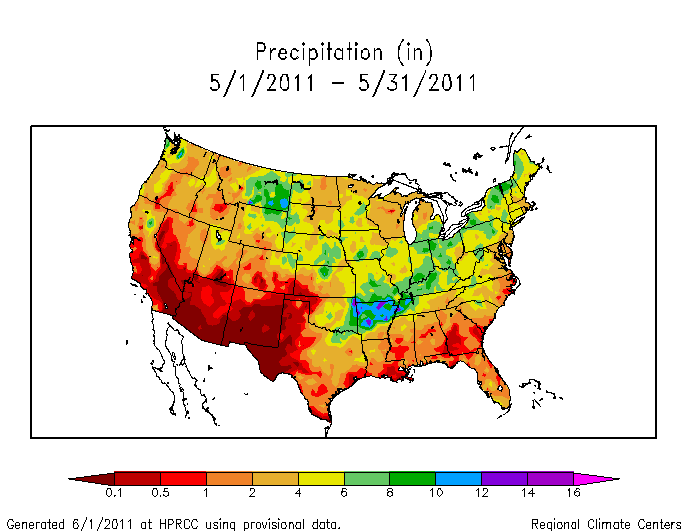
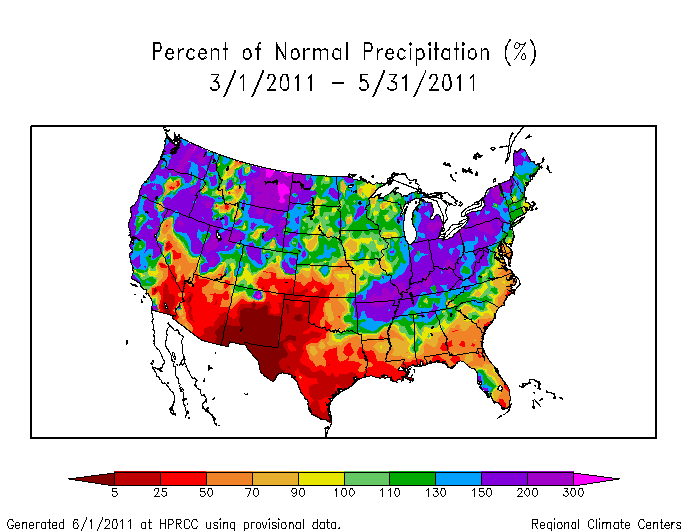
Record precipitation occurred across parts of Montana and Arkansas where over ten inches of rain was measured. Many states in the West and Northeast ranked in the top ten wettest for May, while the southern tier states from Texas to Florida ranked in the top ten driest category. Nationally, about 26 percent of the contiguous U.S. was in moderate to exceptional drought, with the drought epicenter firmly entrenched across the Southern Plains. Texas continued to dehydrate and bake. Statewide, the Lone Star State had the driest spring (March-May), 6-month period (December-May), and 8-month period (October-May) in the 1895-2011 record. Significant wildfires accompanied the dryness in the Southern Plains and Southwest, as well as in Florida and some in Alaska. The persistence of the wet/north and dry/south weather pattern over the past several months is reflected in the soil moisture pattern at the end of the month.
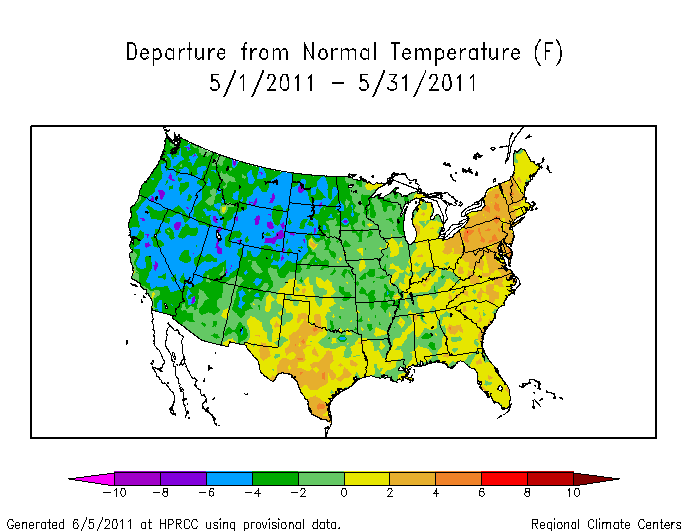
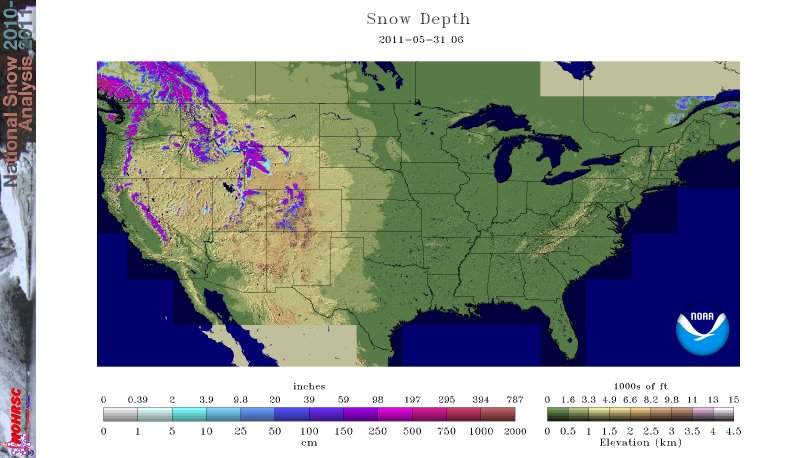
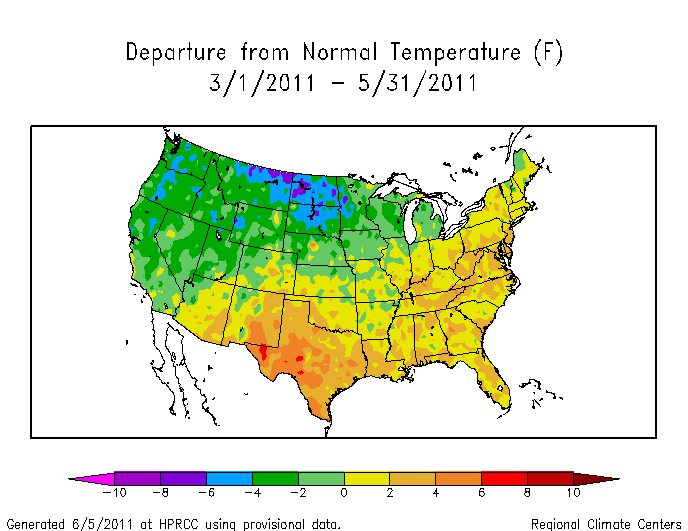
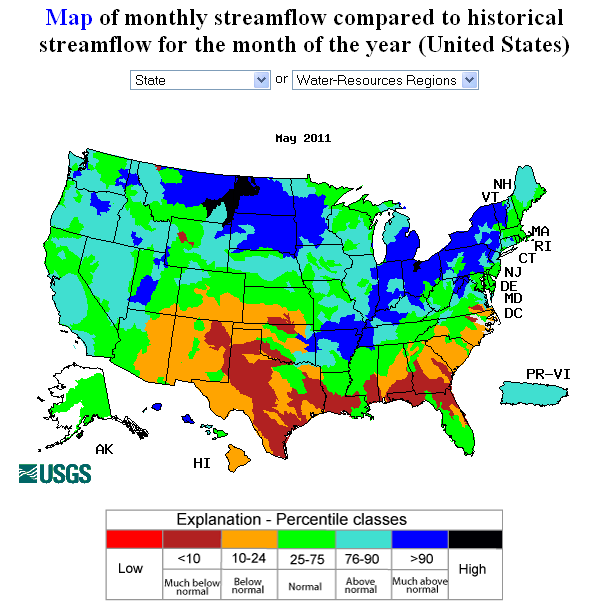
The persistence of upper-level lows over the West resulted in a below-normal monthly average upper-air circulation pattern (500-millibar geopotential heights). This type of monthly average pattern in the upper atmosphere is associated with wetter and colder than normal weather. Four western states (Oregon, Utah, Washington, and Wyoming) ranked in the top ten coldest category for May, while one state (Delaware) ranked in the top ten warmest category. Nationally, May 2011 ranked as the 25th coolest and 27th wettest May in the 1895-2011 record. The cooler-than-normal May temperatures helped slow melting of the above-normal snowpack over the western mountains. The melting of the snowpack that did occur combined with above-normal May precipitation to produce above-normal streamflow, increasing the threat of flooding. Although May is late in the snow season, a ninth (about 11 percent) of the country was snow covered at the beginning of the month. The area dropped to about 4 percent by the end of the month, with the snow cover mostly in the western mountains. May 2011 had the 17th biggest May snow cover extent in the 45-year satellite record for the contiguous U.S., which compares to the 20th smallest for North America and second smallest for Eurasia.
Cold fronts and low pressure systems moving in the storm track flow are influenced by the broadscale atmospheric circulation. Three such large-scale atmospheric circulation patterns were influential during May. The first was the La Niña, which is the phenomenon created by cooler-than-average sea surface temperatures in the eastern tropical Pacific Ocean. La Niña continued to weaken during May with a transition to ENSO-neutral conditions, but atmospheric anomalies associated with La Niña remained significant. At this time of year, La Niña is typically associated with cold temperature anomalies in the western to north central regions, warm anomalies in the southern to east central regions, and dry anomalies across much of the country. The second atmospheric circulation index was the North Atlantic Oscillation (NAO) pattern, which was near neutral at the beginning of May and became positive near the end of the month. A positive NAO this time of year is typically associated with warmer-than-normal temperatures across most of the country and drier-than-normal conditions in the Southeast and parts of the central and western U.S. The third atmospheric circulation index was the Arctic Oscillation (AO) pattern, which also was neutral for most of the month and slightly positive at the end of the month. A neutral AO this time of year is typically associated with anomalous warmth in the central Appalachians, cooler-than-normal temperatures in the Northwest, dryness in the southern to central Plains, and anomalous wetness in parts of the Southeast, Northeast, and Great Lakes.
The pattern of observed temperature anomalies for May and spring (March-May) 2011 generally matched the La Niña and AO patterns for May (spring). The May and spring precipitation pattern generally matched the mid-spring La Niña, NAO, and AO patterns in the Southern Plains and Southeast. But the above-normal precipitation pattern for May 2011 in the Midwest and Northwest is closer to the mid-winter instead of mid-spring La Niña pattern.
Palmer Drought Index
|
 |
The Palmer drought indices measure the balance between moisture demand (evapotranspiration driven by temperature) and moisture supply (precipitation). The Palmer Z Index depicts moisture conditions for the current month, while the Palmer Hydrological Drought Index (PHDI) and Palmer Drought Severity Index (PDSI) depict the current month's cumulative moisture conditions integrated over the last several months. As seen on the May 2011 Palmer Z Index map, like last month, low precipitation and hot temperatures in places resulted in short-term drought across much of the Southwest, Southern to Central Plains, and Southeast, and parts of the Mid-Atlantic this month. Wet conditions are evident on the Z Index map over a large area from the West to the Northern Plains, and parts of the Mid-Mississippi and Ohio valleys, Lower Great Lakes, and Northeast. Compared with the April 2011 PHDI map, the May 2011 PHDI map indicates that drought conditions intensified from the Southwest and Southern Plains, along the Gulf Coast, up into the Mid-Atlantic Coast, and moist conditions intensified in the Northeast, Ohio to Mid-Mississippi valleys, Great Lakes, Northern Plains, and parts of the West. The May 2011 PHDI map also reflects the long-term nature of the drought conditions. The Z Index and PHDI maps in combination show, essentially, that it rained where it was already wet and was drier than normal over the existing drought areas.
Standardized Precipitation Index
 |
 |
 |
The Standardized Precipitation Index (SPI) measures moisture supply. The SPI maps here show the spatial extent of anomalously wet and dry areas at time scales ranging from 1 month to 24 months. Dryness is evident across much of the Southwest, Southern Plains, Southeast, and Mid-Atlantic at the 1 month to 12 month time scales. Severe to exceptional dryness stands out on the maps for parts of the Southwest, Southern Plains, Gulf Coast, and Southeast at 1 month, but exceptional dryness is widespread from 2 months to 6 months, and still quite dominant even at 9 months, especially in western Texas and the Lower Mississippi Valley. The dryness in parts of Louisiana, Florida, and southern Georgia is evident even at 24 months. While in the northern areas, even down into the Mid-Mississippi Valley, unusually wet conditions are evident at all time scales. This illustrates the persistence of the dry and wet areas.
 |
 |
 |
Agricultural Indices
 |
 |
Abnormal dryness and drought were evident in several indicators. There were hardly any days with precipitation across the Southwest, Southern Plains, Gulf Coast, and further into the Southeast. This resulted in long runs of consecutive dry days in these areas. The dryness is also reflected in low total precipitation amounts and below-normal precipitation. On the other hand, it rained or snowed half or more of the days of the month in parts of the Pacific Northwest, Northern Rockies, Northern High Plains, and Lower Great Lakes.
Soil moisture, both observed (USDA percent of top soil dry to very dry, and comparison to 5-year average and 10-year average) and as monitored by several models —
- NOAA Climate Prediction Center (CPC) anomalies and percentiles
- Leaky Bucket
- NLDAS (North American Land Data Assimilation System) top soil layer and total soil layer
- VIC (University of Washington Variable Infiltration Capacity macroscale hydrologic model) percentiles
- Palmer Crop Moisture Index (CMI)
— continued very dry over the same areas with below-normal precipitation: Southwest to Southern Great Plains to Southeast to the Mid-Atlantic Coast. Dry soils were also indicated in parts of Alaska, with a hint of dryness in Hawaii, and a large area of dry soils indicated for Mexico connected to the Southern Plains dryness. The dryness is both in the surface soil layer and deeper soil layer. June 5 U.S. Department of Agriculture (USDA) reports rated more than 80 percent of the topsoil short to very short of moisture (dry to very dry) in New Mexico, Texas, Louisiana, Georgia, and Florida. The dryness and heat during May caused the CMI to rapidly deteriorate (weeks 1, 2, 3, 4), with the week from May 29 to June 5 so severe that the extent of topsoil short or very short of moisture jumped 20 to 30 percent in some of the Southeast and Mid-Atlantic states. The topsoil is as dry as it has ever been, this time of year, in the last 17 years for Louisiana and Texas, which were rated at 96 percent and 89 percent, respectively, short or very short.
 |
 |
Satellite monitoring of vegetation health (Vegetation Drought Response Index [VegDRI], Vegetation Health Index [VHI]) indicated stress on vegetation continued across the entire drought area from the Southwest to the Mid-Atlantic. The USGS agro-hydrologic model (Soil Water Index, Water Requirement Satisfaction Index) indicated stress on vegetation all along the southern tier drought states, with crop failure imminent or in a state of collapse from Arizona to Texas, and in southern Florida. According to June 5 USDA reports, more than half of the pasture and range land was rated in poor or very poor condition in Florida, Georgia, Mississippi, Louisiana, Texas, New Mexico, and Arizona. The values in Louisiana (58 percent) and Texas (74 percent) were the biggest, for this time of year, in the 17-year record. The two weeks from May 22 to June 5 saw a 20 percent or more deterioration in pasture and range land conditions in Georgia and Mississippi. Early June USDA reports also rated, in poor to very poor condition, more than half of the winter wheat crop in Texas, New Mexico, Oklahoma, and Kansas; a third of the corn crop in Texas and Georgia; a fourth of the cotton crop in Texas, Louisiana, Alabama, and Georgia; and a fourth of the peanut crop in Alabama and Georgia.
Hydrological Indices
Well monitoring stations (real-time network, climate response network, total active network) in the drought-stressed areas continued to show low groundwater levels, with many well levels in the east and south lower than a month ago. Streamflow — USGS observed and modeled:
- CPC anomalies and percentiles
- VIC 1-, 2-, 3-, and 6-month runoff percentiles
- NLDAS streamflow anomalies and percentiles
- NLDAS runoff anomalies and percentiles
— was below average for the month across much of the Southwest, Southern Plains, and Southeast, and parts of Hawaii and the Mid-Atlantic Coast. Although basin-wide (HUC) average streamflow did not reach record-low levels, many individual stream gauges along the Gulf Coast did have record low May values. Cumulative precipitation over some of the river basins in the Southern Plains/Southern Rockies was record low. The Rio Grande River Basin had the driest October-May, November-May, December-May, January-May, February-May, and March-May in the 1895-2011 record, and the Texas Gulf Coast Basin had the driest October-May, February-May, and March-May.
 |
 |
Regional Discussion
May was drier than normal for most of the Alaskan stations, which resulted in the second driest May statewide in the 1918-2011 record. Below-normal precipitation was widespread for the last 2 to 3 months, which contributed to the driest spring (March-May) statewide. Dryness in the southern and central portions of the state is reflected in precipitation deficits at longer time scales (6, 12, 24, 36 months) and in the end-of-May mountain snowpack and SNOTEL station network snow water equivalent. The May 31st USDM map still had a sixth of the state in the abnormally dry category.
May was generally wetter than normal over Puerto Rico. There were a few areas with below-normal rainfall at longer time scales (2, 3, and 6 months, year to date, and water year to date [October-May]), but the May 31st USDM map had no drought or abnormally dry areas on the island.
![water year to date [October-May]](/img/climate/research/2011/may/nws-pcp-pct-0531-pr-wytd.jpg)
Most stations in the Hawaiian Islands were wetter than normal during May, resulting in contraction of the drought areas. Extreme drought (D3) disappeared from the state on the USDM map by the end of May and the moderate to extreme drought area contracted from about 46 percent at the end of April to 33 percent by the end of May. But long-term rainfall deficits remained at most time scales (last 2, 3, 6, 12, 24, 36 months). The long-term deficits were reflected in below-normal streamflow on the Big Island.
 |
 |
On a statewide basis, May 2011 was drier than normal for nine states, but the hardest hit were the six southern states from Texas to Florida, each of which ranked in the top ten driest category based on the 1895-2011 record. For the Southern Plains states, especially Texas, the dryness extends back to October 2010, with several "seasons" ranking as the driest on record.

Texas statewide precipitation, March-May, 1895-2011
Texas had the driest March-May, February-May, December-May, and October-May. New Mexico had the driest January-May on record and Louisiana the driest December-May. Other states in the Southeast have been dry at long time scales (January-May, December-May, June-May). Florida had the second driest July-May and third driest June-May, while Georgia had the fourth driest July-May.

Louisiana statewide PHDI, January 1900-May 2011
The extreme dryness in the Southern Plains resulted in a rapid increase in the percent area of the region experiencing drought. Over half (51 percent) of the South region was rated in extreme to exceptional drought, which is the largest percentage in the 11-year USDM record. Similarly, Texas has had a rapid increase in the percent area of the state experiencing drought, with nearly the entire state affected by moderate to exceptional drought according to the May 31st USDM, and four-fifths (81 percent) in the extreme to exceptional drought categories. This year is the first time in the 11-year USDM record that Texas has been affected by so much extreme to exceptional drought. The extreme dryness has also caused the PHDI to rapidly increase in intensity. But the 2011 drought is a minor blip in the longer (century-scale) Texas statewide PHDI record, especially (both in terms of maximum intensity and duration) compared to the 1950s drought of record. Next door, in Louisiana, the USDM also shows a rapid increase in the percent area of the state experiencing drought, while the statewide PHDI record shows the 2011 drought to be comparable in intensity to earlier extreme droughts.
 |
 |

PHDI for West Central Lousiana, January 1900-May 2011.
On a more localized basis, record dryness has occurred at several time scales in the Southern Plains, Southwest, and Lower Mississippi Valley. The following time scales have been record dry for at least one climate division each:
As reported in the media, some people have likened this year's drought to the droughts of the 1930s and 1950s. Climatically, it was the driest May, spring (March-May), year-to-date (January-May), and December-May in the 1895-2011 record for several climate divisions in Arizona, New Mexico, Texas, and Oklahoma, as well as Louisiana and Mississippi. But the last ten months were preceded by a very wet period for Arizona, New Mexico, and Texas. This pattern of dry spells interspersed with wet spells has prevented the longer-term PHDI from reaching the drought severity and duration levels of the 1950s drought of record for divisions in Texas
- climate division 2 (Low Rolling Plains)
- climate division 5 (Trans Pecos)
- climate division 6 (Edwards Plateau)
and New Mexico
The dryness in Louisiana, however, has lasted longer, with the compounded effects of the dryness approaching the intensity of the worst droughts on record for some Louisiana climate divisions (climate division 4 [West Central]).

Percent area of the Western U.S. in moderate to extreme drought, based on the Palmer Drought Index.
The precipitation pattern over the West was mixed in May, with the south generally drier than normal and the north wetter than normal. This pattern has continued for most of the water year (October-present) — abundant precipitation has fallen across much of the West, but extremely dry conditions have been persistent from Arizona and New Mexico into eastern Colorado. This is evident in both the low elevation station precipitation as well as the high elevation (SNOTEL) station precipitation and snow water equivalent, and the mountain snow course snowpack measurements, modeled soil moisture, and PHDI. With the snow pack still many feet deep in higher elevations, some of the basins had three to eight times their normal May 31 snow water equivalent with most stations ranking in the wettest fifth percentile for the date. But it should be noted that snowpack percentages can be highly skewed at this time of year because normals are so low for this late in the season. The combination of low normals, colder-than-normal temperatures (which inhibited snow melt), and above-normal precipitation resulted in significant increases in percent of average snowpack from the end of April to the end of May as well as significant increases in soil moisture. An analysis of early data by the USDA indicated that reservoir levels were, on average, below normal in New Mexico, where drought was an issue, to near normal in Montana, where flooding was a concern. According to the USDM, 18 percent of the West was experiencing moderate to exceptional drought at the end of May, slightly less than April, while the Palmer Drought Index statistic was about 13 percent, about the same as last month. The Palmer Drought Index showed a marked increase in the unusually wet area, with over half (57 percent) of the West moderately to extremely wet.
A more detailed drought discussion, provided by the NOAA Regional Climate Centers and others, can be found below.
West — Upper Colorado River Basin — Pacific Islands
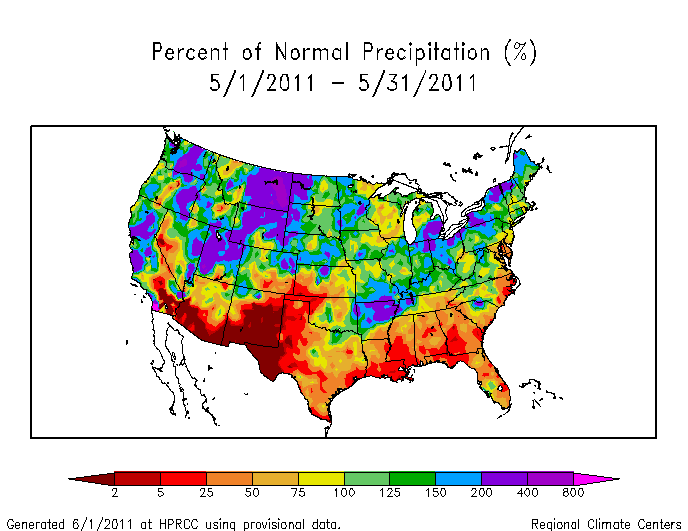
As noted by the Southeast Regional Climate Center, precipitation in May was generally below normal across the Southeast, except for small areas in Virginia, North Carolina, and southwest Florida. In some of these areas, training thunderstorms produced prodigious rainfall totals. Both Puerto Rico and the U.S. Virgin Islands received above average rainfall for the month. In contrast, monthly precipitation totals were less than 50 percent of normal across much of South Carolina, Georgia, Alabama, Florida, and eastern North Carolina. The driest locations (less than 10 percent of normal) were found across portions of the Alabama and north Florida coasts, southwestern Georgia, and eastern South Carolina. It was the second driest May in Charleston, South Carolian and the third driest May in Columbus, Georgia in records extending back to 1938 and 1948, respectively. Mobile, Alabama recorded its third driest May on record with only 0.42 inch (10.7 mm) of precipitation, a deficit of close to 6 inches (152.4 mm). On the 18th of the month, Mount Mitchell recorded its latest snowfall in a calendar year since official records began on the mountain in 1980.
Mean temperatures were generally above normal across the Southeast region in May. In contrast, mean temperatures were 1-2 degrees F (0.5-1.1 degrees C) below normal across Puerto Rico and the U.S. Virgin Islands. Across the Southeast, there were 438 daily maximum and 197 daily high minimum temperature records tied or broken during the month. More than half of these occurred during the last week of the month as a ridge of high pressure settled over the eastern U.S. In contrast, a stretch of unseasonably cool weather resulted in over 500 daily minimum and daily low maximum temperature records either tied or broken between the 5th and 18th of the month.
The lack of precipitation in May resulted in an increase in drought severity, especially across the southern tier of the region. There was an emergence of severe drought (D2) conditions across the North Carolina coast, extreme drought (D3) conditions across southern Alabama, north Florida, and southern Georgia, and exceptional drought (D4) conditions across parts of southeast Florida. Stream flow and shallow groundwater levels continued to decline across much of the region. Daily record low flows were reported in several streams across eastern sections of Georgia and North Carolina, though no water supply problems were reported. The hot, dry conditions placed stress on numerous crops across the region. The lack of moisture made it difficult to plant peanuts in Alabama and forced many farmers to replant their cotton. There were also widespread reports of heat stress to crops, as well as worm and insect problems.
As explained by the Southern Regional Climate Center, with the exception of Arkansas, western Tennessee and northeastern Oklahoma, the month of May was an extremely dry month in the Southern region. A majority of the region averaged below 50 percent of normal precipitation for the month. The driest areas for the month include western and southern Texas, southern Louisiana and Mississippi. The majority of stations in those areas averaged less than 25 percent of normal precipitation for the month. In the Trans Pecos climate division of Texas, most stations did not see any measurable precipitation for the entire month. In Arkansas, wetter than normal conditions were observed. Many stations in the state, with the exception of the extreme south, reported between 150 to 200 percent of normal values. This was also the case for the western tip of Tennessee and the northeastern corner of Oklahoma. State averaged precipitation totals for the month were as follows: Arkansas received 8.46 inches (214.89 mm), Louisiana received 1.58 (40.13 mm), Mississippi received 1.85 inches (46.99 mm), Oklahoma received 4.18 inches (106.17 mm), Tennessee received 4.87 inches (123.70 mm), and Texas received 1.57 inches (39.88 mm). Arkansas experienced its eleventh wettest May on record (1895-2011). Louisiana experienced its sixth driest May on record (1895-2011), while Mississippi experienced its eighth driest May on record (1895-2011). The only other ranking in the region that fell outside the middle quartiles was in Texas, which experienced its tenth driest May on record (1895-2011).
For the bulk of the Southern region, the month of May was a relatively average month with respect to temperature. With the exception of Arkansas and Texas, most of the region averaged within about two degrees F (1.11 degrees C) of the monthly average. In Arkansas, it was the thirtieth coldest May on record, while Texas experienced the twenty-first warmest May on record (1895-2011).
Extreme dryness throughout most of the Southern region led to little change in drought conditions for the month of May. Unfortunately, most of the precipitation that fell in the region, occurred in areas that were mostly drought-free. Such was the case for Arkansas, Tennessee, and eastern Oklahoma. Within the region, the total areal coverage of drought changed very little over the past month. In northwestern Texas, drier-than-normal conditions led to an expansion of exceptional drought. This was also the case for east-central Texas and west-central Louisiana. Dry conditions prevailed in southern Louisiana, and as a result, much of that region was now experiencing extreme drought conditions. There were some minor improvements in central Oklahoma, with a reduction in the amount of extreme drought there; however, much of the area was still experiencing abnormally dry conditions to moderate drought.
In Texas, the drought has already caused over 1 billion dollars in agricultural losses, a number that is expected to reach the 4 billion dollar mark seen in 2009 if conditions do not improve significantly during the summer of 2011. Wheat production this season has been less than 50 percent of normal production, with only irrigated crops having any success. Likewise, the outlook was bleak for cotton in most areas — with farmers not relying on irrigation delaying planting because of a lack of soil moisture. The overall 2011 cotton yield in both the High Plains and Low Rolling Plains climate divisions is expected to be between 50-75 percent of the 2010 cotton yield. The drought has had a large impact on livestock as ranchers across Texas were facing the tough decision of whether to continue the supplemental feeding of cattle or to sell cattle. (Information provided by the Texas State Office of Climatology)
As described in the media, the drought in Texas is being seen as an agricultural "catastrophe" (1200 WOAI News Radio, 6/3/11): "Texas A&M researchers say the loss to agriculture statewide is now at $1.3 billion and growing. They say the state's cattle ranching industry, already damaged by wildfires that destroyed nearly 3 million acres, has been 'essentially destroyed' by the drought, and the cotton crop is in grave danger of being ruined." According to the National Weather Service, with 0.18 inch of precipitation, the weather station at Midland International Airport had the driest October-May on record.
As summarized by the Midwest Regional Climate Center, most of the Midwest received normal to above normal rainfall, with the exception of Wisconsin and the Arrowhead of Minnesota, where precipitation was about 75 percent of normal. Average daily temperatures during May ranged from 1 degree to 3 degrees F (0.8 to 1.7 degrees C) below normal in the western half of the region, to near normal to 2 degrees F (1.1 degrees C) above normal in the eastern half of the region. However, this does not really tell the story of temperature variability during the month. The first week of May was generally much colder than normal across the region, while the second week was much warmer than normal. The third and fourth weeks exhibited a pattern much like that for the month - cooler in the west, and warmer in the east.
As noted by the Northeast Regional Climate Center, precipitation totals averaged above normal for the fourth consecutive month. The region averaged 5.15 inches (131 mm), which was 129 percent of normal. The rainfall pattern this month yielded over 150 percent of the normal amounts in northern and central portions of the region, while coastal areas, including eastern Maryland, southern New Jersey, Rhode Island and Delaware had as little as 25 percent of the normal May total. State averages reflected that pattern, with five states - Delaware, Maryland, Massachusetts, New Jersey and Rhode Island - averaging below normal. Departures ranged from 58 percent of normal in Rhode Island to 172 percent of normal in Vermont. With a total of 16.18 inches 411 mm), the Northeast saw its 2nd wettest spring since 1895. Four states: New York, Pennsylvania, Vermont and West Virginia, had their wettest spring in 117 years; Maine had its 10th wettest. The two smallest states in the region, Delaware and Rhode Island, were the only states to average drier than normal, with 99 and 70 percent, respectively. Overall, the Northeast averaged 145 percent of normal; state departures ranged from the aforementioned 70 percent in Rhode Island to 169 percent of the normal amount in Pennsylvania. Summing up the year-to-date (January through May), it was the wettest in 117 years in New York and Pennsylvania, and the 2nd wettest in the Northeast.
The Northeast averaged warmer than normal in May. The average temperature of 58.8 degrees F (14.9 degrees C) was 2.5 degrees F (1.4 degrees C) above normal. It was the 19th warmest May since 1895. Spring 2011 (March - May) averaged 1.1 degrees F (0.6 degrees C) warmer than normal. The Northeast's average of 46.8 degrees F (8.2 degrees C) made this the 24th warmest spring since 1895.
As explained by the High Plains Regional Climate Center, precipitation varied somewhat across the High Plains Region this month. In general, heavy precipitation occurred from about central Kansas northward, and little to no precipitation fell across parts of southern Colorado and Kansas where drought conditions persisted. Several locations near the Colorado/Kansas border received less than 5 percent of normal precipitation this month and exceptional drought conditions (the highest intensity of drought according to the U.S. Drought Monitor) developed there. The main impact from these dry conditions was the decline in the winter wheat crops. Towards the end of the month, much needed rains fell in many parts of the Region and improved drought conditions. Abnormally dry conditions (D0) were eliminated from Wyoming and nearly all parts of Nebraska. Northeastern Colorado and north-central Kansas had one to two category improvements as well. Ample precipitation fell in areas of Wyoming, Nebraska, northeastern Colorado, eastern South Dakota, and western areas of the Dakotas.
Temperatures were cool across the High Plains Region this month. Average monthly temperatures were near normal in Kansas and up to 8 degrees F (4.4 degrees C) below normal across Wyoming, the panhandle of Nebraska, and the Dakotas. Each of these areas had locations which ranked in the top 10 coolest Mays on record. The cool weather has slowed planting activities and crop progress across large portions of the Region. While the cooler weather was a hindrance to much of the planting and crop progress, these conditions helped improve the declining winter wheat crop in Kansas.
The USDM had many changes throughout the month of May. Early in the month, persistent extreme dry conditions caused an expansion of drought across east-central Kansas. Extreme drought conditions (D3) were introduced in central Kansas and even exceptional drought conditions (D4) expanded along the border of Colorado and Kansas. The main impact from these dry conditions was the decline in the winter wheat crops. But, towards the end of the month, much needed rains fell in many parts of the drought stricken areas. Abnormally dry conditions (D0) were eliminated from Wyoming and nearly all parts of Nebraska. Northeastern Colorado and north-central Kansas had one to two category improvements as well.
As summarized by the Western Regional Climate Center, precipitation was above normal in parts of California, eastern Oregon and Washington and well above normal in portions of Utah, Wyoming and eastern Montana. The extreme southwest was very dry. It was the wettest May on record in Glasgow, Billings and Miles City, all dating back over 100 years. Both Miles City and Billings had only one month in their history wetter than this May. Significant snowpack remained in most of the Intermountain West with some locations over 1000 percent of normal. Snowpack in some locations, including the Sierra Nevada, continued to accumulate through and beyond the last day of the month, and was among the largest on record for this time of year in many basins, with the exception of parts of Arizona and New Mexico. Yet another cool, cloudy and wet spring month delayed runoff in many western rivers, with high potential for historic flooding along mountains streams and rivers throughout the entire region. Many areas in the northern Rockies and northern Plains were already flooding with the heavy rains that occurred in May, with releases on the Missouri River the highest since construction of its large upper mainstem reservoirs. Simultaneously, the winter-long effects of La Niña have left most of Arizona (especially its southeast), and nearly all of New Mexico (especially southern and plains areas) in the deepest category of drought.
Temperatures were below to well below normal throughout the entire West except for a small portion of eastern New Mexico. Many locations were 5-7 degrees F below normal, and in Billings MT was the second coolest May on record. After a decade of consecutive warm Mays extending from about 1999, this was the second very cool May in a row, with 2011 not quite as cool as 2010 in most locations.
Upper Colorado River Basin: As reported by the Colorado Climate Center, the May 31st NIDIS (National Integrated Drought Information System) assessment for the Upper Colorado River Basin (UCRB) indicated that most of the UCRB received an inch or more of precipitation for the month of May. The higher elevations received around 2 to 6 inches of moisture while the valleys received lower amounts. Southern Utah, southeastern Colorado, and the San Luis Valley were much drier, receiving less than an inch of moisture for the month. The majority of the SNOTEL sites in the UCRB had very high (and in many cases, record high) percentile rankings for water-year-to-date precipitation. Snowpack around most of the UCRB was much above average. Snowpack for the entire basin above Lake Powell was 223 percent of average as of May 26th, largely due to a later than average snowmelt season combined with higher than average seasonal snow accumulations. The Upper Green basin, the Upper Colorado above Kremmling, and the Duchesne basin surpassed their seasonal peak accumulations and peaked later than average, while the San Juan basin never reached its average seasonal peak. Many stream gages in the northern part of the UCRB were very near flood-stage with a significant portion of their snowmelt still to come. Soil moisture conditions remained poor for southeastern Colorado. Soils were above average along the Wasatch range in Utah and have significantly improved over northeastern Colorado. At Avondale, Colorado (in the Arkansas basin), reference evapotranspiration (ET) was tracking along with the year of highest recorded ET, which was during the drought of 2002. Due to delayed snowmelt (and cooler than average temperatures) in the higher elevations, many of the reservoirs in the northern UCRB have seen a delay in increased inflows. Storage volumes at Lake Dillon continued to decrease. Storage volumes at Flaming Gorge, Green Mountain and Lake Granby only began increasing in mid-May. Lake Powell, McPhee, and Navajo Reservoir storages (all in the southern portion of the basin) have all been increasing since April.
Pacific Islands: According to reports from National Weather Service offices, the Pacific ENSO Applications Climate Center (PEAC), and partners, conditions varied across the Pacific Islands.
Near to below normal precipitation fell during the past 30 days in the Hawaiian Islands. Rainfall during April and early May helped reduce agricultural drought conditions over portions of the leeward Big Island slopes. This helped knock down a stubborn pocket of extreme drought (D3 category conditions on the USDM map) to severe drought (D2 conditions) over the Pohakuloa area. The Big Island was finally free of extreme drought which had been in place continuously since July 7, 2009. Severe drought also persisted near the Kawaihae area of the south Kohala district. Elsewhere on the Big Island, areas of moderate drought (D1 conditions) continued over portions of the leeward slopes from the north Kohala district to Kau. In Maui county, moderate drought continued over the leeward slopes from Lahaina to Makena and over the western third of Molokai. Kauai and Oahu remained drought-free.
Some drought impacts in Hawaii include the following:
- On Oahu, there were no drought impacts to report. The water supply in the Waimanalo reservoir remained well above drought level. However, the State of Hawaii Department of Agriculture was maintaining a 10 percent cutback in irrigation water use as a precaution for the dry season.
- On Molokai, no significant changes since the May 5 update. The State of Hawaii Department of Agriculture has kept in place the mandatory 30 percent cutback in irrigation water consumption.
- On Maui, pastures and general vegetation from Kaonoulu to Kamaole near Kihei have recovered enough to support cattle ranching operations. However, dryness persisted over the leeward slopes and conditions may worsen heading into the heart of the dry season. There has been an increase in reports of axis deer encroachments into developed areas near Wailea due to forage degradation in the normal range lands. Water supply levels remained sufficient for upcountry Maui. However, as a precaution, the Maui County Department of Water Supply continued to request a 5 percent reduction in water use by upcountry residents. A 10 percent reduction in water use by central and south Maui residents also remained in effect.
- On the Big Island, pastures and general vegetation conditions have been slowly improving over portions of the leeward Big Island slopes. However, reports from the agriculture community suggest that this recovery may be short-lived since soil moisture remained poor heading deeper into the dry season. One major cattle ranching operation has already started destocking herds. Another complication affecting the upslope leeward pastures is an infestation of fireweed which has replaced normal livestock grasses that were killed by the extreme to exceptional drought conditions. Fireweed is poisonous to cattle and also poses an increase in fire risk because it is not grazed.
On other Pacific Islands, drought conditions on Kapingamarangi lessened as the La Niña pattern across the equatorial Pacific transitioned to ENSO neutral. As seen in the table below, rainfall across the western Pacific has been highly variable from month to month. Above-normal rainfall returned to many Pacific islands during May, although some areas were drier than normal. Long-term (September 2010-May 2011) deficits remained at some of the islands.
| Station Name | Sept. 2010 | Oct. 2010 | Nov. 2010 | Dec. 2010 | Jan. 2011 | Feb. 2011 | Mar. 2011 | Apr. 2011 | May 2011 | Sep. 2010-May 2011 |
| Chuuk | 114% | 113% | 66% | 85% | 76% | 137% | 156% | 109% | 66% | 99% |
| Guam IAP | 90% | 112% | 53% | 76% | 205% | 166% | 138% | 142% | 95% | 108% |
| Kapingamarangi | 12% | 26% | 25% | 9% | 22% | 2% | 61% | 74% | 69% | 40% |
| Koror | 103% | 89% | 94% | 75% | 163% | 145% | 170% | 130% | 180% | 125% |
| Kosrae | 40% | 85% | 74% | 76% | 82% | 67% | 51% | 74% | 151% | 78% |
| Kwajalein | 71% | 162% | 158% | 37% | 119% | 316% | 277% | 49% | 91% | 123% |
| Majuro | 166% | 96% | 142% | 95% | 100% | 190% | 188% | 28% | 109% | 119% |
| Pago Pago | 132% | 153% | 82% | 92% | 183% | 110% | 52% | 36% | 35% | 98% |
| Pohnpei | 100% | 75% | 97% | 75% | 98% | 125% | 148% | 47% | 95% | 93% |
| Saipan | 67% | 40% | 82% | 43% | 182% | 124% | 164% | 209% | 154% | 89% |
| Yap | 74% | 141% | 98% | 69% | 164% | 123% | 171% | 129% | 169% | 121% |
[top]
State/Regional/National Moisture Status
A detailed review of drought and moisture conditions is available for all contiguous U.S. states, the nine standard regions, and the nation (contiguous U.S.):
| northeast u. s. | east north central u. s. | central u. s. |
| southeast u. s. | west north central u. s. | south u. s. |
| southwest u. s. | northwest u. s. | west u. s. |
| Contiguous United States |
[top]
Drought Indicators
- Palmer Drought Indices
- Standardized Precipitation Index
- long-term (36 to 60 month) percent of normal precipitation maps
- airport station percent of normal precipitation maps
- statewide precipitation rank maps
- Cooperative station percent of normal precipitation maps
- percent of average maps for the SNOTEL stations in the western mountains provided by the Western Regional Climate Center
- hydrologic year precipitation
- snow water equivalent of snowpack
- satellite-based observations of vegetative health
- National Weather Service model calculations of soil moisture, runoff, and evaporation
- National Weather Service model calculations of soil moisture using the Leaky Bucket Model
- Midwest Regional Climate Center model calculations of soil moisture
- topsoil moisture conditions observed by the USDA and mapped by the Climate Prediction Center
- pasture and range land conditions observed by the USDA and mapped by the Climate Prediction Center
- streamflow maps maintained by the USGS
[top]
Contacts & Questions