Summary
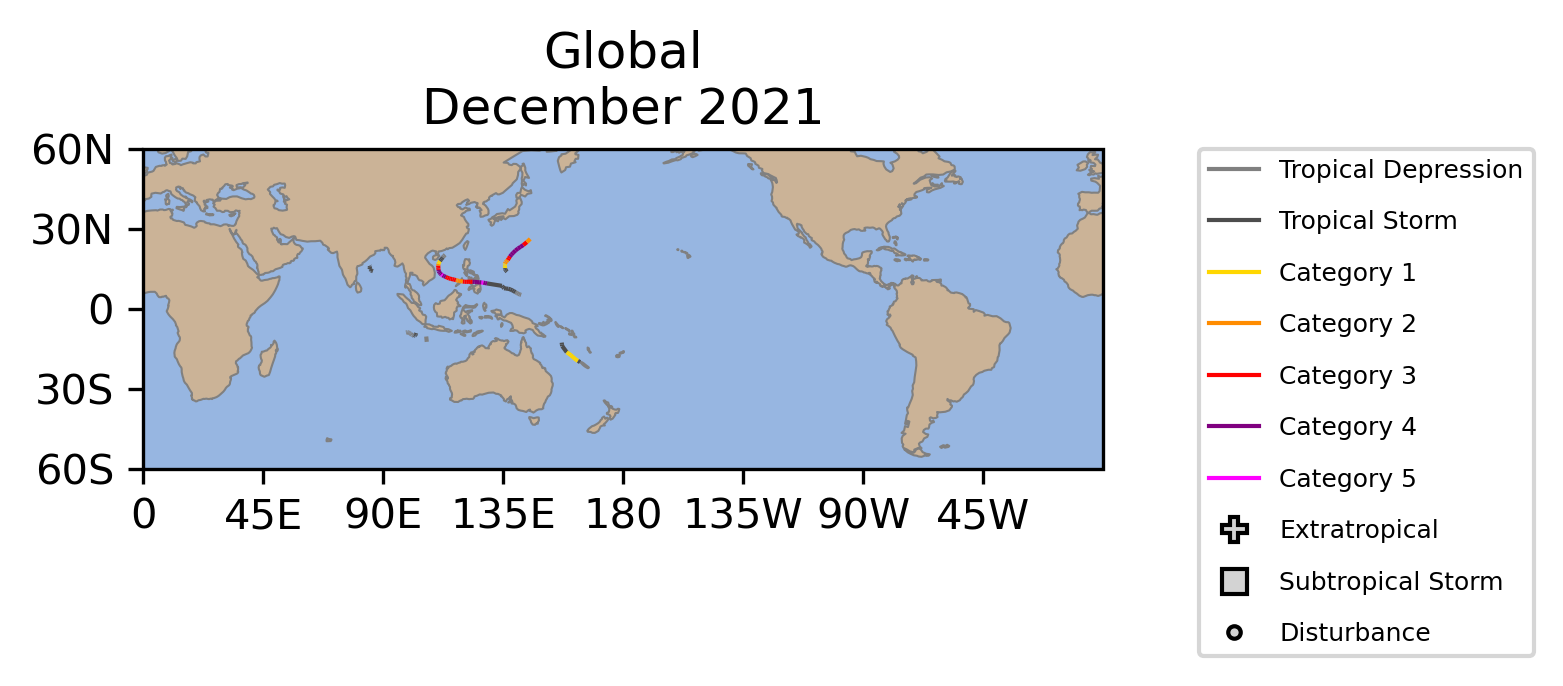
Global tropical cyclone activity was near normal by all metrics in December with six named storms, including three tropical cyclones, two of which became major tropical cyclones. The accumulated cyclone energy (ACE: an integrated metric of the strength, frequency, and duration of tropical storms) was also near normal.
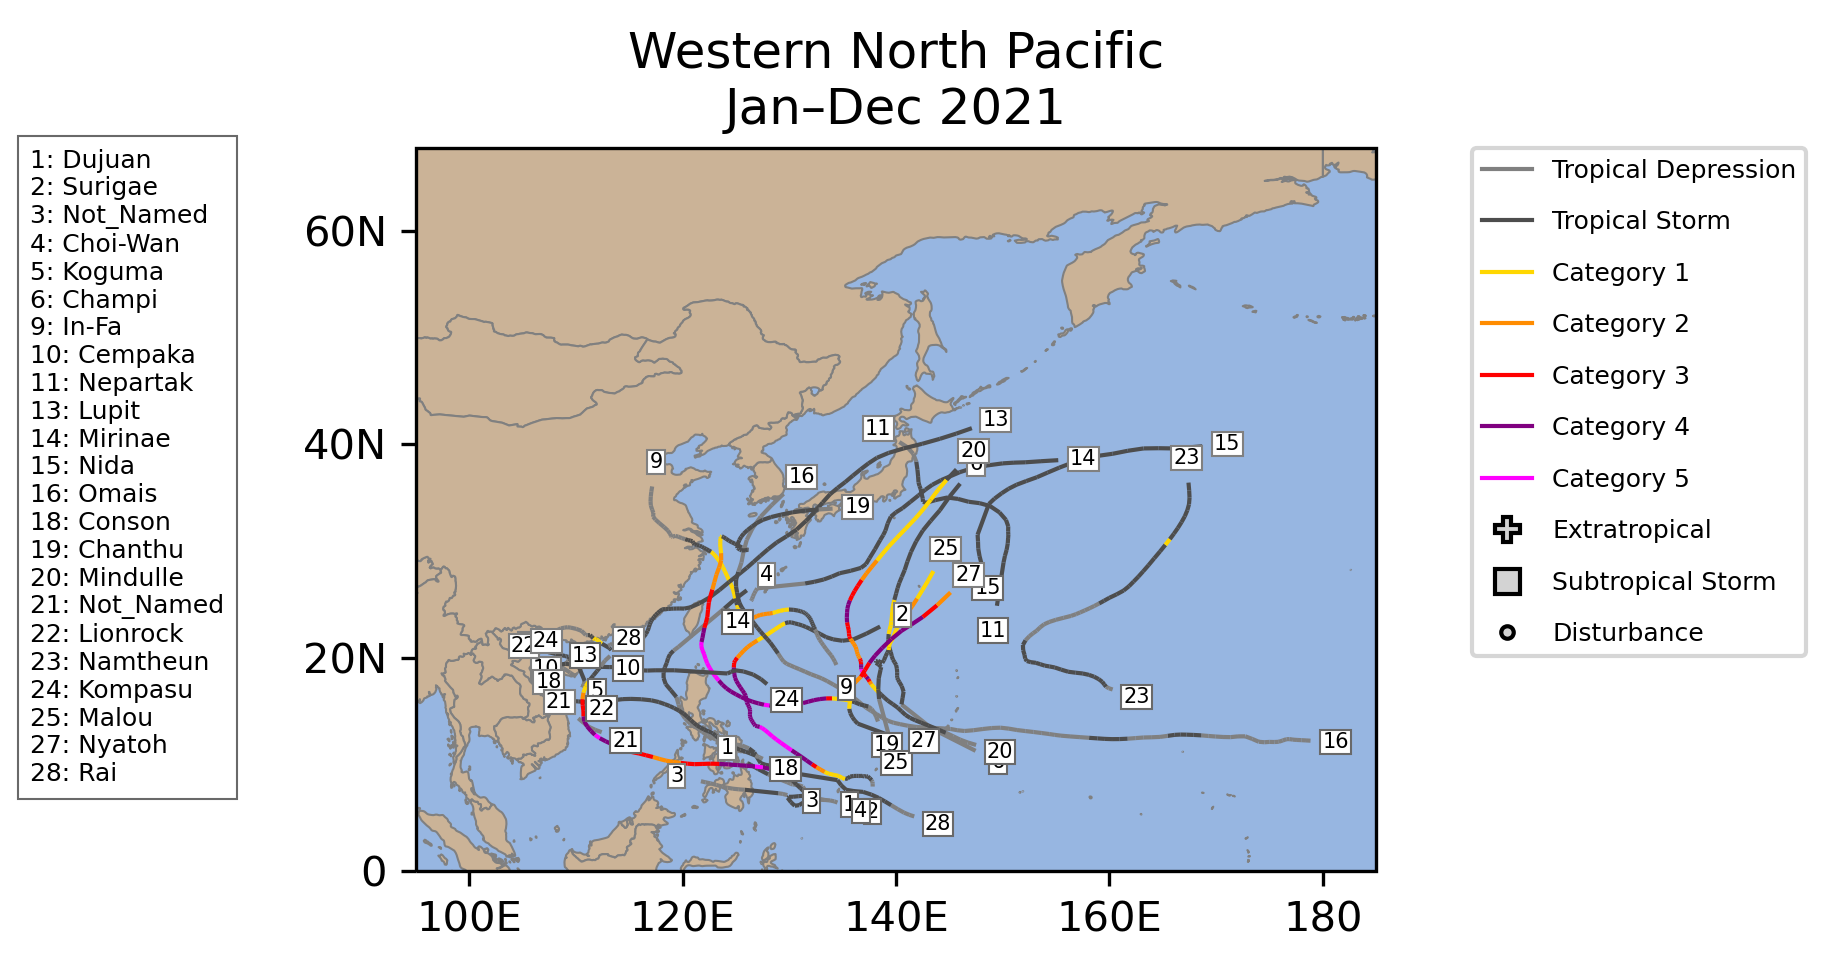
Both major tropical cyclones in December happened in the West Pacific, which typically only sees a major typhoon every other December on average. Super Typhoon Rai was the most impactful storm of December. It made landfall in the Philippines shortly after rapidly intensifying to category 5 strength. It caused widespread damage and killed hundreds of people. Rai was the sixth category 5 storm globally in 2021 and the fourth in the West Pacific.
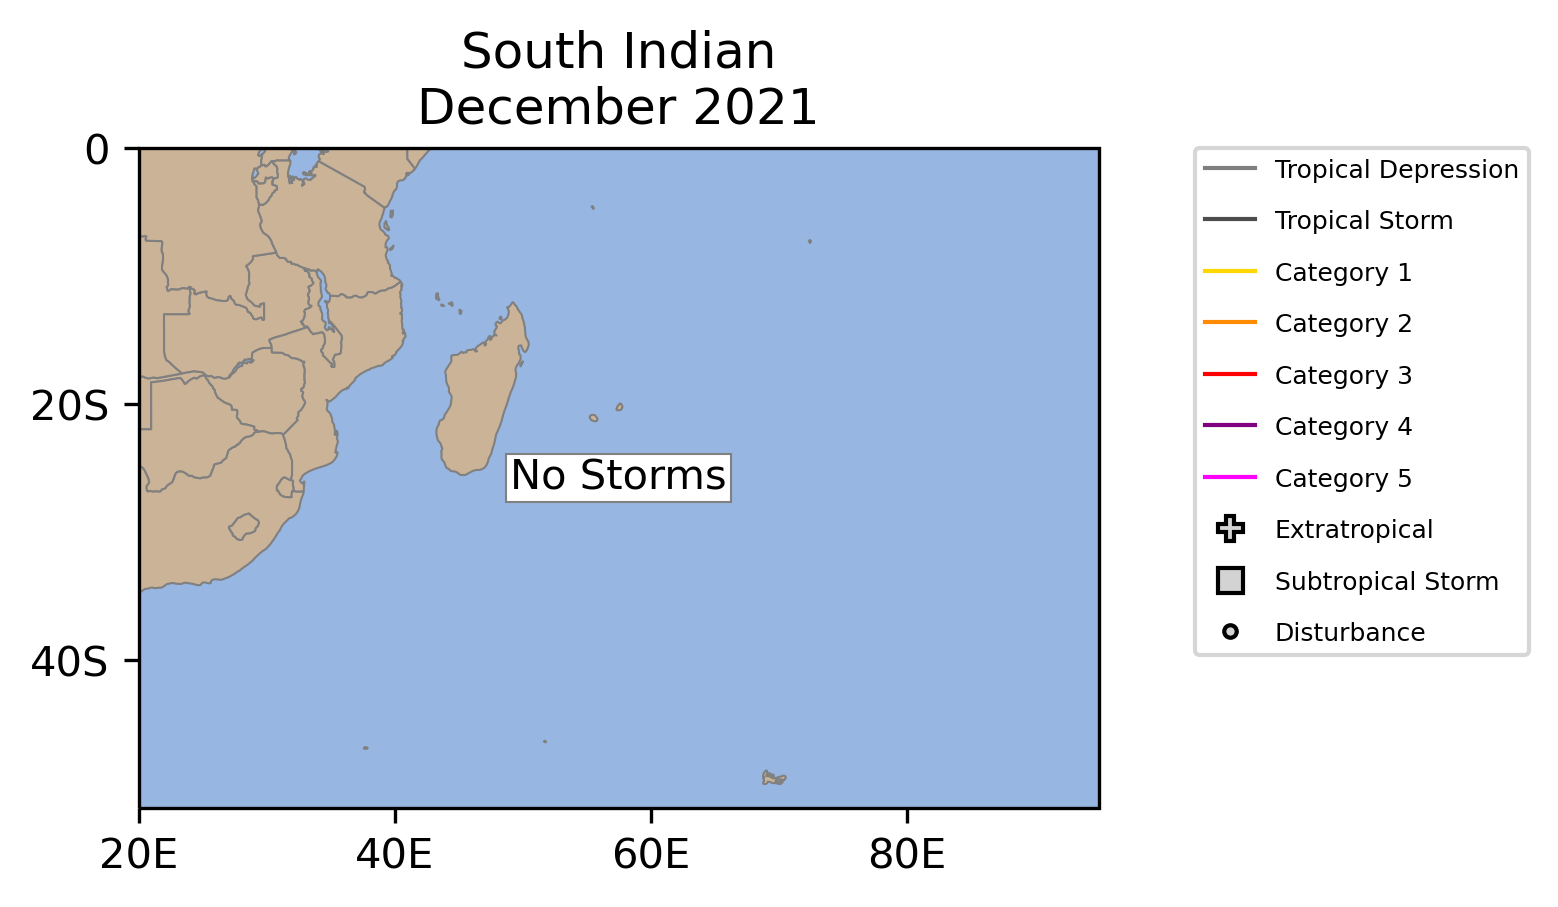
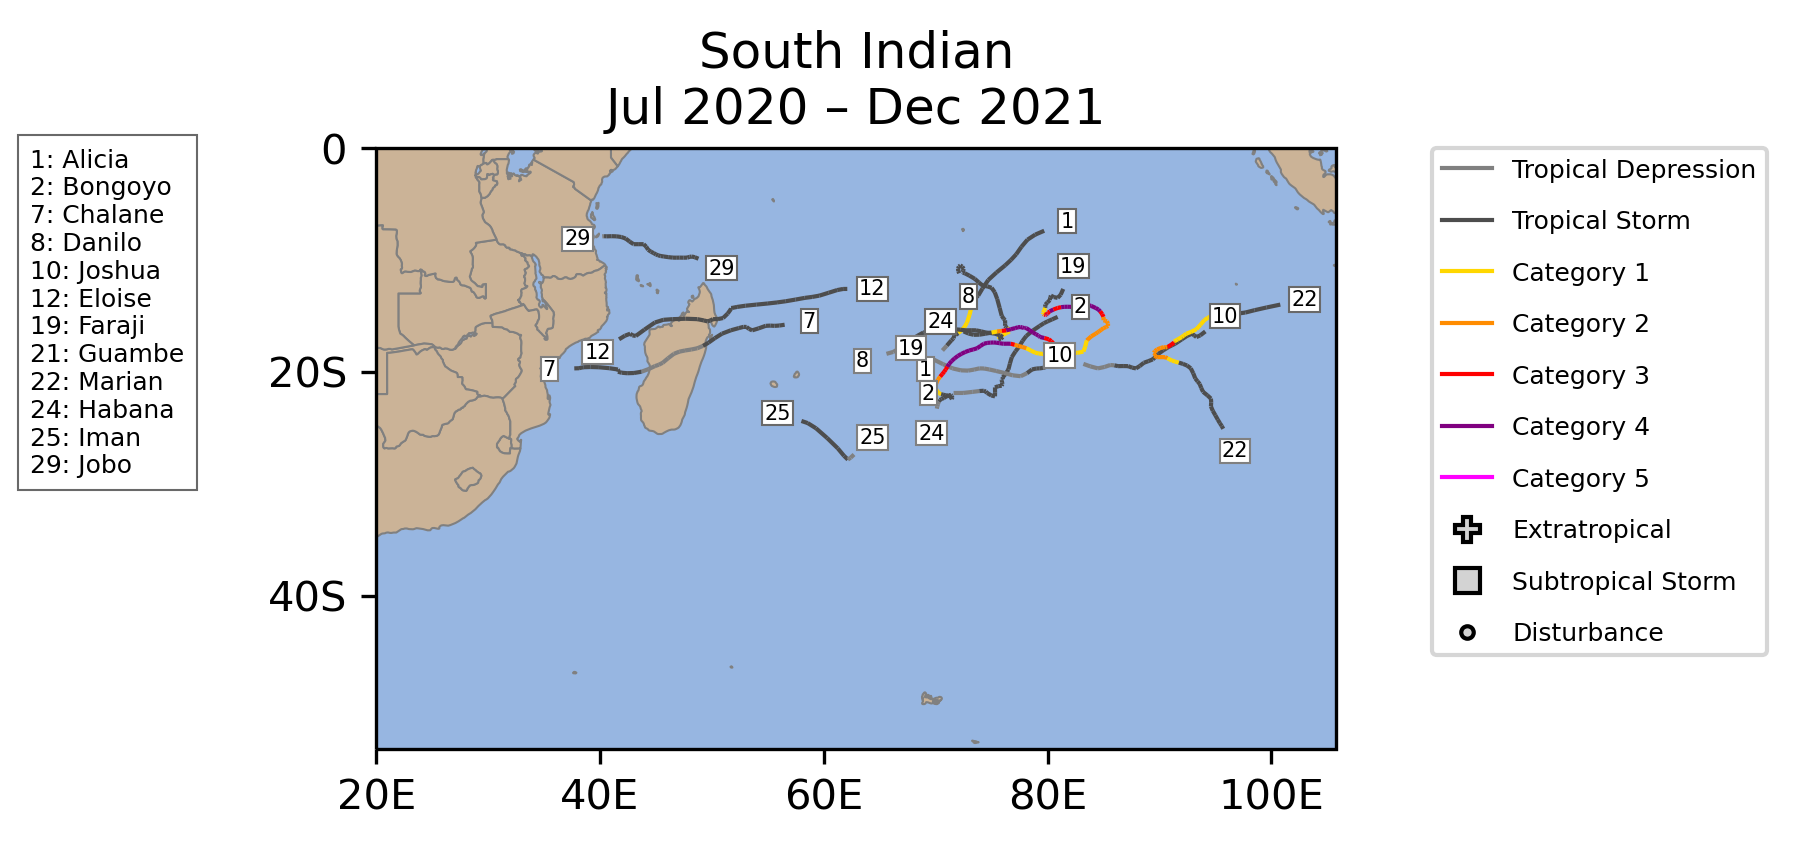
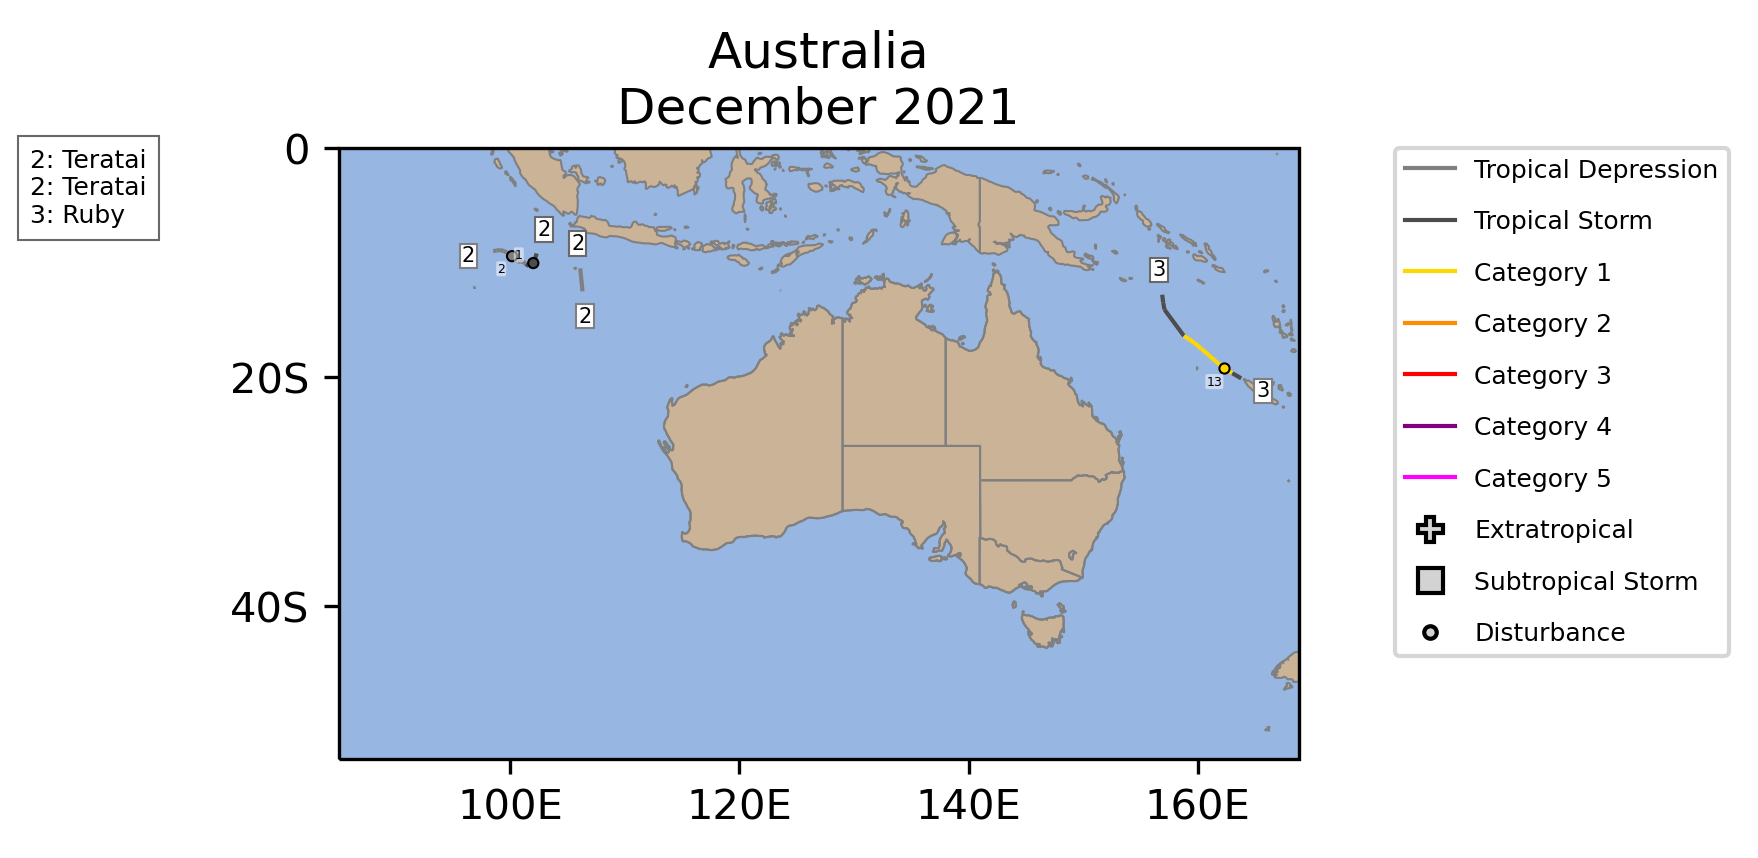
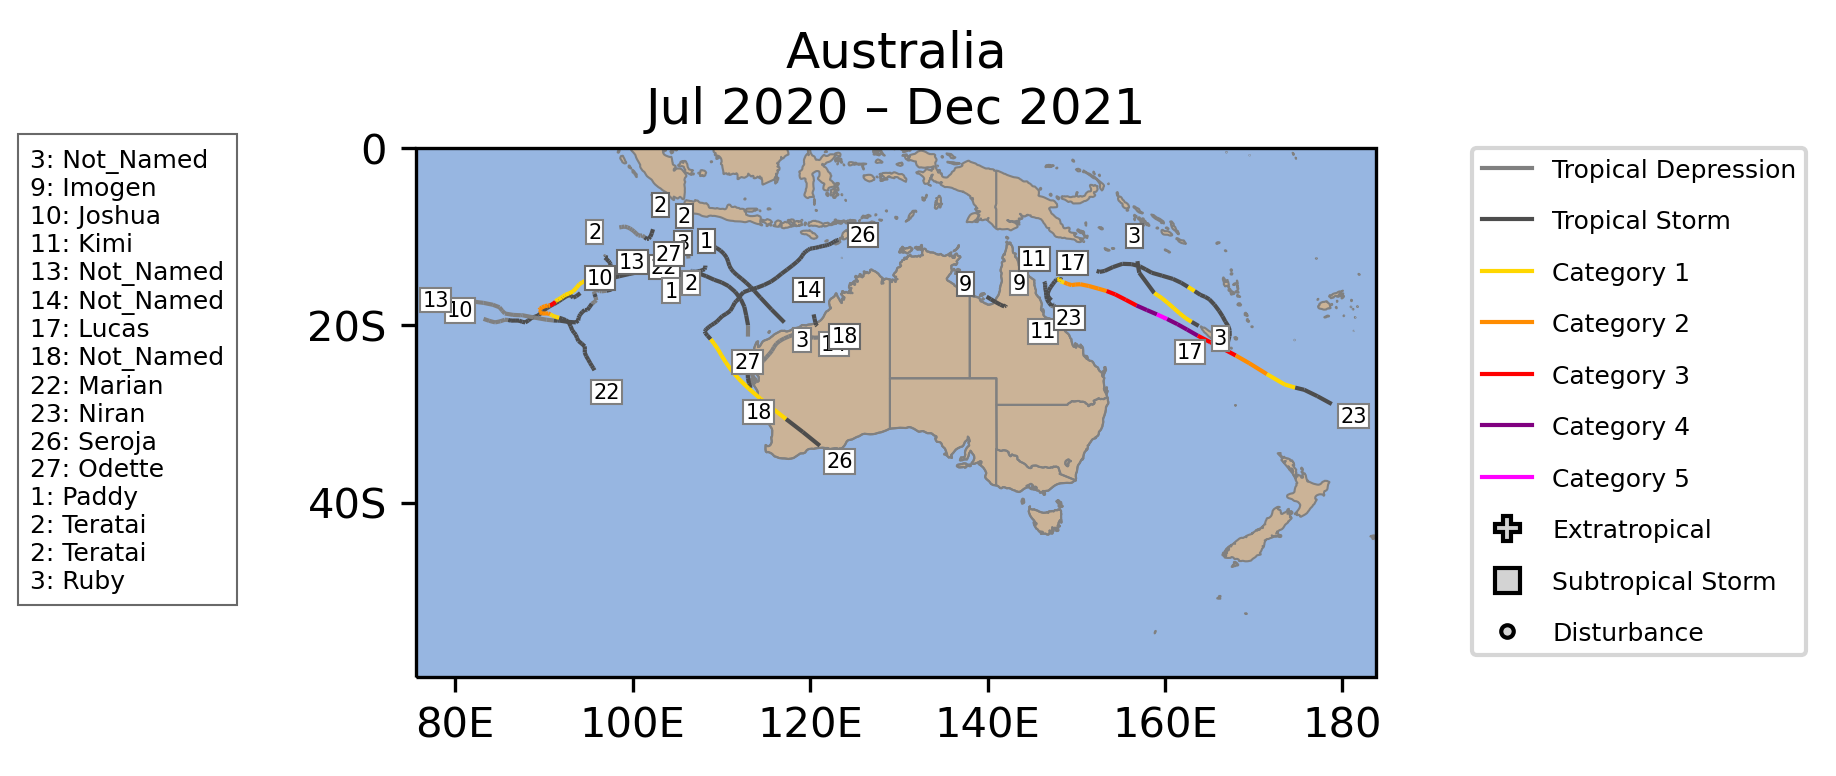
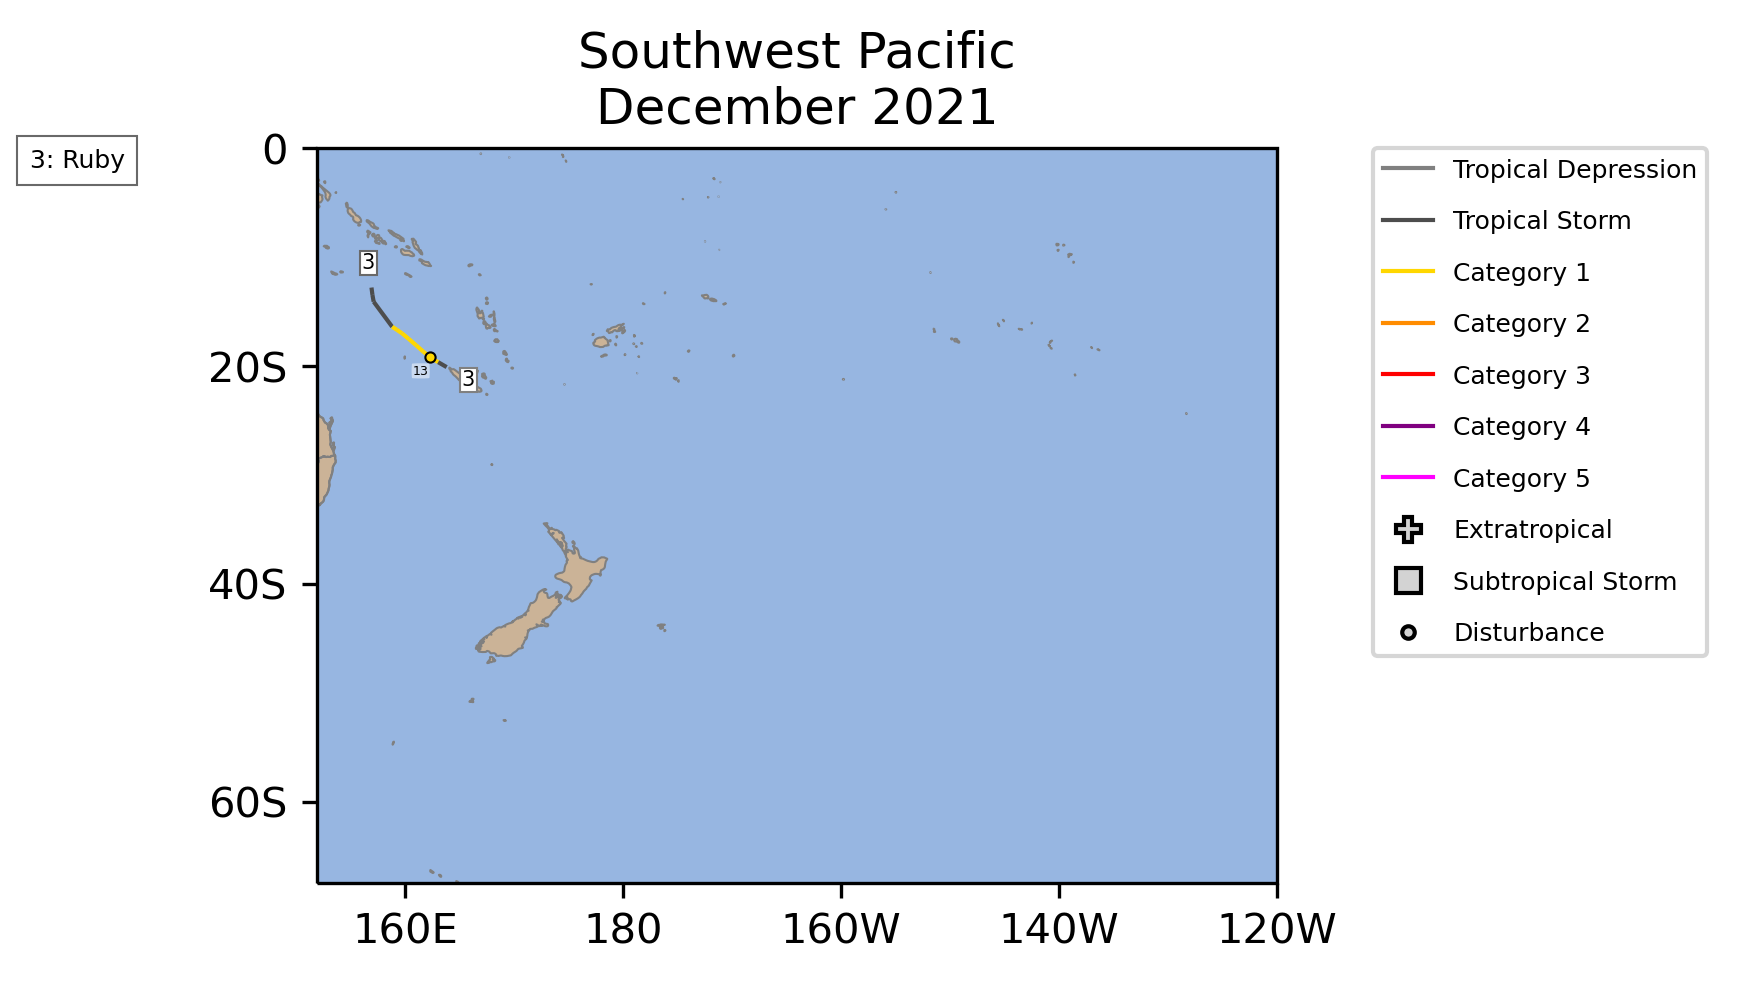
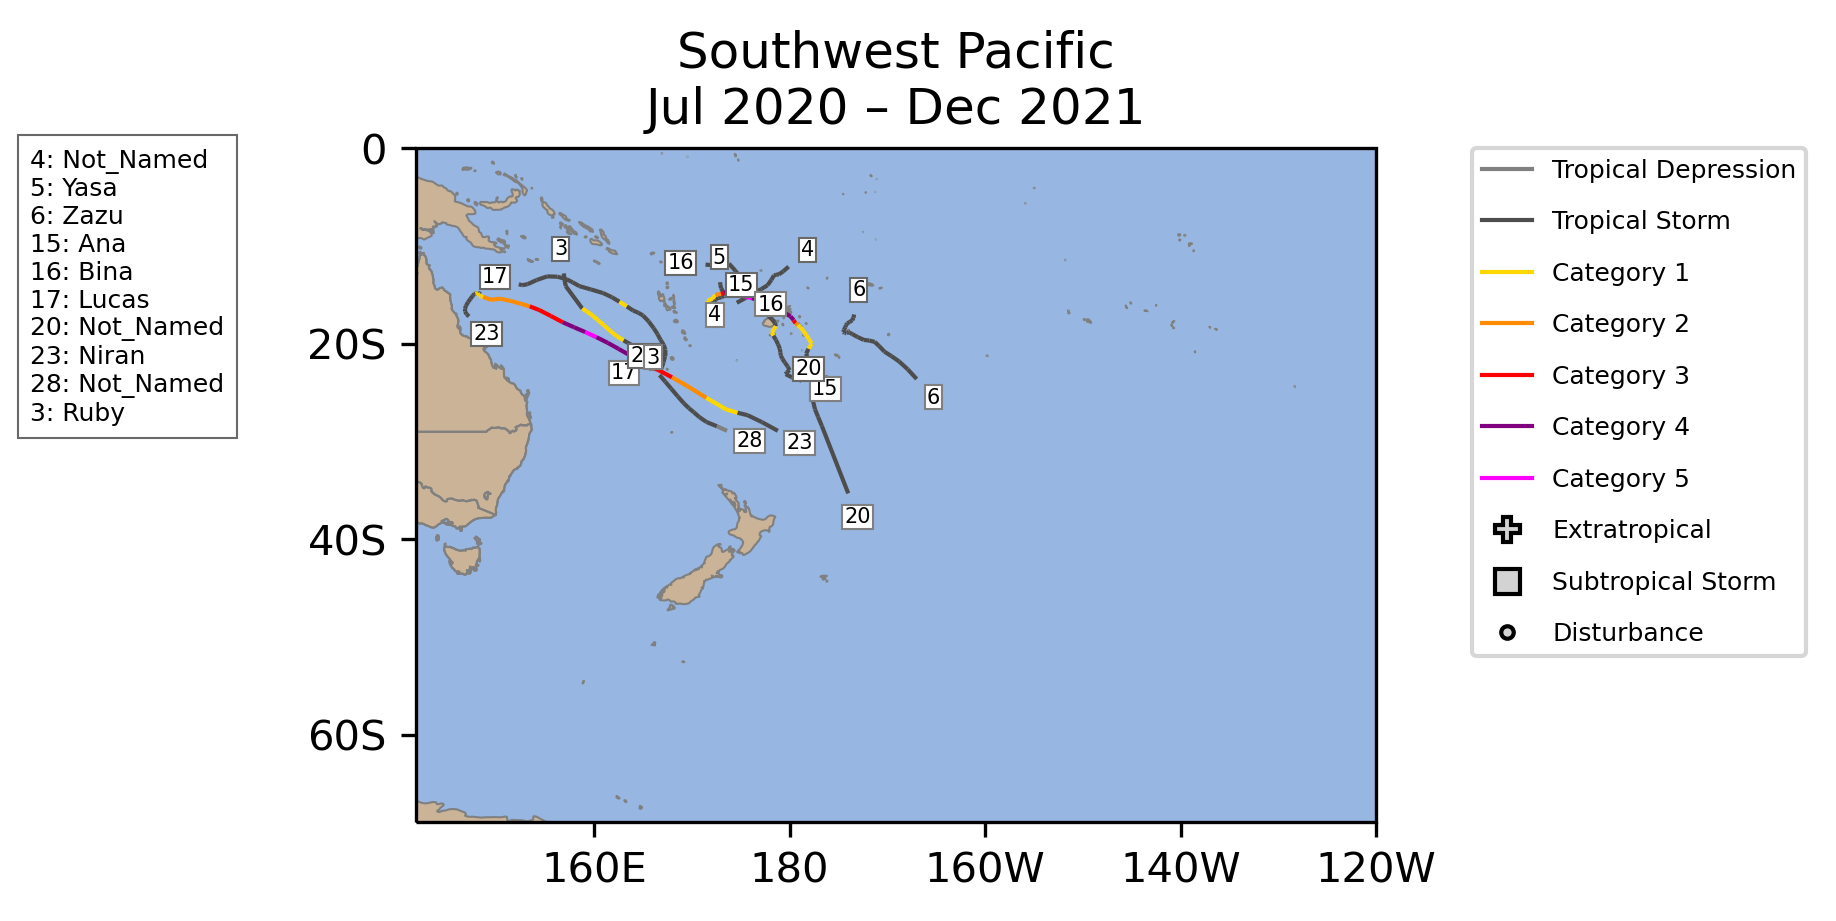
No tropical cyclones formed in the South Indian Ocean in December, which usually produces 1.4 storms per December on average. The Australian region had two named storms, which was near normal. Tropical Storm Teratai was briefly active on December 1 and then it reemerged on December 8-9. Tropical Cyclone Ruby reached hurricane strength as it passed near New Caledonia. Ruby also passed into the Southwest Pacific basin where it was the lone tropical cyclone for December, which was still near normal.
North Atlantic
No North Atlantic Tropical Cyclones occurred during December 2021.
| Storm Type | Count | 1991-2020 Mean |
1981-2021 Rank* |
1851-2021 Record |
|---|---|---|---|---|
| Tropical Storm Winds ≥ 39 mph (34 kts) | 0 | 0.3 (3 in 10 Decembers) | 10th (tied with 31 other Decembers) | 3 (1887) |
| Hurricane Winds ≥ 74 mph (64 kts) | 0 | 0.1 (1 in 10 Decembers) | 4th (tied with 37 other Decembers) | 1 (7 Decembers) |
| Major Hurricane Winds ≥ 111 mph (96 kts) | 0 | 0.0 (0 in 10 Decembers) | 1st (tied with 40 other Decembers) | 0 |
| Accumulated Cyclone Energy ACE×10⁴ kt² | 0.0 | 0.8 (8 in 10 Decembers) | 10th (tied with 31 other Decembers) | 16.2 (1984) |
| Storm Type | Count | 1991-2020 Mean |
1981-2021 Rank* |
1851-2021 Record |
|---|---|---|---|---|
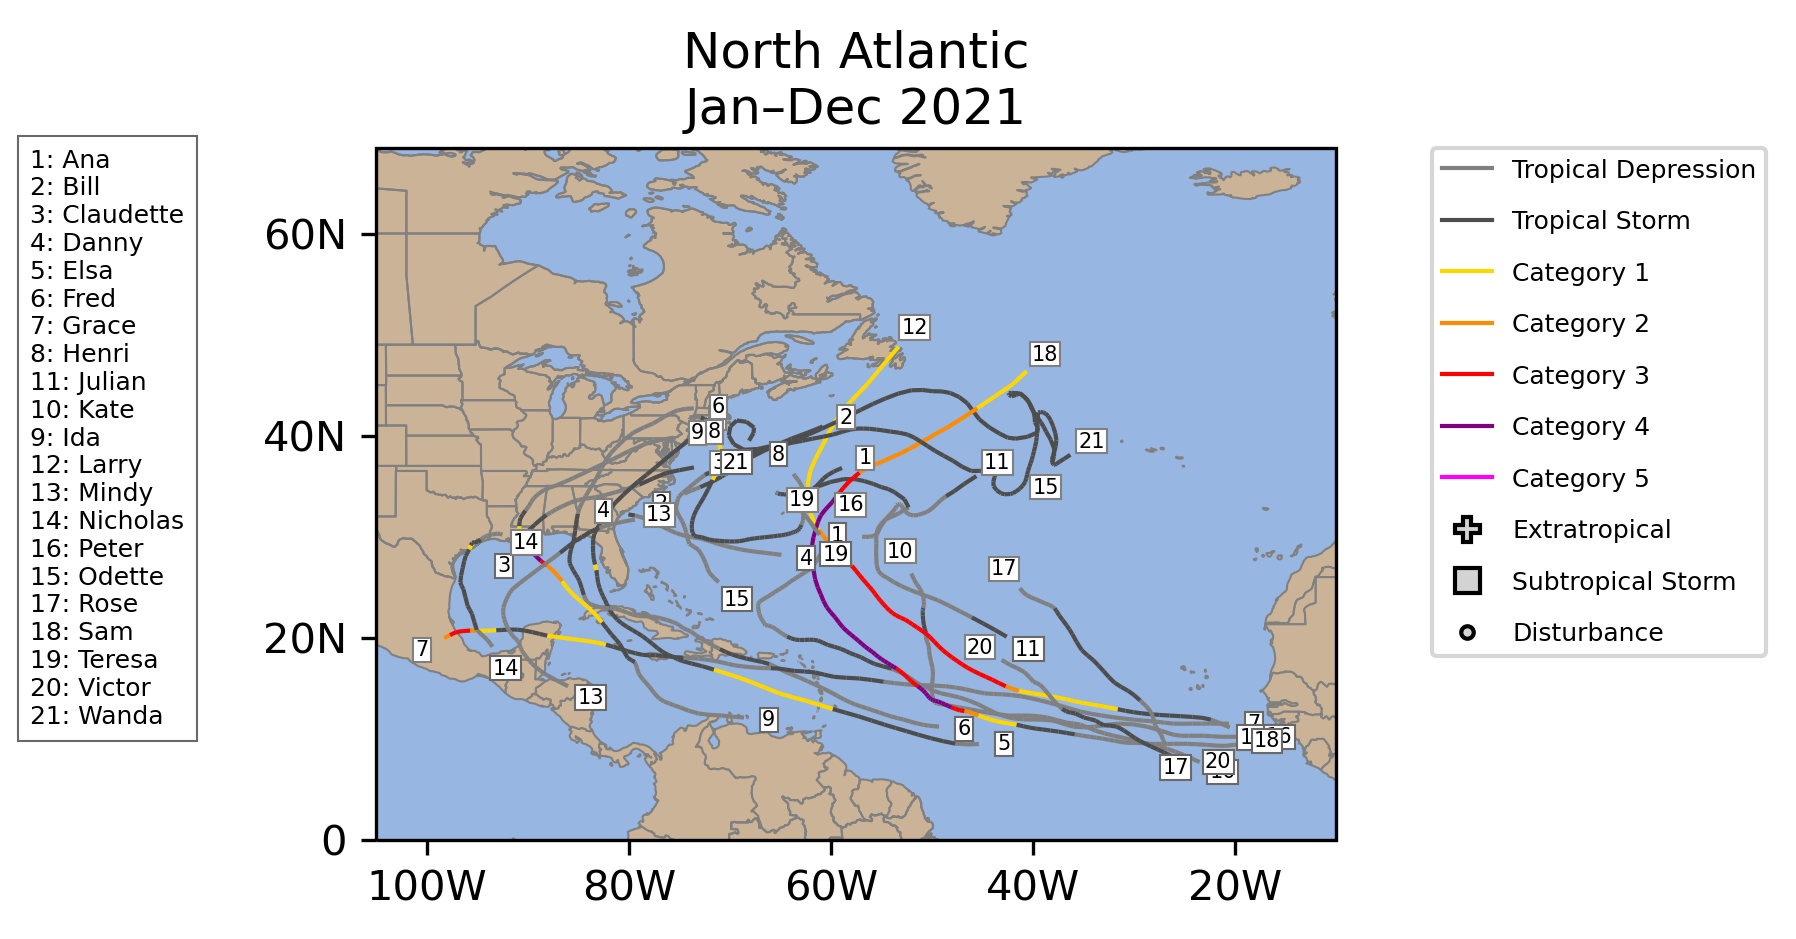
| Tropical Storm Winds ≥ 39 mph (34 kts) | 21 | 14.5 | 3rd | 30 (2020) |
| Hurricane Winds ≥ 74 mph (64 kts) | 7 | 7.2 | 16th (tied with 6 other seasons) | 15 (2005) |
| Major Hurricane Winds ≥ 111 mph (96 kts) | 4 | 3.2 | 10th (tied with 3 other seasons) | 7 (2005, 2020) |
| Accumulated Cyclone Energy ACE×10⁴ kt² | 145.7 | 122.8 | 12th | 258.6 (1933) |
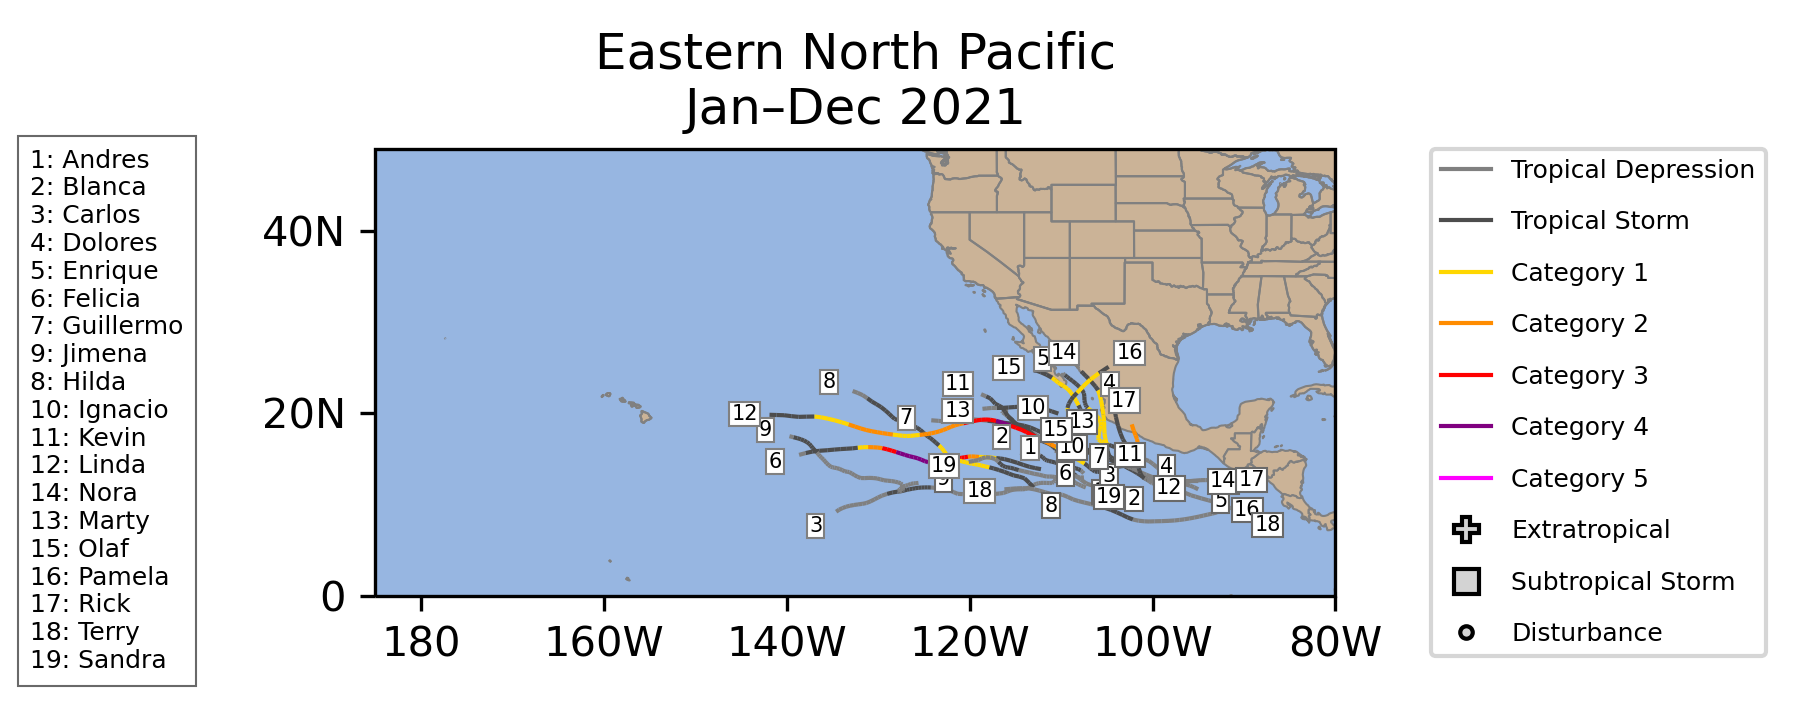
East Pacific
No East Pacific Tropical Cyclones occurred during December 2021.
| Storm Type | Count | 1991-2020 Mean |
1981-2021 Rank* |
1949-2021 Record |
|---|---|---|---|---|
| Tropical Storm Winds ≥ 39 mph (34 kts) | 0 | 0.1 (1 in 10 Decembers) | 4th (tied with 37 other Decembers) | 1 (5 Decembers) |
| Hurricane Winds ≥ 74 mph (64 kts) | 0 | 0.0 (0 in 10 Decembers) | 2nd (tied with 39 other Decembers) | 1 (1957, 1983) |
| Major Hurricane Winds ≥ 111 mph (96 kts) | 0 | 0.0 (0 in 10 Decembers) | 1st (tied with 40 other Decembers) | 0 |
| Accumulated Cyclone Energy ACE×10⁴ kt² | 0.0 | 0.2 (2 in 10 Decembers) | 4th (tied with 37 other Decembers) | 11.7 (1957) |
| Storm Type | Count | 1991-2020 Mean |
1981-2021 Rank* |
1949-2021 Record |
|---|---|---|---|---|
| Tropical Storm Winds ≥ 39 mph (34 kts) | 19 | 16.9 | 16th (tied with 3 other seasons) | 27 (1992) |
| Hurricane Winds ≥ 74 mph (64 kts) | 8 | 8.8 | 24th (tied with 4 other seasons) | 16 (1990, 1992, 2014, 2015) |
| Major Hurricane Winds ≥ 111 mph (96 kts) | 2 | 4.6 | 30th (tied with 7 other seasons) | 11 (2015) |
| Accumulated Cyclone Energy ACE×10⁴ kt² | 94.0 | 132.8 | 30th | 318.1 (2018) |
West Pacific
| Name |
Maximum CategoryMax Cat |
Dates >39 mph |
Maximum Sustained Winds | Minimum Central Pressure |
|---|---|---|---|---|
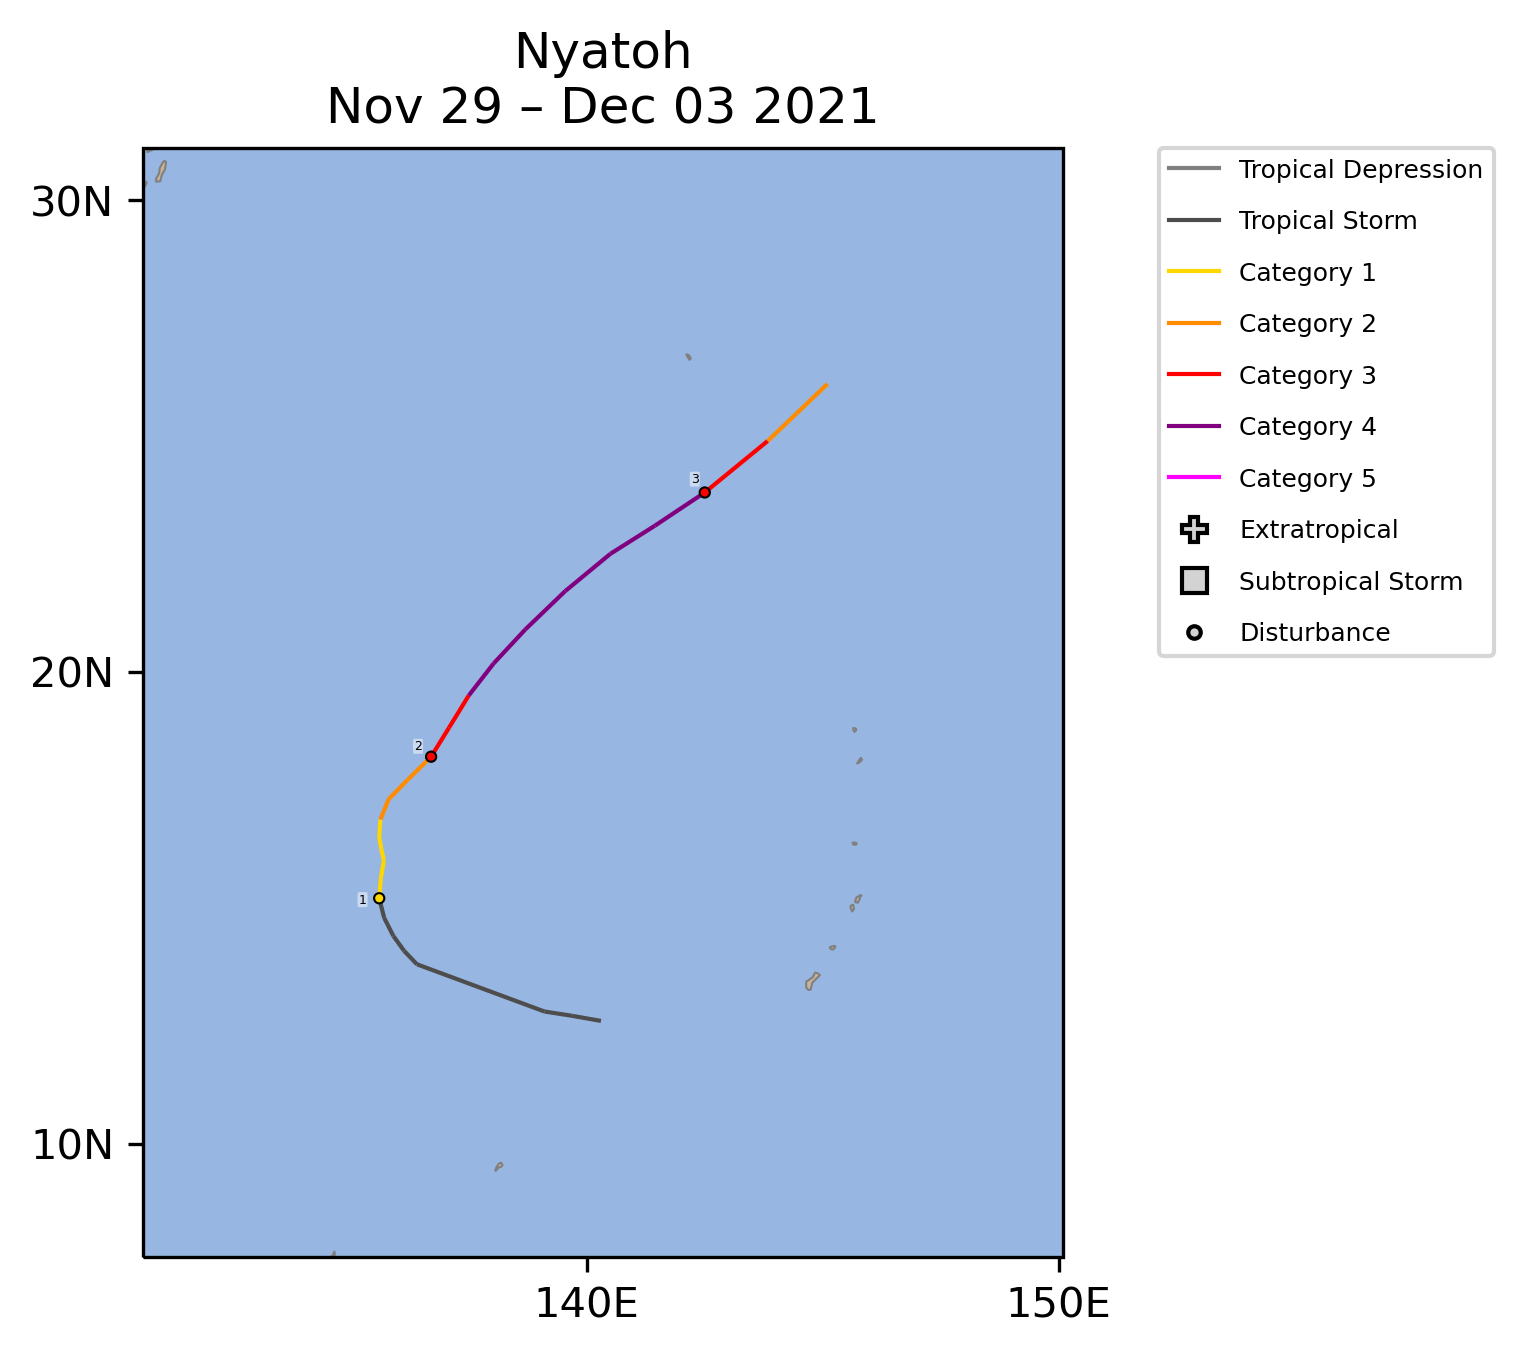 | 4 | November 29-December 4Nov 29-Dec 4 | 145 mph | 933 mb |
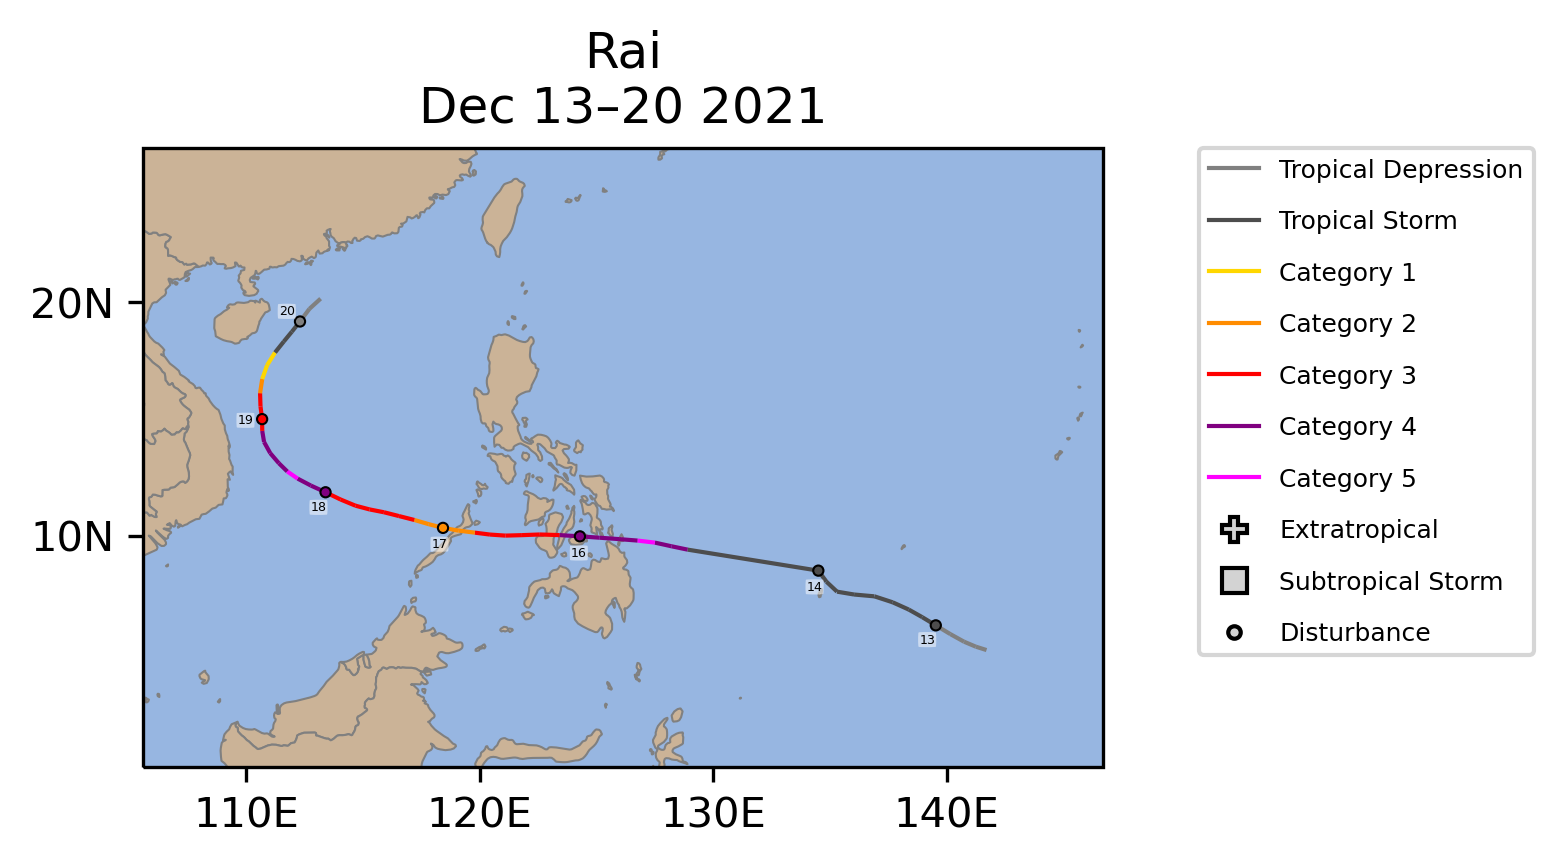 | 5 | December 13Dec 13-20 | 165 mph | 915 mb |
| Storm Type | Count | 1991-2020 Mean |
1981-2021 Rank* |
1945-2021 Record |
|---|---|---|---|---|
| Tropical Storm Winds ≥ 39 mph (34 kts) | 2 | 1.5 | 6th (tied with 17 other Decembers) | 4 (1952, 1986, 2001) |
| Typhoon Winds ≥ 74 mph (64 kts) | 2 | 0.8 (8 in 10 Decembers) | 3rd (tied with 7 other Decembers) | 3 (1986, 1993) |
| Major Typhoon Winds ≥ 111 mph (96 kts) | 2 | 0.5 (5 in 10 Decembers) | 1st (tied with 3 other Decembers) | 2 (9 Decembers) |
| Accumulated Cyclone Energy ACE×10⁴ kt² | 33.9 | 14.0 | 6th | 72.1 (1959) |
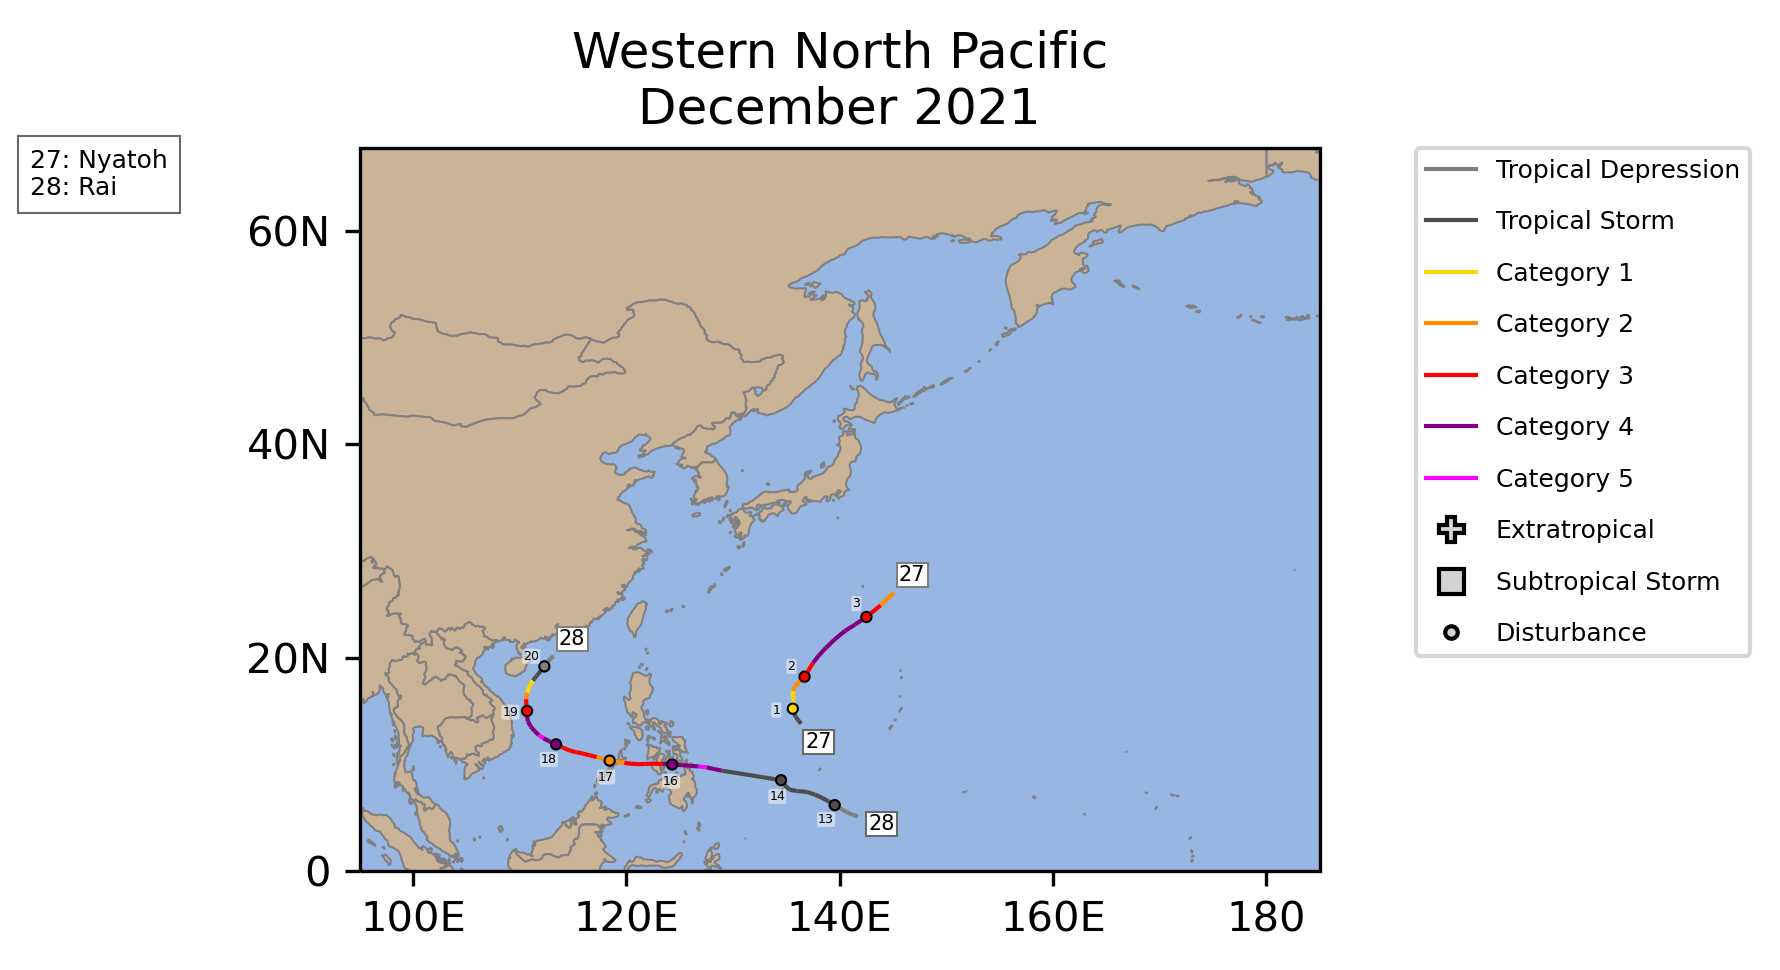
| Storm Type | Count | 1991-2020 Mean |
1981-2021 Rank* |
1945-2021 Record |
|---|---|---|---|---|
| Tropical Storm Winds ≥ 39 mph (34 kts) | 23 | 26.4 | 32nd (tied with 2 other seasons) | 38 (1964) |
| Typhoon Winds ≥ 74 mph (64 kts) | 10 | 16.2 | 38th (tied with 1 other season) | 26 (1964) |
| Major Typhoon Winds ≥ 111 mph (96 kts) | 5 | 9.4 | 37th (tied with 2 other seasons) | 16 (2015) |
| Accumulated Cyclone Energy ACE×10⁴ kt² | 207.7 | 301.4 | 34th | 570.4 (1997) |
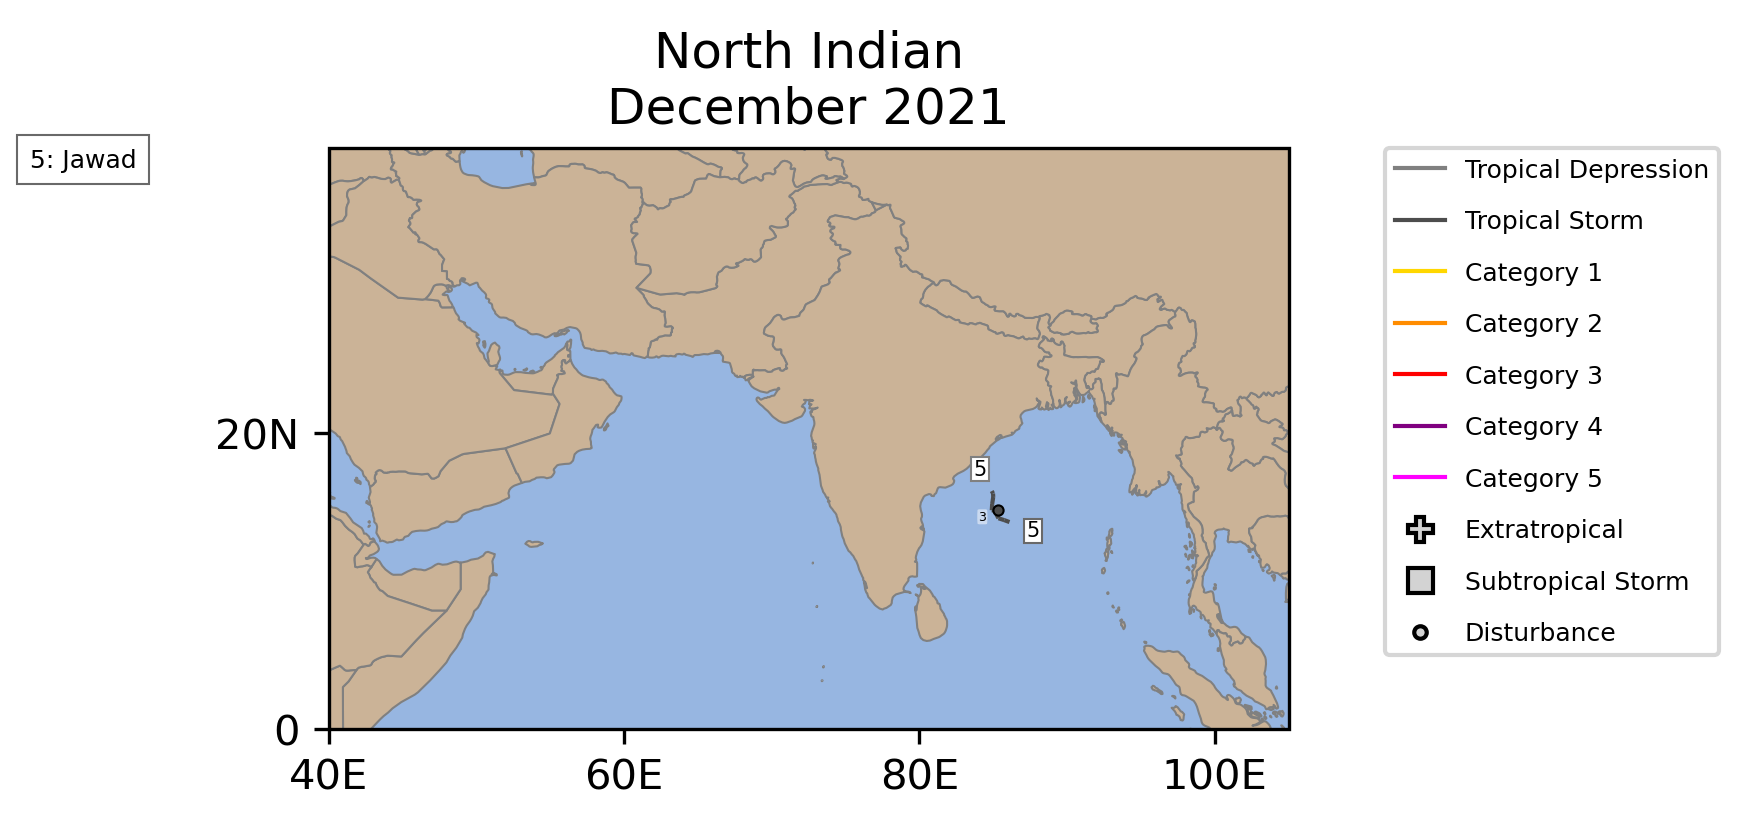
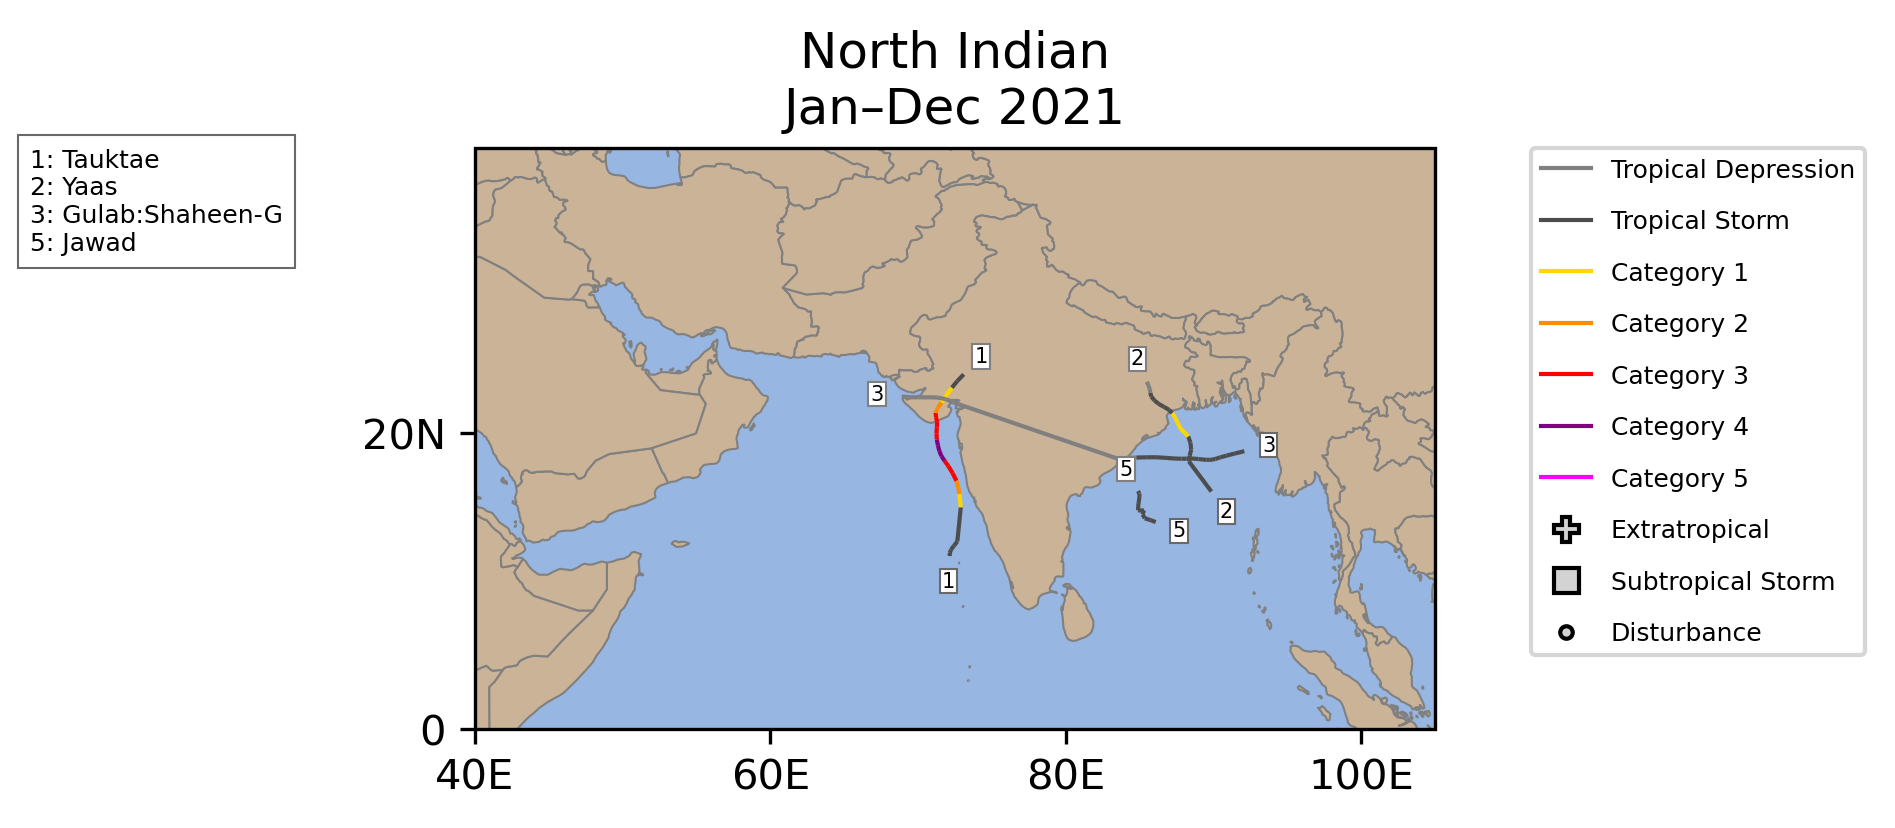
North Indian
| Name |
Maximum CategoryMax Cat |
Dates >39 mph |
Maximum Sustained Winds | Minimum Central Pressure |
|---|---|---|---|---|
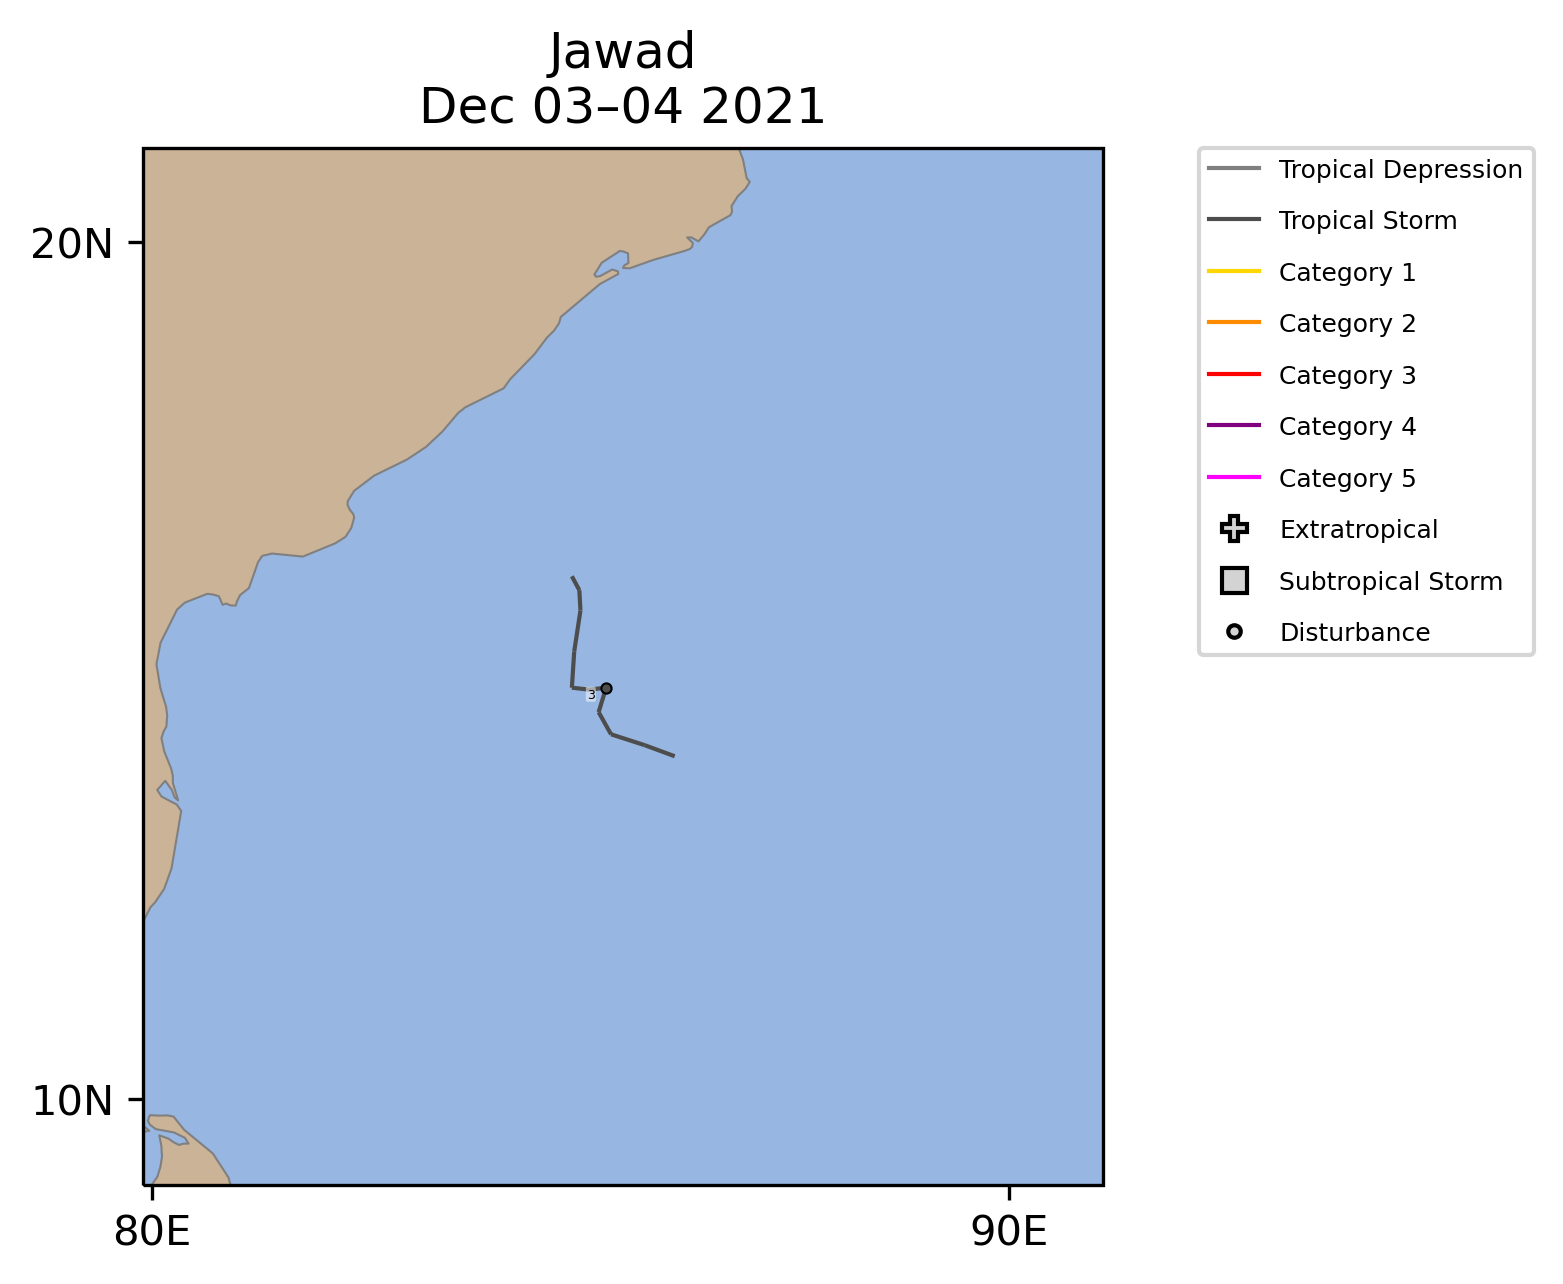 | TS | December 3Dec 3-4 | 40 mph | 997 mb |
| Storm Type | Count | 1991-2020 Mean |
1981-2021 Rank* |
1972-2021 Record |
|---|---|---|---|---|
| Tropical Storm Winds ≥ 39 mph (34 kts) | 1 | 0.9 (9 in 10 Decembers) | 8th (tied with 19 other Decembers) | 3 (2005) |
| Cyclone Winds ≥ 74 mph (64 kts) | 0 | 0.3 (3 in 10 Decembers) | 11th (tied with 30 other Decembers) | 1 (10 Decembers) |
| Major Cyclone Winds ≥ 111 mph (96 kts) | 0 | 0.0 (0 in 10 Decembers) | 2nd (tied with 39 other Decembers) | 1 (2017) |
| Accumulated Cyclone Energy ACE×10⁴ kt² | 0.7 | 2.8 | 24th (tied with 2 other Decembers) | 11.0 (2017) |
| Storm Type | Count | 1991-2020 Mean |
1981-2021 Rank* |
1972-2021 Record |
|---|---|---|---|---|
| Tropical Storm Winds ≥ 39 mph (34 kts) | 5 | 5.5 | 14th (tied with 13 other seasons) | 11 (1992) |
| Cyclone Winds ≥ 74 mph (64 kts) | 3 | 2.2 | 7th (tied with 5 other seasons) | 6 (2019) |
| Major Cyclone Winds ≥ 111 mph (96 kts) | 1 | 1.1 | 9th (tied with 16 other seasons) | 5 (2019) |
| Accumulated Cyclone Energy ACE×10⁴ kt² | 16.3 | 24.7 | 23rd | 93.0 (2019) |
South Indian
No South Indian Tropical Cyclones occurred during December 2021.
| Storm Type | Count | 1991-2020 Mean |
1981-2021 Rank* |
1956-2021 Record |
|---|---|---|---|---|
| Tropical Storm Winds ≥ 39 mph (34 kts) | 0 | 1.4 | 32nd (tied with 10 other Decembers) | 4 (1980) |
| Cyclone Winds ≥ 74 mph (64 kts) | 0 | 0.7 (7 in 10 Decembers) | 21st (tied with 21 other Decembers) | 3 (2014, 2020) |
| Major Cyclone Winds ≥ 111 mph (96 kts) | 0 | 0.5 (5 in 10 Decembers) | 13th (tied with 29 other Decembers) | 3 (2014) |
| Accumulated Cyclone Energy ACE×10⁴ kt² | 0.0 | 10.1 | 32nd (tied with 10 other Decembers) | 54.9 (2014) |
| Storm Type | Count | 1991-2020 Mean |
1981-2021 Rank* |
1956-2021 Record |
|---|---|---|---|---|
| Tropical Storm Winds ≥ 39 mph (34 kts) | 0 | 3.0 | 40th (tied with 2 other seasons) | 6 (1997) |
| Cyclone Winds ≥ 74 mph (64 kts) | 0 | 1.2 | 29th (tied with 13 other seasons) | 3 (7 seasons) |
| Major Cyclone Winds ≥ 111 mph (96 kts) | 0 | 0.8 (8 in 10 seasons) | 18th (tied with 24 other seasons) | 3 (2014, 2019) |
| Accumulated Cyclone Energy ACE×10⁴ kt² | 0.0 | 18.7 | 40th (tied with 2 other seasons) | 71.2 (1997) |
Australia
| Name |
Maximum CategoryMax Cat |
Dates >39 mph |
Maximum Sustained Winds | Minimum Central Pressure |
|---|---|---|---|---|
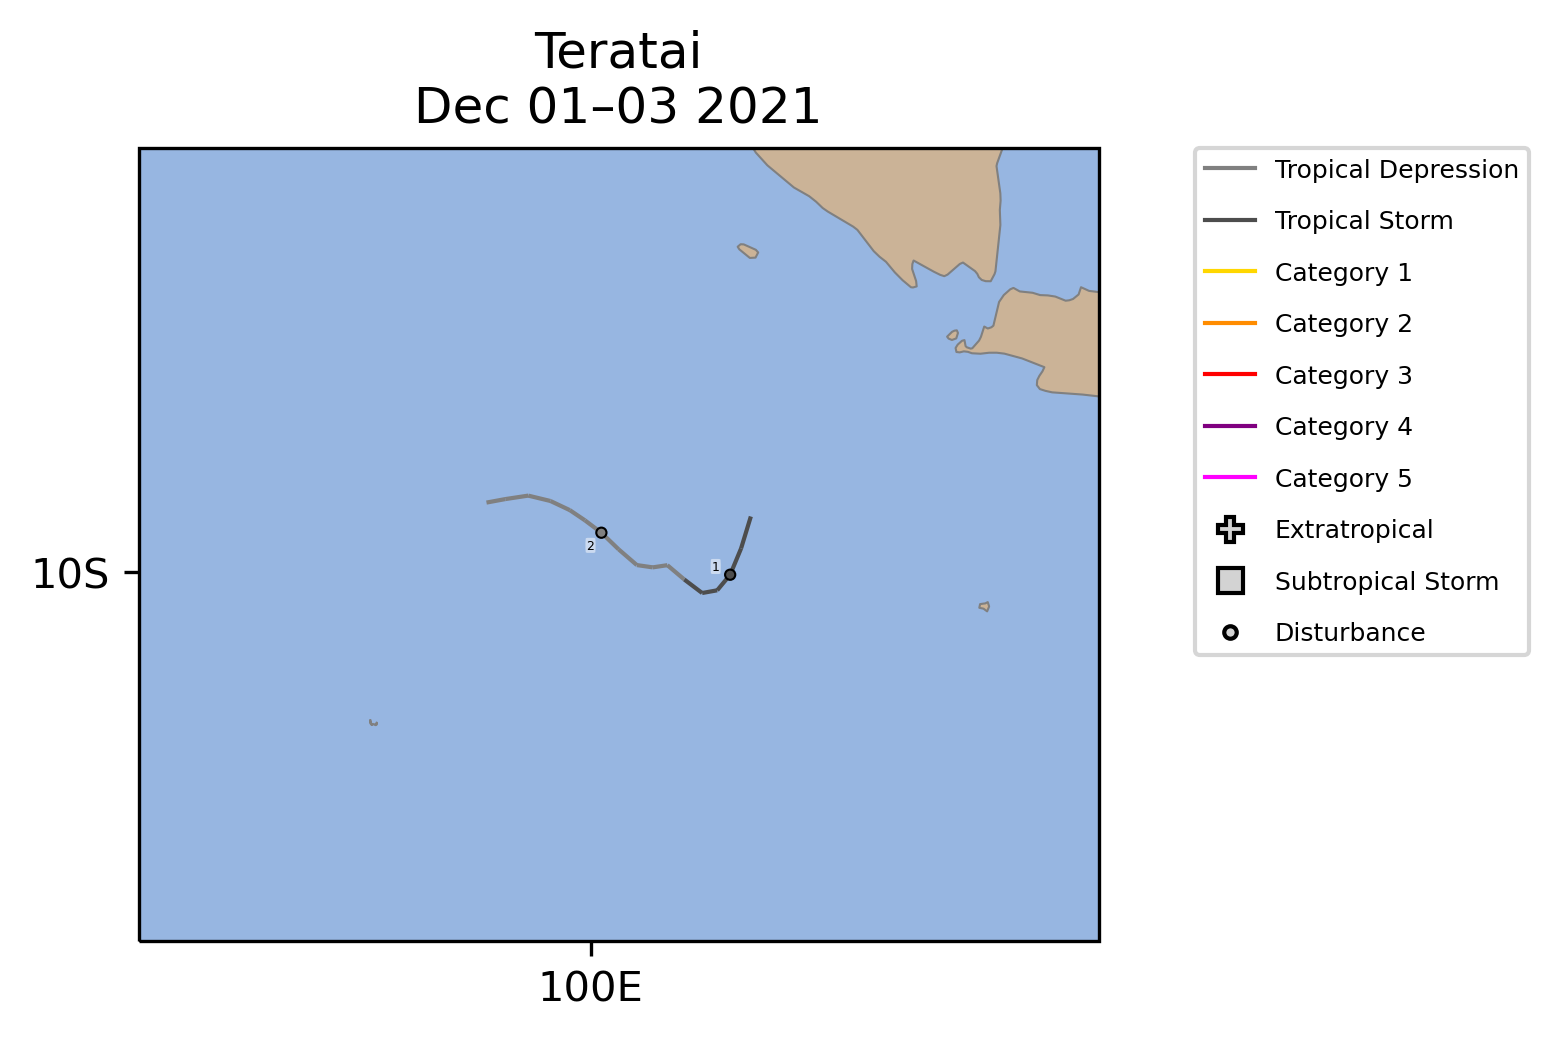 | TS | December 1Dec 1 | 40 mph | 1004 mb |
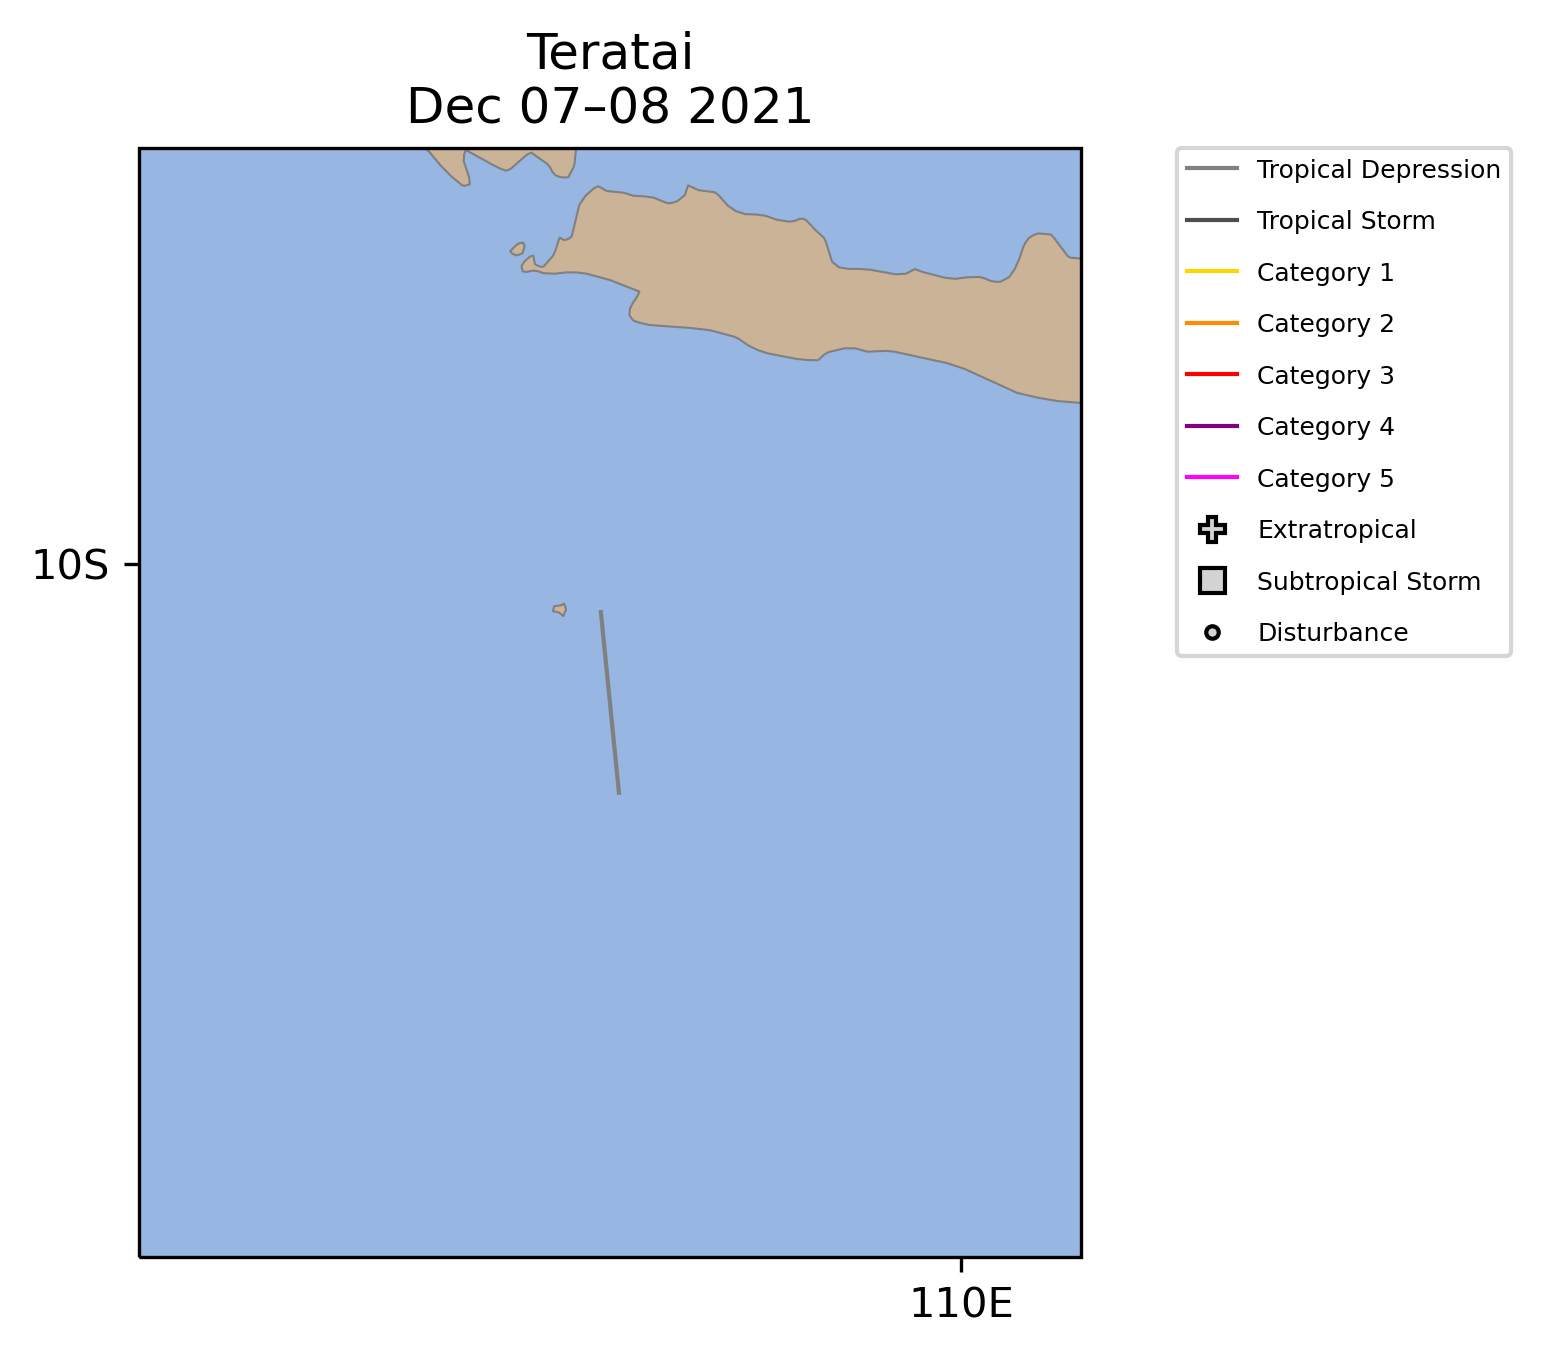 | TS | December 8Dec 8-9 | 40 mph | 999 mb |
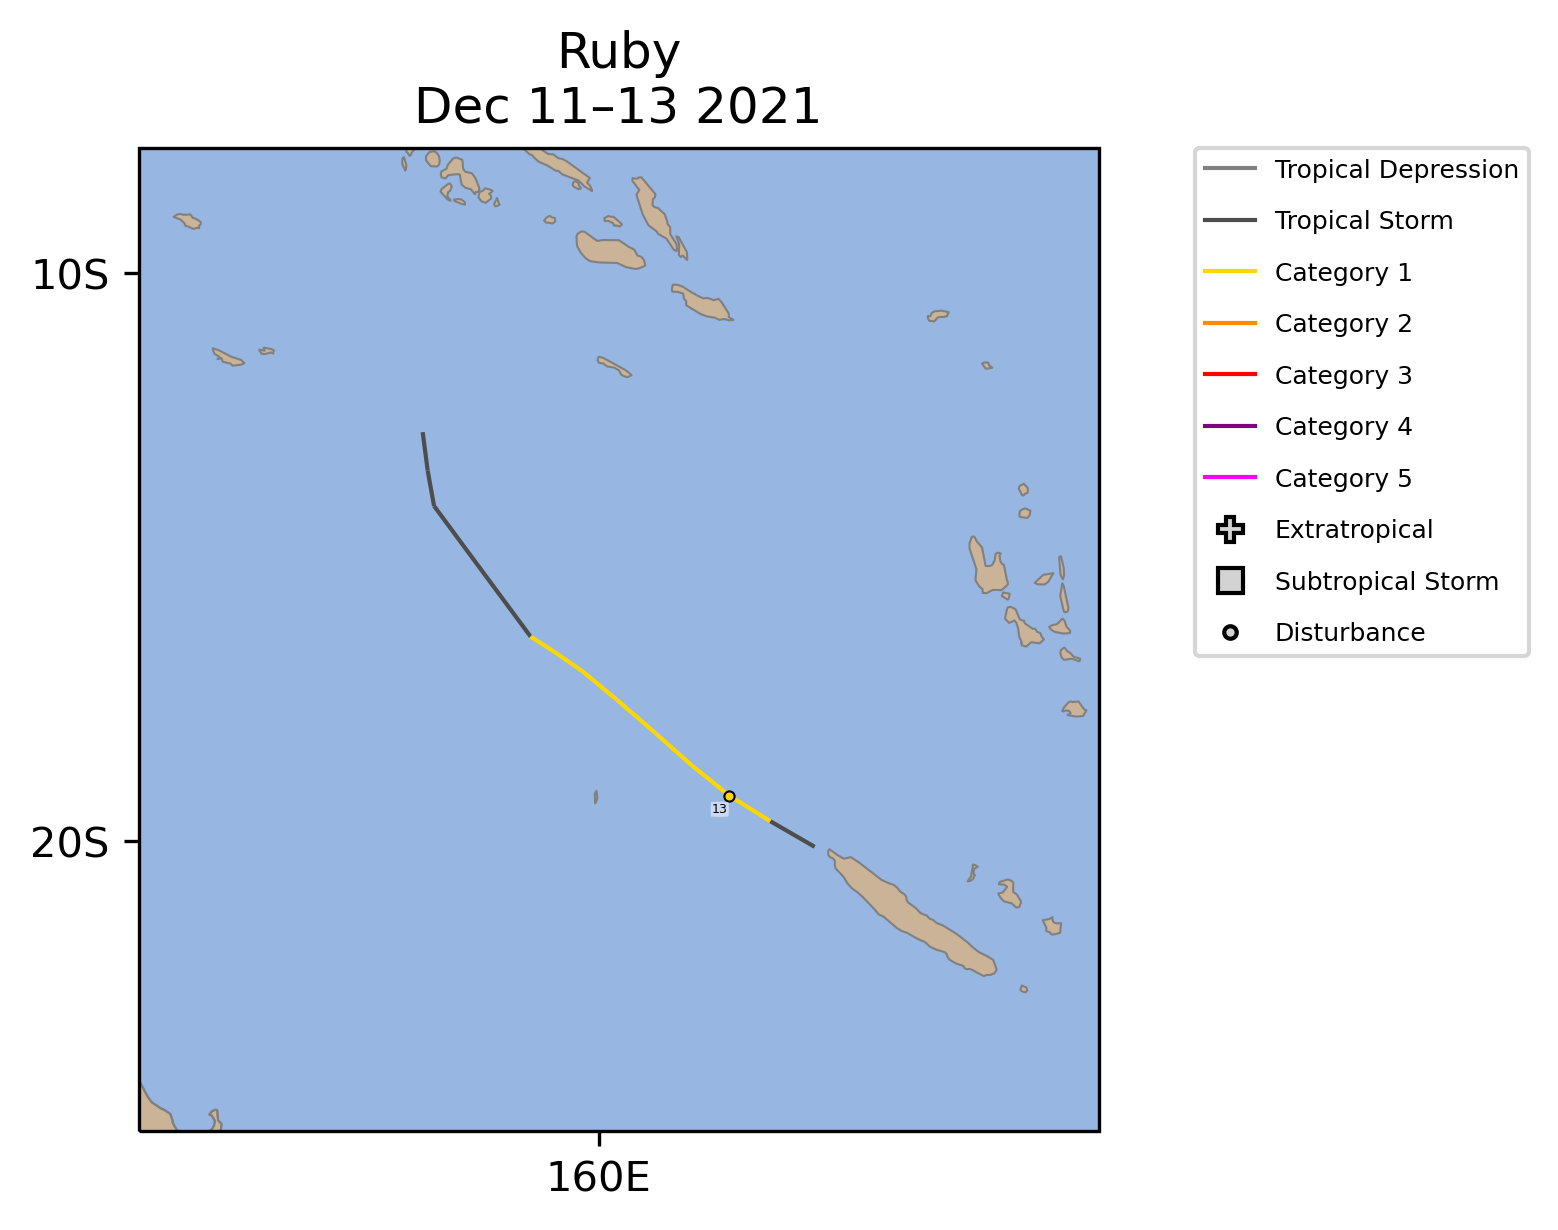 | 1 | December 11Dec 11-14 | 80 mph | 980 mb |
| Storm Type | Count | 1991-2020 Mean |
1981-2021 Rank* |
1956-2021 Record |
|---|---|---|---|---|
| Tropical Storm Winds ≥ 39 mph (34 kts) | 3 | 1.5 | 3rd (tied with 3 other Decembers) | 4 (1985, 1997) |
| Tropical Cyclone Winds ≥ 74 mph (64 kts) | 1 | 0.8 (8 in 10 Decembers) | 7th (tied with 16 other Decembers) | 2 (7 Decembers) |
| Major Tropical Cyclone Winds ≥ 111 mph (96 kts) | 0 | 0.4 (4 in 10 Decembers) | 11th (tied with 31 other Decembers) | 2 (2014) |
| Accumulated Cyclone Energy ACE×10⁴ kt² | 1.8 | 8.8 | 27th | 33.7 (1999) |
| Storm Type | Count | 1991-2020 Mean |
1981-2021 Rank* |
1956-2021 Record |
|---|---|---|---|---|
| Tropical Storm Winds ≥ 39 mph (34 kts) | 4 | 2.3 | 5th (tied with 4 other seasons) | 7 (1997) |
| Tropical Cyclone Winds ≥ 74 mph (64 kts) | 1 | 1.0 (10 in 10 seasons) | 9th (tied with 18 other seasons) | 3 (1996, 1999) |
| Major Tropical Cyclone Winds ≥ 111 mph (96 kts) | 0 | 0.4 (4 in 10 seasons) | 12th (tied with 30 other seasons) | 2 (2014) |
| Accumulated Cyclone Energy ACE×10⁴ kt² | 3.1 | 10.5 | 29th | 42.6 (1999) |
Southwest Pacific
| Name |
Maximum CategoryMax Cat |
Dates >39 mph |
Maximum Sustained Winds | Minimum Central Pressure |
|---|---|---|---|---|
| 1 | December 11Dec 11-14 | 80 mph† | 980 mb† |
| †Value occurred in the Southwest Pacific | ||||
| Storm Type | Count | 1991-2020 Mean |
1981-2021 Rank* |
1956-2021 Record |
|---|---|---|---|---|
| Tropical Storm Winds ≥ 39 mph (34 kts) | 1 | 0.7 (7 in 10 Decembers) | 9th (tied with 13 other Decembers) | 3 (6 Decembers) |
| Tropical Cyclone Winds ≥ 74 mph (64 kts) | 1 | 0.5 (5 in 10 Decembers) | 5th (tied with 10 other Decembers) | 2 (1987, 1992, 1993, 2013) |
| Major Tropical Cyclone Winds ≥ 111 mph (96 kts) | 0 | 0.3 (3 in 10 Decembers) | 8th (tied with 34 other Decembers) | 2 (1992, 1993, 2013) |
| Accumulated Cyclone Energy ACE×10⁴ kt² | 1.5 | 6.9 | 17th | 46.9 (1992) |
| Storm Type | Count | 1991-2020 Mean |
1981-2021 Rank* |
1956-2021 Record |
|---|---|---|---|---|
| Tropical Storm Winds ≥ 39 mph (34 kts) | 1 | 1.3 | 17th (tied with 8 other seasons) | 6 (1998) |
| Tropical Cyclone Winds ≥ 74 mph (64 kts) | 1 | 0.8 (8 in 10 seasons) | 8th (tied with 10 other seasons) | 4 (1998) |
| Major Tropical Cyclone Winds ≥ 111 mph (96 kts) | 0 | 0.4 (4 in 10 seasons) | 11th (tied with 31 other seasons) | 2 (1992, 1993, 2013) |
| Accumulated Cyclone Energy ACE×10⁴ kt² | 1.5 | 9.5 | 20th | 58.7 (1992) |
Global
| Name |
Maximum CategoryMax Cat |
Dates >39 mph |
Maximum Sustained Winds | Minimum Central Pressure |
|---|---|---|---|---|
| 4 | November 29-December 4Nov 29-Dec 4 | 145 mph | 933 mb |
| TS | December 1Dec 1 | 40 mph | 1004 mb |
| TS | December 3Dec 3-4 | 40 mph | 997 mb |
| TS | December 8Dec 8-9 | 40 mph | 999 mb |
| 1 | December 11Dec 11-14 | 80 mph | 980 mb |
| 5 | December 13Dec 13-20 | 165 mph | 915 mb |
| Storm Type | Count | 1991-2020 Mean |
1981-2021 Rank* |
1972-2021 Record |
|---|---|---|---|---|
| Tropical Storm Winds ≥ 39 mph (34 kts) | 6 | 6.1 | 17th (tied with 9 other Decembers) | 10 (1984, 1996, 1998) |
| Tropical Cyclone Winds ≥ 74 mph (64 kts) | 3 | 3.1 | 14th (tied with 9 other Decembers) | 6 (1991, 1993, 1998, 2019) |
| Major Tropical Cyclone Winds ≥ 111 mph (96 kts) | 2 | 1.6 | 6th (tied with 10 other Decembers) | 4 (1991, 2012, 2013, 2019) |
| Accumulated Cyclone Energy ACE×10⁴ kt² | 37.9 | 44.3 | 21st | 88.7 (2012) |
| Storm Type | Count | 1991-2020 Mean |
1981-2021 Rank* |
1972-2021 Record |
|---|---|---|---|---|
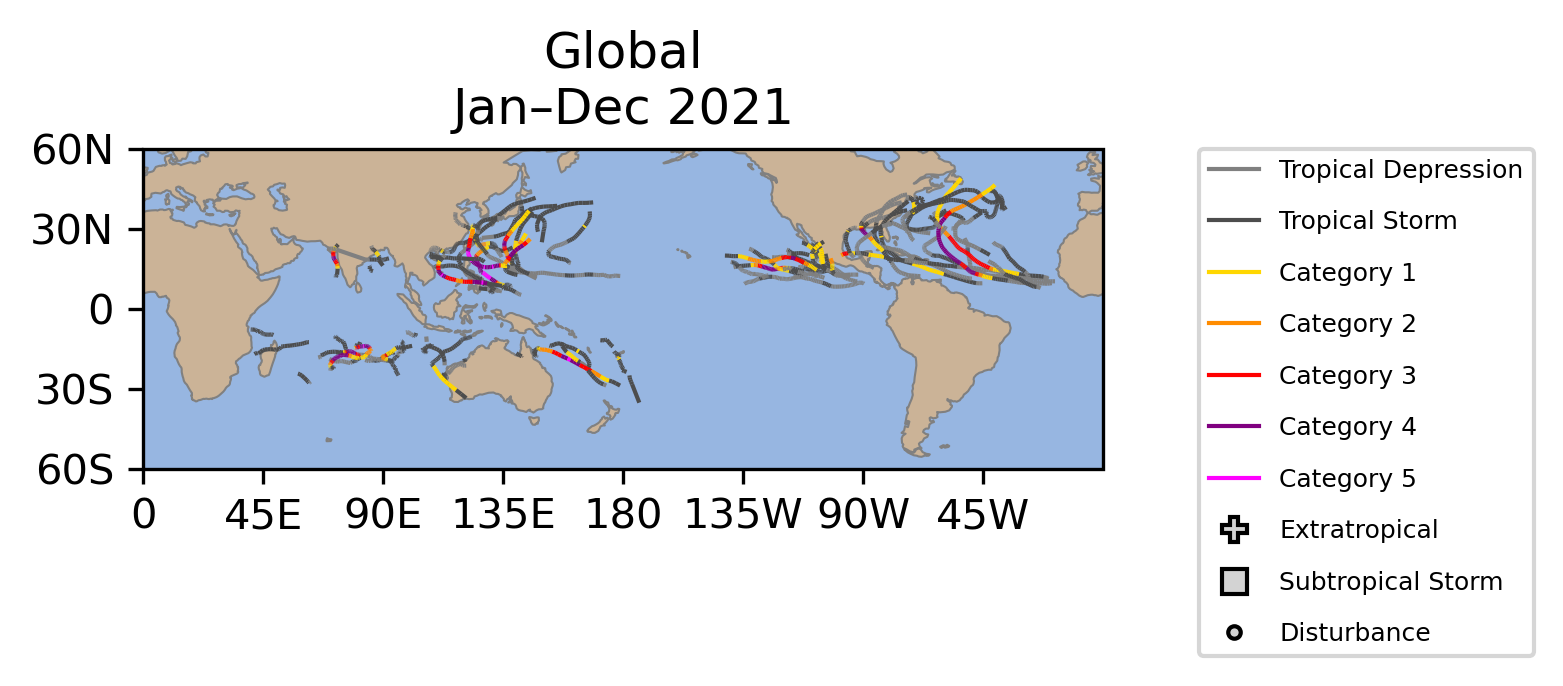
| Tropical Storm Winds ≥ 39 mph (34 kts) | 94 | 88.2 | 10th (tied with 1 other season) | 106 (2020) |
| Tropical Cyclone Winds ≥ 74 mph (64 kts) | 37 | 48.1 | 41st | 59 (1990, 1992, 2018) |
| Major Tropical Cyclone Winds ≥ 111 mph (96 kts) | 16 | 25.7 | 39th (tied with 1 other season) | 39 (2015) |
| Accumulated Cyclone Energy ACE×10⁴ kt² | 614.4 | 789.0 | 33rd | 1,163.1 (1992) |
Data Description
The data in this report are derived from NCEI's IBTrACS dataset (Knapp et al. 2010; Schreck et al. 2014). IBTrACS tropical cyclone track and intensity data from agencies and sources around the globe. In this report, data from NOAA's National Hurricane Center (NHC) are used for the North Atlantic and East Pacific. The other basins use data from the U.S. Military's Joint Typhoon Warning Center (JTWC).
Historical values use the "best track" data that have been analyzed by forecasters after the season using all available data. Operational procedures and observing systems have changed with time and between regions, which makes these data heterogeneous. Intensity data are generally the most reliable since the early 1970s in the Atlantic (Landsea and Franklin 2013) and since the mid-1980s in other regions (Chu et al. 2002). The number of short-lived storms (≤2 days) has also increased since around 2000 due to improvements in observations and analysis techniques (Landsea et al. 2010).
Values for the current year are provisional values from the operational forecast advisories. IBTrACS obtains these from NCEP's TC Vitals, the NCAR Tropical Cyclone Guidance Project, and NHC provisional data. These values are subject to change during the post-season best track analysis. They also only include 6-hourly storm fixes, which means they may miss special advisories at landfall, peak intensity, etc.
The tropical cyclone seasons in the Southern Hemisphere begin in July and end in June, while the Northern Hemisphere seasons are counted from January to December. Storms are counted in all basins, months, and years in which they occur, which means some storms may appear more than once. However, the global totals only include each storm one time.
References
- Chu, J.-H., C. R. Sampson, A. S. Levine, and E. Fukada, 2002: The joint typhoon warning center tropical cyclone best-tracks, 1945–2000. Naval Research Laboratory, Reference Number NRL/MR/7540-02-16, 22 pp., https://www.metoc.navy.mil/jtwc/products/best-tracks/tc-bt-report.html.
- Knapp, K. R., M. C. Kruk, D. H. Levinson, H. J. Diamond, and C. J. Neumann, 2010: The International Best Track Archive for Climate Stewardship (IBTrACS). Bull. Amer. Meteor. Soc., 91, 363–376, https://doi.org/10.1175/2009BAMS2755.1.
- Landsea, C. W., and J. L. Franklin, 2013: Atlantic Hurricane database uncertainty and presentation of a new database format. Mon. Wea. Rev., 141, 3576–3592, https://doi.org/10.1175/MWR-D-12-00254.1.
- ——, G. A. Vecchi, L. Bengtsson, and T. R. Knutson, 2010: Impact of duration thresholds on Atlantic tropical cyclone counts. J. Climate, 23, 2508–2519, https://doi.org/10.1175/2009JCLI3034.1.
- Schreck, C. J., K. R. Knapp, and J. P. Kossin, 2014: The Impact of Best Track Discrepancies on Global Tropical Cyclone Climatologies using IBTrACS. Mon. Wea. Rev., 142, 3881–3899, https://doi.org/10.1175/MWR-D-14-00021.1.