Note: This report catalogs recent tropical cyclones across the North Atlantic and East Pacific and places each basin’s tropical cyclone activity in a climate-scale context. It is not updated in real time. Users seeking the real time status and forecasts of tropical cyclones should visit The National Hurricane Center.
Significant Events
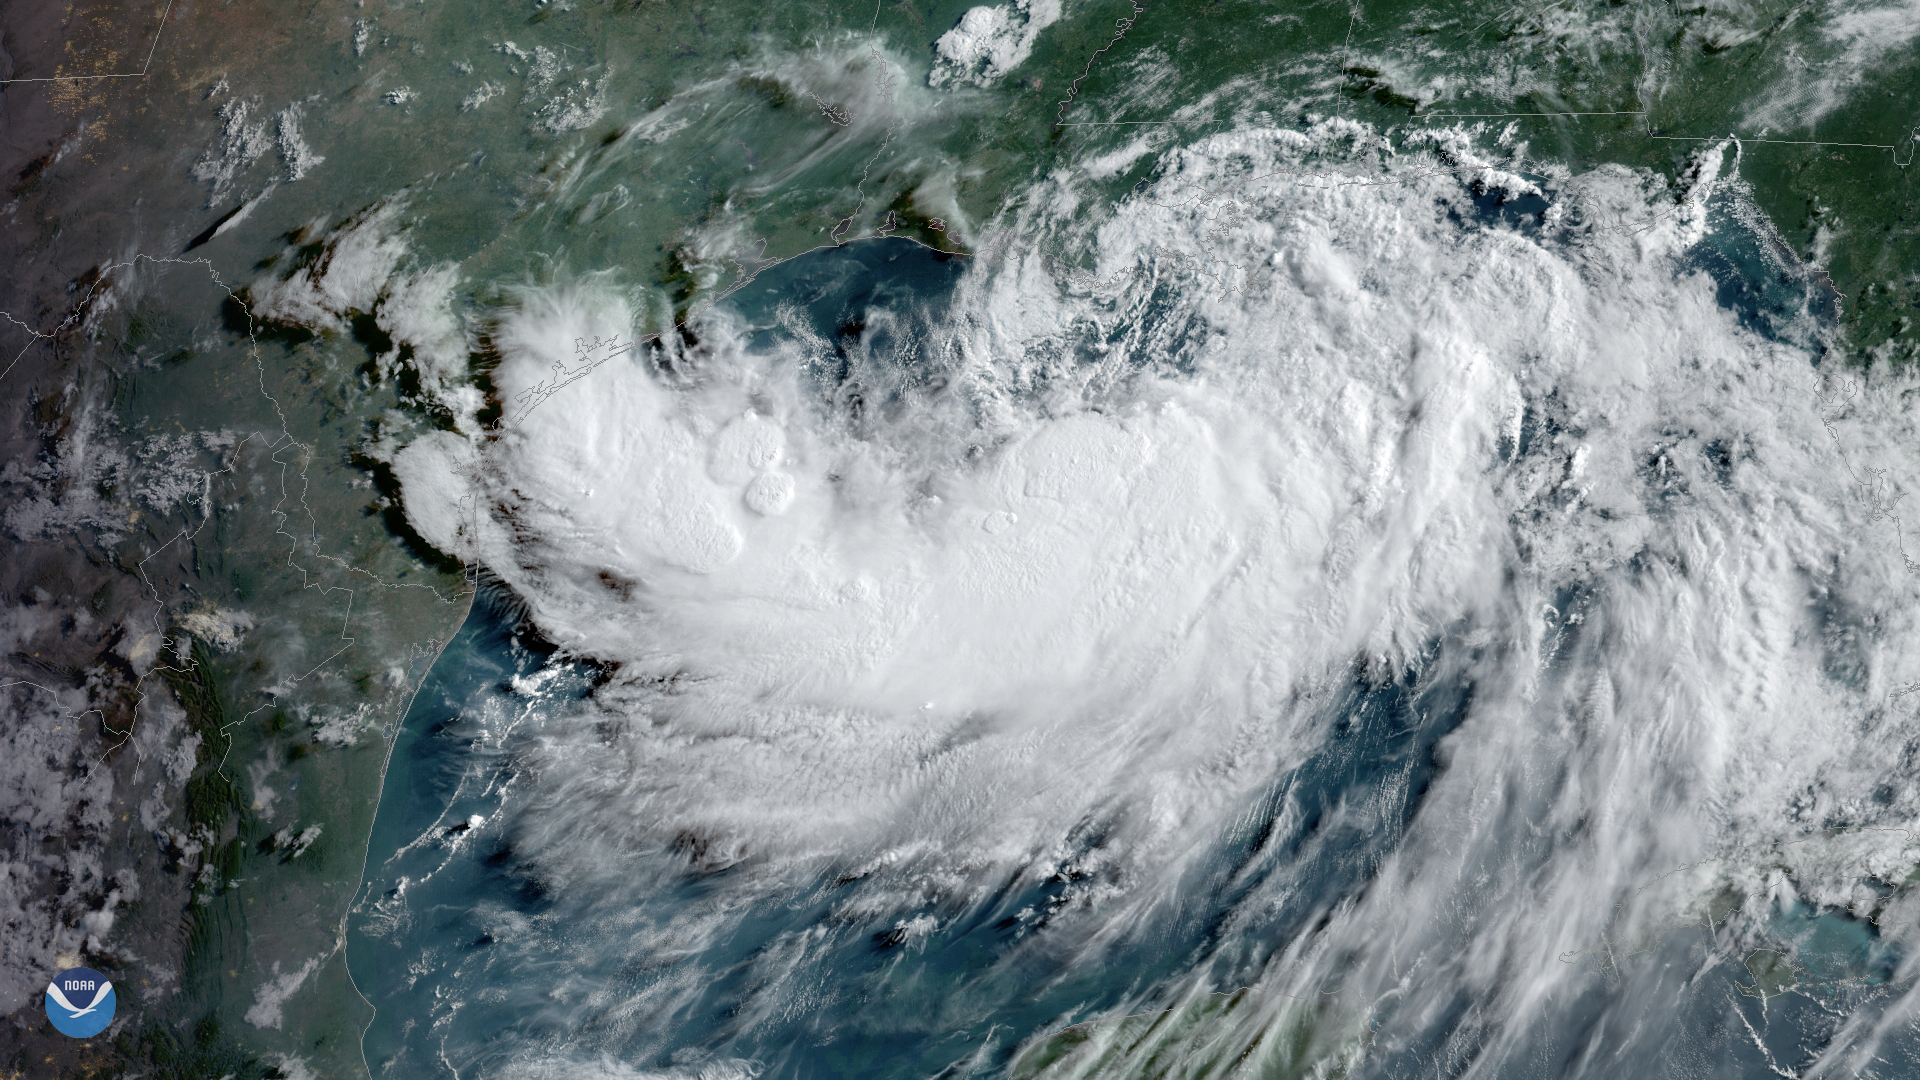
Hurricane Barry became the first hurricane of the 2019 Atlantic season and also the first to make landfall in the U.S. Barry's circulation broke off the end of a stationary front. The initial disturbance formed over land before meandering to the Gulf of Mexico. Strong vertical shear limited how much it could develop while over the Gulf, but it did achieve hurricane status just as it was making landfall. Despite the relatively weak winds, Barry's slow movement led to flash flooding in Louisiana and Arkansas, including a new statewide record for rain from a tropical cyclone–16.59" in Dierks, AR. As Barry's remnants moved northeastward, it brought hot tropical air with it that exacerbated the ongoing heatwave along the East Coast.
| Name | Dates of winds >39 mph |
Maximum Sustained Winds |
Minimum Central Pressure |
Landfall |
|---|---|---|---|---|
| Hurricane Barry (Cat. 1) |
July 11–17 | 75 mph | 993 mb | Intracoastal City, LA |
| Name | Dates of winds >39 mph |
Maximum Sustained Winds |
Minimum Central Pressure |
Landfall |
|---|---|---|---|---|
| Hurricane Barbara (Cat. 4) |
June 30–July 8 | 155 mph | 993 mb | N/A |
| Tropical Storm Cosme | July 6–7 | 52 mph | 1001 mb | N/A |
| Tropical Storm Dalila | July 23–24 | 46 mph | 1005 mb | N/A |
| Hurricane Erick (Cat. 4) |
July 27–August 3 | 132 mph | 952 mb | N/A |
| Hurricane Flossie (Cat. 1) |
July 29–August 4 | 81 mph | 990 mb | N/A |
North Atlantic
| Storm Type | July 2019 | July 1981–2010 Average |
Record Most for July Period of Record: 1851–2018 |
|---|---|---|---|
| Tropical Storm (Winds ≥39 mph) |
1 | 1.1 | 5 (2005) |
| Hurricane (Winds ≥74 mph) |
1 | 0.5 (one every other year) |
3 (1916, 1966, 2005) |
| Major Hurricane (Winds ≥111 mph) |
0 | 0.1 (one every ten years) |
2 (1916, 2005) |
| Accumulated Cyclone Energy (ACE ×104 kt2) |
3.2 | 6.1 | 60.3 (2005) |
| Storm Type | January–July 2019 |
January–July 1981–2010 Average |
Record Most for January–July Period of Record: 1851–2018 |
|---|---|---|---|
| Tropical Storm (Winds ≥39 mph) |
2 | 1.9 | 7 (2005) |
| Hurricane (Winds ≥74 mph) |
1 | 0.6 (one every other year) |
4 (1886, 1966) |
| Major Hurricane (Winds ≥111 mph) |
0 | 0.1 (one every ten years) |
2 (1916, 2005) |
| Accumulated Cyclone Energy (ACE ×104 kt2) |
3.5 | 7.6 | 63.2 (2005) |
East Pacific
| Storm Type | July 2019 | July 1981–2010 Average |
Record Most for July Period of Record: 1949–2018 |
|---|---|---|---|
| Tropical Storm (Winds ≥39 mph) |
4 | 3.6 | 7 (1985, 2015, 2016) |
| Hurricane (Winds ≥74 mph) |
3 | 1.9 | 3 (2016) |
| Major Hurricane (Winds ≥111 mph) |
2 | 0.9 | 3 (1978, 1985, 1992, 2016) |
| Accumulated Cyclone Energy (ACE ×104 kt2) |
34.2 | 27.6 | 100.4 (1978) |
| Storm Type | January–July 2019 |
January–July 1981–2010 Average |
Record Most for January–July Period of Record: 1949–2018 |
|---|---|---|---|
| Tropical Storm (Winds ≥39 mph) |
6 | 6.3 | 125 (1985) |
| Hurricane (Winds ≥74 mph) |
4 | 3.1 | 7 (1990) |
| Major Hurricane (Winds ≥111 mph) |
2 | 1.4 | 5 (1978, 1992) |
| Accumulated Cyclone Energy (ACE ×104 kt2) |
37.4 | 41.7 | 128.9 (1978) |