East North Pacific Basin
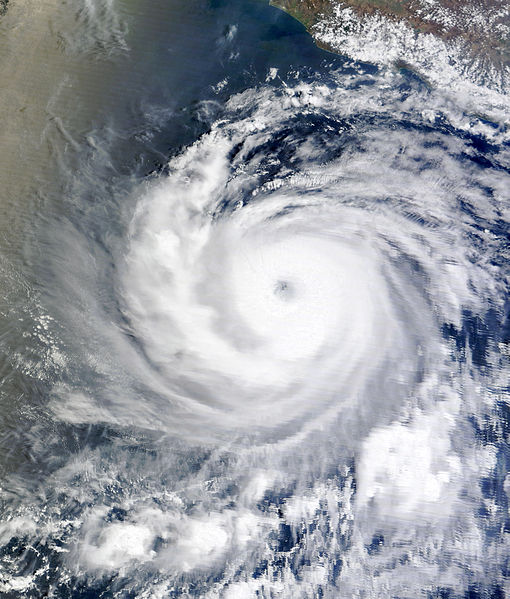 Tropical Storm Adrian Satellite Image |
 Tropical Storm Adrian Forecast Track  Saffir-Simpson Scale Color Legend |
| Tropical Cyclone | Adrian | ||||||||
| Cyclogenesis Date | 06/08 | ||||||||
| Cyclolysis Date | 06/12 | ||||||||
| Highest Saffir-Simpson Category | Cat 4 | ||||||||
| Maximum 6-hr Sustained Wind | 138 mph (120 kt or 222 km/h) | ||||||||
| Min Pressure | 946 mbar | ||||||||
| Accumulated Cyclone Energy (ACE*) Index (kt2) | 11.9075 x 10⁴ | ||||||||
| Landfall Information (date, location and sustained winds) | |||||||||
| Deaths | 0 | ||||||||
| *The (ACE) Index calculations are based on preliminary data. | |||||||||
 Tropical Storm Beatriz Satellite Image |
 Tropical Storm Beatriz Forecast Track Saffir-Simpson Scale Color Legend |
| Tropical Cyclone | Beatriz | ||||||||
| Cyclogenesis Date | 06/19 | ||||||||
| Cyclolysis Date | 06/21 | ||||||||
| Highest Saffir-Simpson Category | Cat 1 | ||||||||
| Maximum 6-hr Sustained Wind | 86 mph (75 kt or 139 km/h) | ||||||||
| Min Pressure | 977 mbar | ||||||||
| Accumulated Cyclone Energy (ACE*) Index (kt2) | 2.9100 x 10⁴ | ||||||||
| Landfall Information (date, location and sustained winds) | |||||||||
| Deaths | 3 | ||||||||
| *The (ACE) Index calculations are based on preliminary data. | |||||||||
West North Pacific Basin
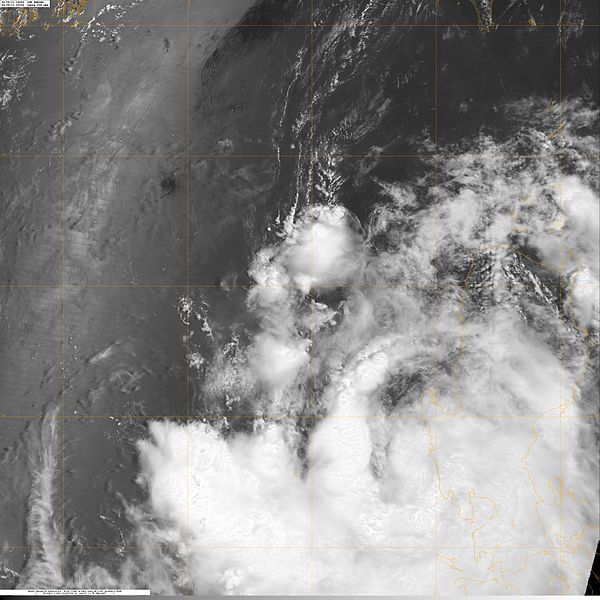 Tropical Storm Sarika Satellite Image |
 Tropical Storm Sarika Forecast Track Saffir-Simpson Scale Color Legend |
| Tropical Cyclone | Sarika (Dodong) | ||||||||
| Cyclogenesis Date | 06/09 | ||||||||
| Cyclolysis Date | 06/10 | ||||||||
| Highest Saffir-Simpson Category | TS | ||||||||
| Maximum 6-hr Sustained Wind | 40 mph (35 kt or 65 km/h) | ||||||||
| Min Pressure | 996 mbar | ||||||||
| Accumulated Cyclone Energy (ACE*) Index (kt2) | .4900 x 104 | ||||||||
| Landfall Information (date, location and sustained winds) | |||||||||
| Deaths | 0 | ||||||||
| *The (ACE) Index calculations are based on preliminary data. | |||||||||
 Tropical Storm Egay Satellite Image |
 Tropical Storm Egay Forecast Track Saffir-Simpson Scale Color Legend |
| Tropical Cyclone | Haima (Egay) | ||||||||
| Cyclogenesis Date | 06/18 | ||||||||
| Cyclolysis Date | 06/24 | ||||||||
| Highest Saffir-Simpson Category | TS | ||||||||
| Maximum 6-hr Sustained Wind | 40 mph (35 kt or 65 km/h) | ||||||||
| Min Pressure | 990 mbar | ||||||||
| Accumulated Cyclone Energy (ACE*) Index (kt2) | 1.4700 x 10⁴ | ||||||||
| Landfall Information (date, location and sustained winds) | |||||||||
| Deaths | 0 | ||||||||
| *The (ACE) Index calculations are based on preliminary data. | |||||||||
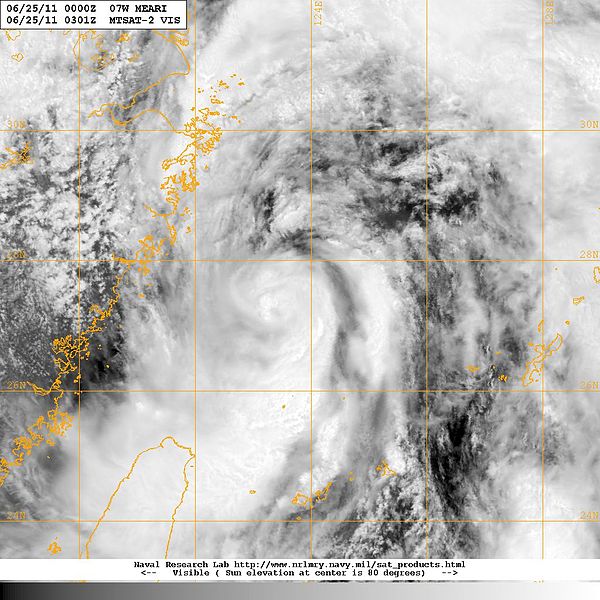 Tropical Storm Meari Satellite Image |
 Tropical Storm Meari Forecast Track Saffir-Simpson Scale Color Legend |
| Tropical Cyclone | Meari (Falcon) | ||||||||
| Cyclogenesis Date | 06/22 | ||||||||
| Cyclolysis Date | 06/26 | ||||||||
| Highest Saffir-Simpson Category | TS | ||||||||
| Maximum 6-hr Sustained Wind | 69 mph (60 kt or 111 km/h) | ||||||||
| Min Pressure | 970 mbar | ||||||||
| Accumulated Cyclone Energy (ACE*) Index (kt2) | 3.6500 x 10⁴ | ||||||||
| Landfall Information (date, location and sustained winds) | |||||||||
| Deaths | 11 | ||||||||
| *The (ACE) Index calculations are based on preliminary data. | |||||||||
Atlantic Basin
Tropical Storm Arlene was the first tropical cyclone for the Atlantic basin during the 2011 hurricane season. Arlene formed into a tropical storm late on June 28th over the Bay of Campeche, and slowly moved westward, making landfall near Tampico in northeastern Mexico. Arlene is now the most recycled tropical cyclone name in the Atlantic, having been used nine other times (1959, 1963, 1967, 1971, 1981, 1987, 1993, 1999, and 2005). On average, the Atlantic basin experiences a June tropical cyclone once every two years. At its strongest, Arlene had sustained winds of 65 mph (105 km/hr) and a central pressure of 993 mb. Arlene made landfall late in the day on June 30th, at its strongest point. According to satellite estimates, approximately 10 inches (254 mm) of rain fell over the mountainous region of Mexico, creating flash floods and mudslides. Media reports claim that 22 people were killed. The region had been experiencing extreme drought for several months, making the soil more prone to runoff and flash flooding.
 Tropical Storm Arlene Satellite Image |
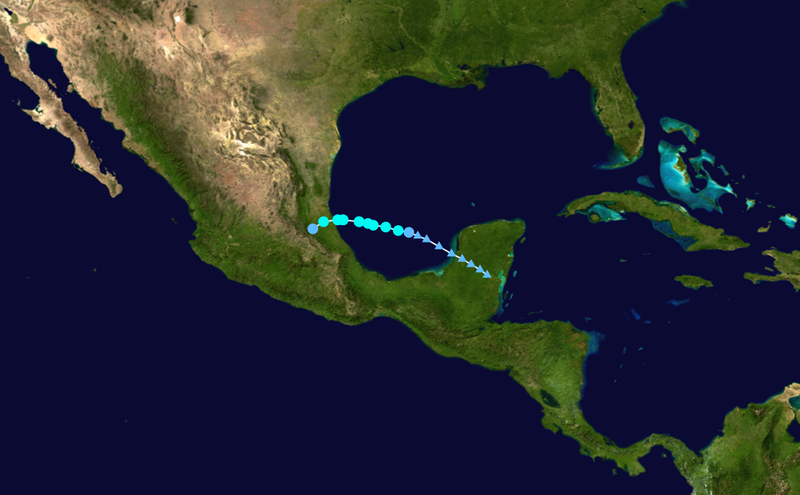 Tropical Storm Arlene Forecast Track Saffir-Simpson Scale Color Legend |
| Tropical Cyclone | Arlene | ||||||||
| Cyclogenesis Date | 06/29 | ||||||||
| Cyclolysis Date | 06/30 | ||||||||
| Highest Saffir-Simpson Category | TS | ||||||||
| Maximum 6-hr Sustained Wind | 75 mph (65 kt or 120 km/h) | ||||||||
| Min Pressure | 993 mbar | ||||||||
| Accumulated Cyclone Energy (ACE*) Index (kt2) | 1.7850 x 10⁴ | ||||||||
| Landfall Information (date, location and sustained winds) | 06/30 - Eastern coast of Mexico (65 kt or 120 km/h) | ||||||||
| Deaths | 0 | ||||||||
| *The (ACE) Index calculations are based on preliminary data. | |||||||||