Atlantic Basin
 Tropical Storm Colin Satellite Image |
 Tropical Storm Colin Forecast Track  Saffir-Simpson Scale Color Legend |
| Tropical Cyclone | Colin | ||||||||
| Cyclogenesis Date | 08/03 | ||||||||
| Cyclolysis Date | 08/07 | ||||||||
| Highest Saffir-Simpson Category | TS | ||||||||
| Maximum 6-hr Sustained Wind | 58 mph (50 kt or 93 km/h) | ||||||||
| Min Pressure | 1006 mbar | ||||||||
| Accumulated Cyclone Energy (ACE*) Index (kt2) | 2.2506 x 10⁴ | ||||||||
| Landfall Information (date, location and sustained winds) | N/A | ||||||||
| Deaths | 0 | ||||||||
| *The (ACE) Index calculations are based on preliminary data. | |||||||||
Hurricane Danielle was the second hurricane and first major hurricane of the 2010 Atlantic Hurricane Season. The storm first developed as a tropical depression off the Cape Verde Islands on August 21st. The next day the system strengthened into a tropical storm and was named Danielle. By the 23rd the storm stregthened into a hurricane. Between the 23rd and 26th Danielle fluctuated between Category 1 and Category 2 strength. On the 27th, Danielle moved into an environment with warmer sea surface temperatures and lower atmospheric wind shear. Danielle quickly strengthened into a Category 4 hurricane with maximum sustained winds of 132 mph (212 km/hr) and a central minimum pressure of 942 mbar. At its peak intensity, Danielle began moving northwardly and eventually northeasterly, passing a few hundred miles east of Bermuda. Danielle began to weaken, and by the 31st Danielle became extra-tropical without having directly impacted any landmass. However, two deaths on the U.S. east coast were blamed on the violent rip currents caused by Danielle.
 Tropical Storm Danielle Satellite Image |
 Tropical Storm Danielle Forecast Track Saffir-Simpson Scale Color Legend |
| Tropical Cyclone | Danielle | ||||||||
| Cyclogenesis Date | 08/22 | ||||||||
| Cyclolysis Date | 08/30 | ||||||||
| Highest Saffir-Simpson Category | Cat 4 | ||||||||
| Maximum 6-hr Sustained Wind | 132 mph (115 kt or 212 km/h) | ||||||||
| Min Pressure | 942 mbar | ||||||||
| Accumulated Cyclone Energy (ACE*) Index (kt2) | 21.7925 x 10⁴ | ||||||||
| Landfall Information (date, location and sustained winds) | N/A | ||||||||
| Deaths | 2 | ||||||||
| *The (ACE) Index calculations are based on preliminary data. | |||||||||
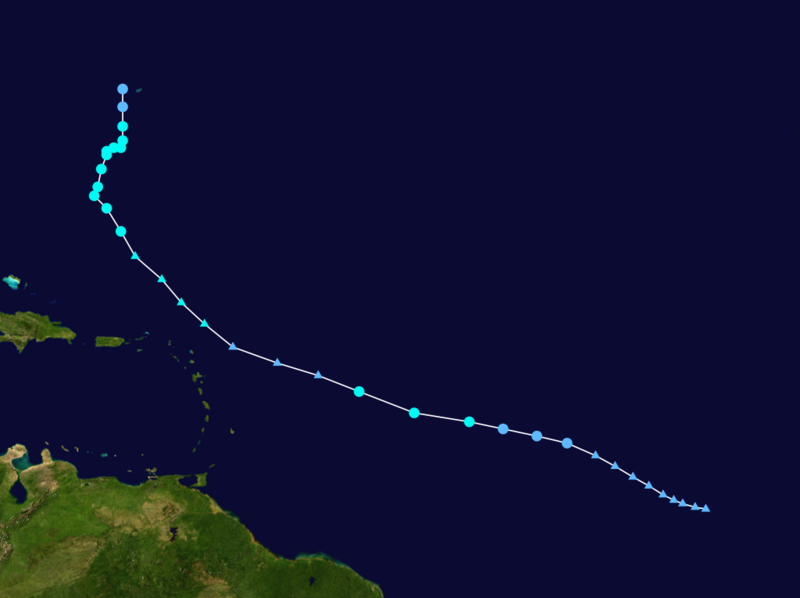
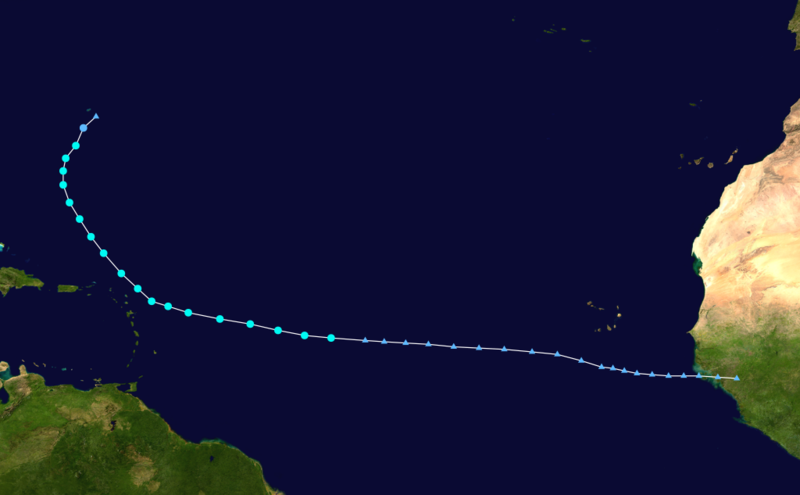
Earl formed off the west coast of Africa as a tropical depression and soon developed into a tropical storm on August 25th. Earl was later classified as a major hurricane, reaching Category 4 status on August 31st. The storm reached its peak on September 2nd with maximum sustained winds of 145 mph (233 km/hr). This was the strongest Atlantic hurricane since 2007. The storm's path took Earl over the Bahamas and eastern Caribbean, nearing the Outer Banks of North Carolina and moving northeastward, parallel to the eastern U.S. seaboard. However, the storm remained a few hundred miles offshore, passing near southern New England. Earl weakened and eventually made landfall as a tropical storm on September 4th in Nova Scotia, Canada before dissipating completely over land the next day.
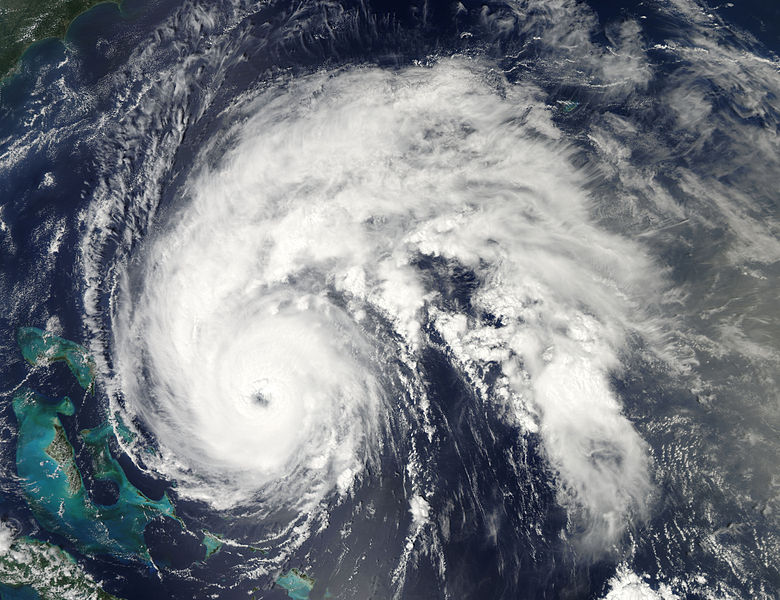 Tropical Storm Earl Satellite Image |
 Tropical Storm Earl Forecast Track Saffir-Simpson Scale Color Legend |
| Tropical Cyclone | Earl | ||||||||
| Cyclogenesis Date | 08/25 | ||||||||
| Cyclolysis Date | 09/05 | ||||||||
| Highest Saffir-Simpson Category | Cat 4 | ||||||||
| Maximum 6-hr Sustained Wind | 144 mph (125 kt or 231 km/h) | ||||||||
| Min Pressure | 928 mbar | ||||||||
| Accumulated Cyclone Energy (ACE*) Index (kt2) | 28.4175 x 10⁴ | ||||||||
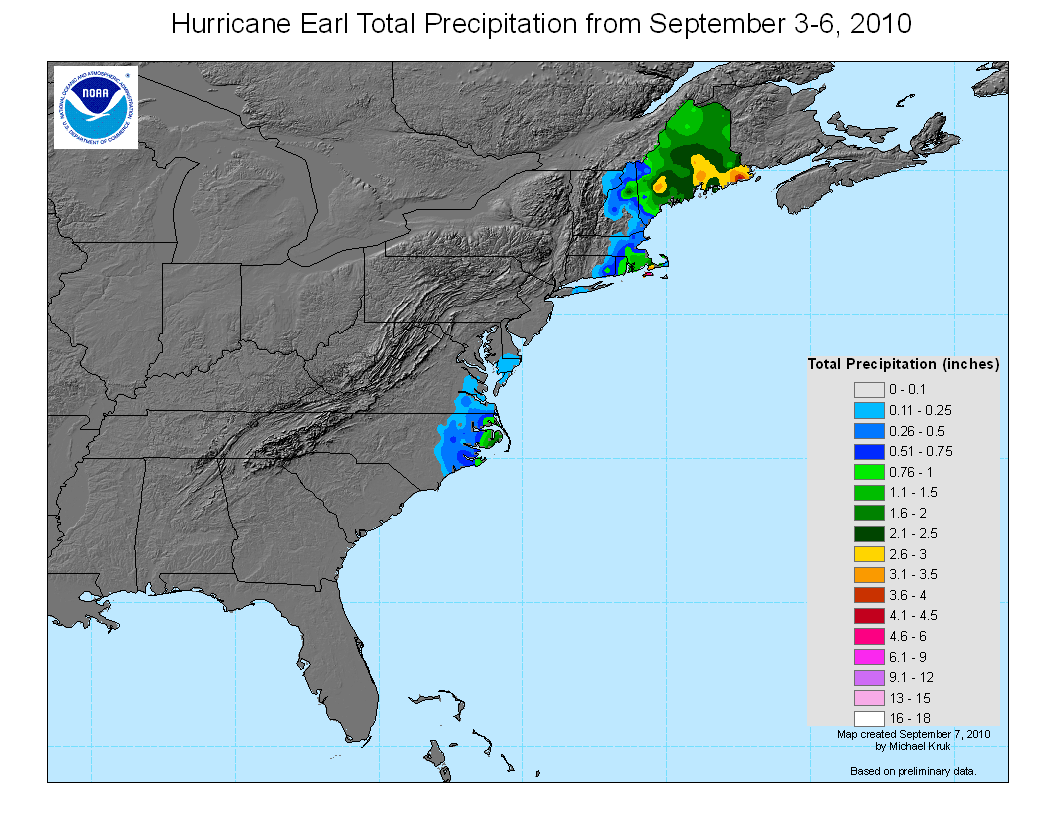
| Landfall Information (date, location and sustained winds) | 09/03–near Western Head, Nova Scotia (60 kt or 113 km/h) 09/04–Charlottetown, Prince Edward Island (60 kt or 113 km/h) 09/03–09/06 Total Precip (map) |
||||||||
| Deaths | 3 | ||||||||
| *The (ACE) Index calculations are based on preliminary data. | |||||||||
 Tropical Storm Fiona Satellite Image |
 Tropical Storm Fiona Forecast Track Saffir-Simpson Scale Color Legend |
| Tropical Cyclone | Fiona | ||||||||
| Cyclogenesis Date | 08/30 | ||||||||
| Cyclolysis Date | 09/03 | ||||||||
| Highest Saffir-Simpson Category | TS | ||||||||
| Maximum 6-hr Sustained Wind | 58 mph (50 kt or 93 km/h) | ||||||||
| Min Pressure | 997 mbar | ||||||||
| Accumulated Cyclone Energy (ACE*) Index (kt2) | 3.0075 x 10⁴ | ||||||||
| Landfall Information (date, location and sustained winds) | N/A | ||||||||
| Deaths | 0 | ||||||||
| *The (ACE) Index calculations are based on preliminary data. | |||||||||
Northeast Pacific Basin
 Tropical Storm Estelle Satellite Image |
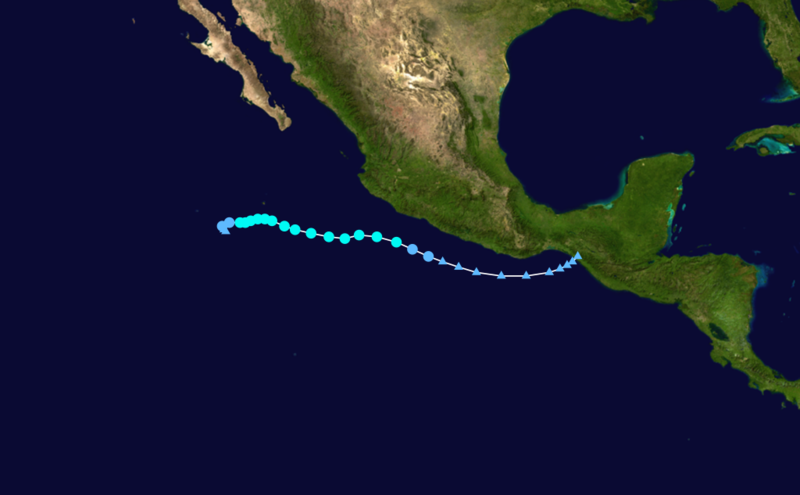 Tropical Storm Estelle Forecast Track Saffir-Simpson Scale Color Legend |
| Tropical Cyclone | Estelle | ||||||||
| Cyclogenesis Date | 08/06 | ||||||||
| Cyclolysis Date | 08/09 | ||||||||
| Highest Saffir-Simpson Category | TS | ||||||||
| Maximum 6-hr Sustained Wind | 63 mph (55 kt or 102 km/h) | ||||||||
| Min Pressure | 994 mbar | ||||||||
| Accumulated Cyclone Energy (ACE*) Index (kt2) | 2.4375 x 10⁴ | ||||||||
| Landfall Information (date, location and sustained winds) | N/A | ||||||||
| Deaths | 0 | ||||||||
| *The (ACE) Index calculations are based on preliminary data. | |||||||||
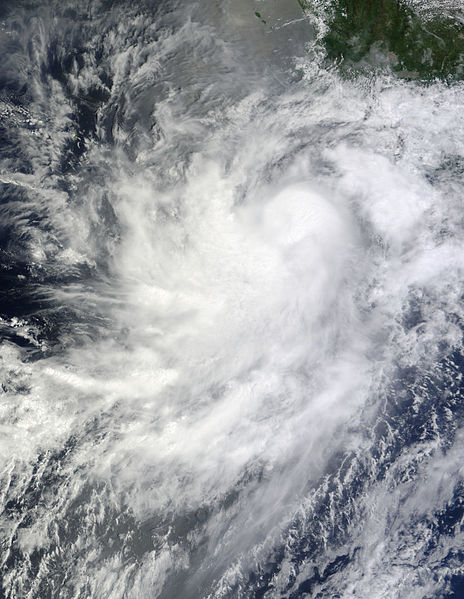 Tropical Storm Frank Satellite Image |
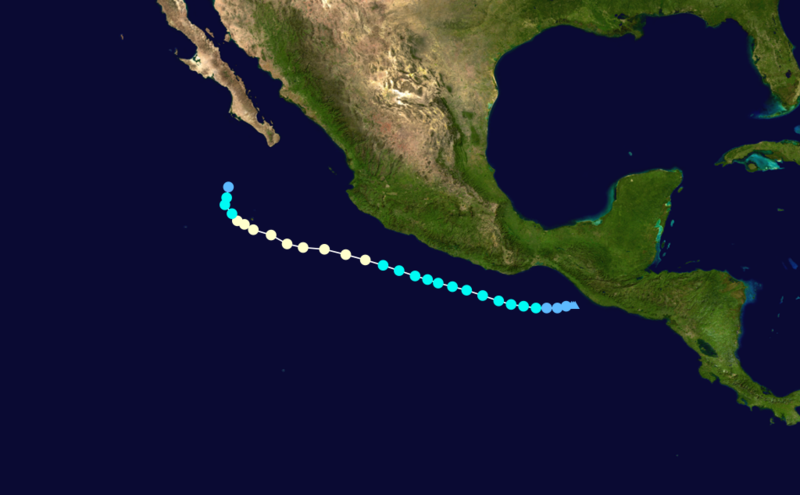 Tropical Storm Frank Forecast Track Saffir-Simpson Scale Color Legend |
| Tropical Cyclone | Frank | ||||||||
| Cyclogenesis Date | 08/22 | ||||||||
| Cyclolysis Date | 08/28 | ||||||||
| Highest Saffir-Simpson Category | TS | ||||||||
| Maximum 6-hr Sustained Wind | 92 mph (80 kt or 148 km/h) | ||||||||
| Min Pressure | 980 mbar | ||||||||
| Accumulated Cyclone Energy (ACE*) Index (kt2) | 8.3125 x 10⁴ | ||||||||
| Landfall Information (date, location and sustained winds) | N/A | ||||||||
| Deaths | 0 | ||||||||
| *The (ACE) Index calculations are based on preliminary data. | |||||||||
Northwest Pacific Basin
 Tropical Storm Dianmu Satellite Image |
 Tropical Storm Dianmu Forecast Track Saffir-Simpson Scale Color Legend |
| Tropical Cyclone | Dianmu | ||||||||
| Cyclogenesis Date | 08/08 | ||||||||
| Cyclolysis Date | 08/11 | ||||||||
| Highest Saffir-Simpson Category | TS | ||||||||
| Maximum 6-hr Sustained Wind | 63 mph (55 kt or 102 km/h) | ||||||||
| Min Pressure | 980 mbar | ||||||||
| Accumulated Cyclone Energy (ACE*) Index (kt2) | 2.3800 x 10⁴ | ||||||||
| Landfall Information (date, location and sustained winds) | N/A | ||||||||
| Deaths | 0 | ||||||||
| *The (ACE) Index calculations are based on preliminary data. | |||||||||
 Tropical Storm Mindulle Satellite Image |
 Tropical Storm Mindulle Forecast Track Saffir-Simpson Scale Color Legend |
| Tropical Cyclone | Mindulle | ||||||||
| Cyclogenesis Date | 08/23 | ||||||||
| Cyclolysis Date | 08/24 | ||||||||
| Highest Saffir-Simpson Category | TS | ||||||||
| Maximum 6-hr Sustained Wind | 69 mph (60 kt or 111 km/h) | ||||||||
| Min Pressure | 990 mbar | ||||||||
| Accumulated Cyclone Energy (ACE*) Index (kt2) | 1.6575 x 10⁴ | ||||||||
| Landfall Information (date, location and sustained winds) | 08/24 - Cua Lo, Vietnam ( 43 kt or 80 km/h) | ||||||||
| Deaths | 0 | ||||||||
| *The (ACE) Index calculations are based on preliminary data. | |||||||||
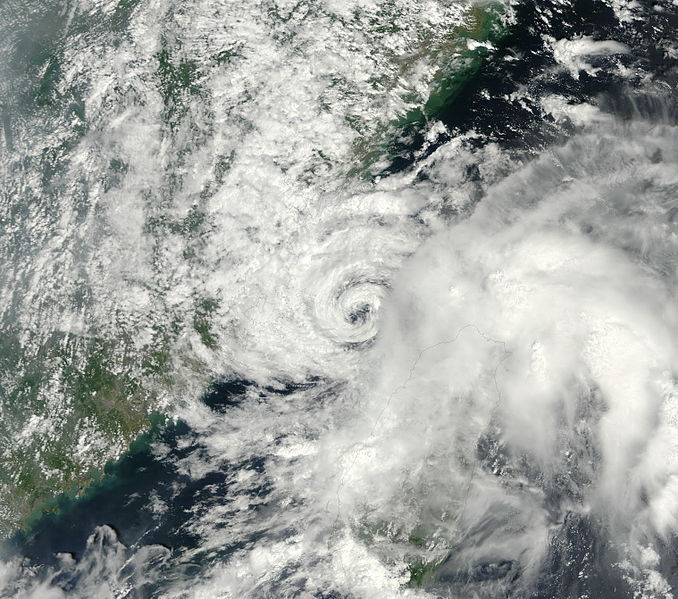
 Tropical Storm Lionrock Satellite Image |
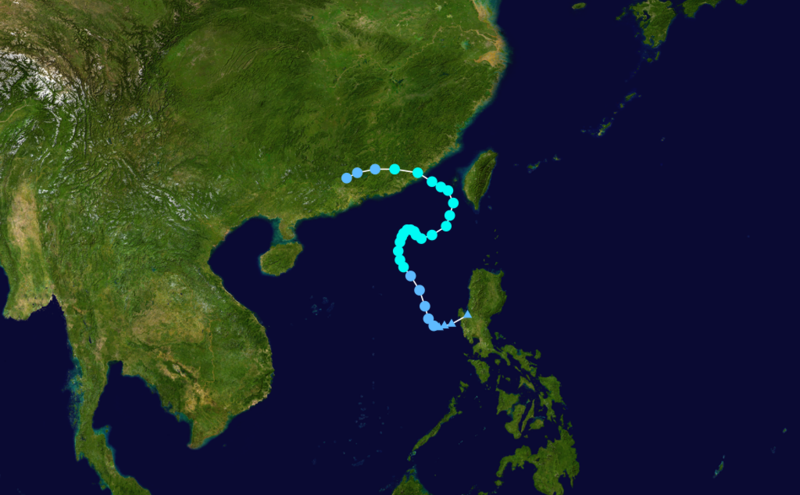 Tropical Storm Lionrock Forecast Track Saffir-Simpson Scale Color Legend |
| Tropical Cyclone | Lionrock | ||||||||
| Cyclogenesis Date | 08/28 | ||||||||
| Cyclolysis Date | 09/02 | ||||||||
| Highest Saffir-Simpson Category | TS | ||||||||
| Maximum 6-hr Sustained Wind | 63 mph (55 kt or 102 km/h) | ||||||||
| Min Pressure | 985 mbar | ||||||||
| Accumulated Cyclone Energy (ACE*) Index (kt2) | 4.0850 x 10⁴ | ||||||||
| Landfall Information (date, location and sustained winds) | N/A | ||||||||
| Deaths | 0 | ||||||||
| *The (ACE) Index calculations are based on preliminary data. | |||||||||
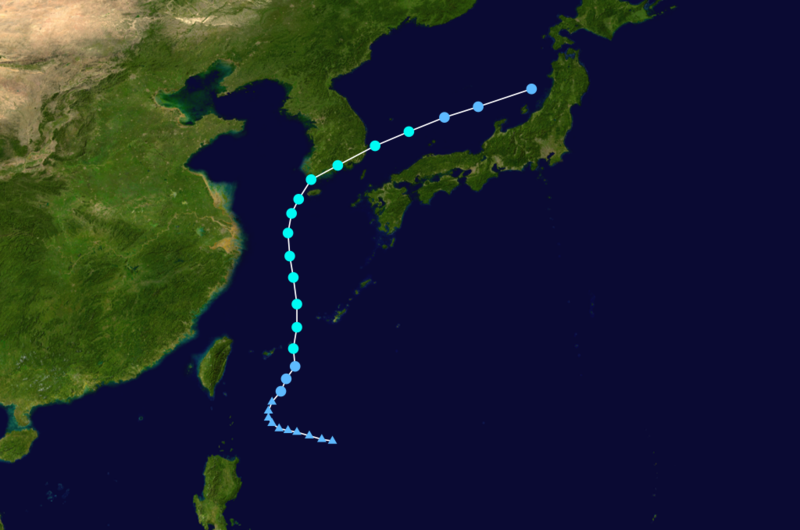
 Tropical Storm Kompasu Satellite Image |
 Tropical Storm Kompasu Forecast Track Saffir-Simpson Scale Color Legend |
| Tropical Cyclone | Kompasu | ||||||||
| Cyclogenesis Date | 08/28 | ||||||||
| Cyclolysis Date | 09/02 | ||||||||
| Highest Saffir-Simpson Category | Cat 1 | ||||||||
| Maximum 6-hr Sustained Wind | 115 mph (95 kt or 185 km/h) | ||||||||
| Min Pressure | 960 mbar | ||||||||
| Accumulated Cyclone Energy (ACE*) Index (kt2) | 10.9350 x 10⁴ | ||||||||
| Landfall Information (date, location and sustained winds) | 09/01 - Ganghwa Island, South Korea (65 kt or 120 km/h) | ||||||||
| Deaths | 4 | ||||||||
| *The (ACE) Index calculations are based on preliminary data. | |||||||||
 Tropical Storm Namtheun Satellite Image |
 Tropical Storm Namtheun Forecast Track Saffir-Simpson Scale Color Legend |
| Tropical Cyclone | Namtheun | ||||||||
| Cyclogenesis Date | 08/30 | ||||||||
| Cyclolysis Date | 08/31 | ||||||||
| Highest Saffir-Simpson Category | TS | ||||||||
| Maximum 6-hr Sustained Wind | 46 mph (40 kt or 74 km/h) | ||||||||
| Min Pressure | 994 mbar | ||||||||
| Accumulated Cyclone Energy (ACE*) Index (kt2) | .6875 x 104 | ||||||||
| Landfall Information (date, location and sustained winds) | N/A | ||||||||
| Deaths | 0 | ||||||||
| *The (ACE) Index calculations are based on preliminary data. | |||||||||