Atlantic Basin
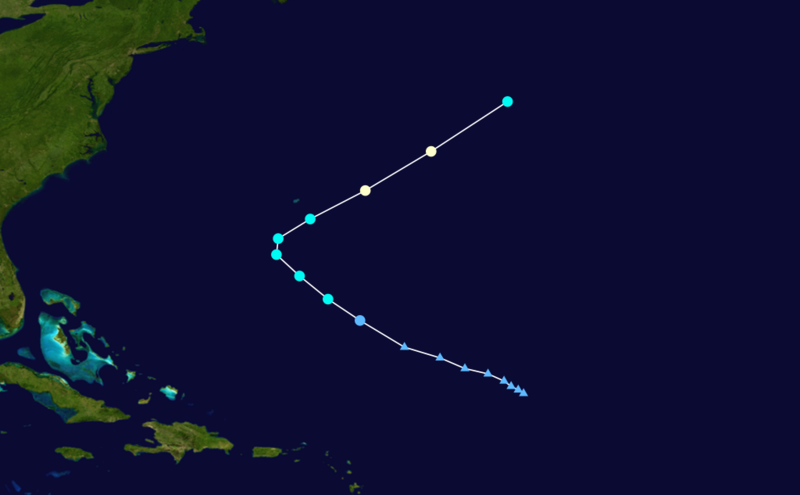
Hurricane Otto was the 15th named storm of the 2010 Atlantic hurricane season. Otto formed as a sub-tropical depression on October 6th from a low pressure system which had stalled out over the Caribbean. On the 7th, Otto transitioned to a tropical system and became a hurricane on the 8th. The storm never made landfall, and moved into the central Atlantic, becoming extratropical on the 10th. Although Otto never directly impacted land, the system brought heavy rainfall to the Lesser Antilles and caused mudslides in Puerto Rico and the Virgin Islands. At its strongest, Hurricane Otto had sustained winds of 85 mph (140 km/hr) and a central minimum pressure of 972 mb. Please see the Global Hazards report for additional information on Otto.
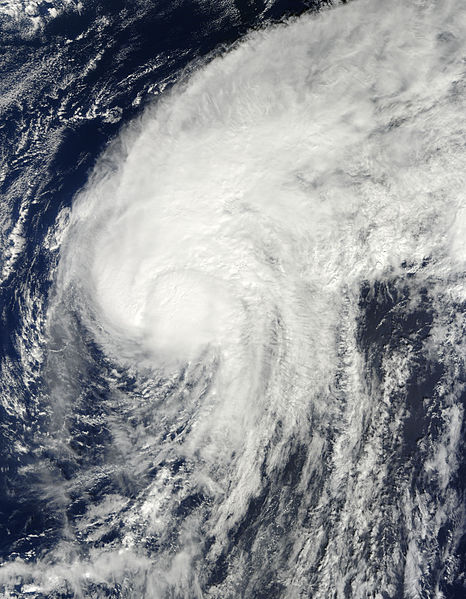 Tropical Storm Otto Satellite Image |
 Tropical Storm Otto Forecast Track  Saffir-Simpson Scale Color Legend |
| Tropical Cyclone | Otto | ||||||||
| Cyclogenesis Date | 10/06 | ||||||||
| Cyclolysis Date | 10/10 | ||||||||
| Highest Saffir-Simpson Category | TS | ||||||||
| Maximum 6-hr Sustained Wind | 86 mph (75 kt or 139 km/h) | ||||||||
| Min Pressure | 972 mbar | ||||||||
| Accumulated Cyclone Energy (ACE*) Index (kt2) | 5.6325 x 10⁴ | ||||||||
| Landfall Information (date, location and sustained winds) | N/A | ||||||||
| Deaths | 0 | ||||||||
| *The (ACE) Index calculations are based on preliminary data. | |||||||||
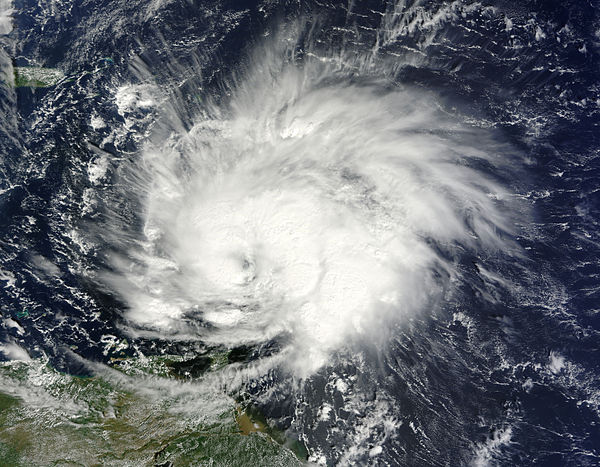
Hurricane Paula was the 16th named storm of the 2010 Atlantic hurricane season and ninth hurricane. Paula formed as a tropical storm on October 11th off the Honduras coast and was upgraded to a hurricane by the 12th. Paula is one of only five Atlantic tropical cyclones to ever be given a 'P' name in the Atlantic basin (Pablo in 1995, Peter in 2003, Philippe in 2005, and Paloma in 2008). Paula strengthened into a hurricane only 12 hours after the National Hurricane Center's first advisory. Later the same day Paula intensified to a Category 2 hurricane with sustained winds of 100 mph (160 km/hr) and a central minimum pressure of 984 mb. After reaching Category 2 strength, Paula moved between Mexico's Yucatan Peninsula and Cuba and weakened. By the 14th, Paula was downgraded to a tropical storm before making landfall in Cuba. The storm brought heavy rain to the island nation, as well as extreme southern Florida. Paula dissipated on the 15th.
 Tropical Storm Paula Satellite Image |
 Tropical Storm Paula Forecast Track Saffir-Simpson Scale Color Legend |
| Tropical Cyclone | Paula | ||||||||
| Cyclogenesis Date | 10/11 | ||||||||
| Cyclolysis Date | 10/15 | ||||||||
| Highest Saffir-Simpson Category | Cat 2 | ||||||||
| Maximum 6-hr Sustained Wind | 98 mph (85 kt or 157 km/h) | ||||||||
| Min Pressure | 984 mbar | ||||||||
| Accumulated Cyclone Energy (ACE*) Index (kt2) | 6.5900 x 10⁴ | ||||||||
| Landfall Information (date, location and sustained winds) | 10/14–Puerto Esperanza, Cuba (55 kt or 105 km/h) | ||||||||
| Deaths | 1 | ||||||||
| *The (ACE) Index calculations are based on preliminary data. | |||||||||
Hurricane Richard was the 17th named storm of the 2010 Atlantic hurricane season and the 10th hurricane. Richard developed from an area of disturbed weather into a tropical storm on October 21st. There have been only two other Atlantic basin storms given a name starting with the letter 'R' — Hurricane Roxanne in 1995 and Hurricane Rita in 2005. Richard strengthened into a hurricane on the 24th with sustained winds of 90 mph (145 km/hr) and a minimum central pressure of 981 mb. Richard made landfall as a strong Category 1 storm south of Belize City. Richard dissipated quickly over the high terrain of the Yucatan Peninsula.
 Tropical Storm Richard Satellite Image |
 Tropical Storm Richard Forecast Track Saffir-Simpson Scale Color Legend |
| Tropical Cyclone | Richard | ||||||||
| Cyclogenesis Date | 10/21 | ||||||||
| Cyclolysis Date | 10/25 | ||||||||
| Highest Saffir-Simpson Category | Cat 1 | ||||||||
| Maximum 6-hr Sustained Wind | 92 mph (80 kt or 148 km/h) | ||||||||
| Min Pressure | 981 mbar | ||||||||
| Accumulated Cyclone Energy (ACE*) Index (kt2) | 4.7600 x 10⁴ | ||||||||
| Landfall Information (date, location and sustained winds) | 10/25–Near Belize City, Belize (78 kt or 145 km/h) | ||||||||
| Deaths | 0 | ||||||||
| *The (ACE) Index calculations are based on preliminary data. | |||||||||
Hurricane Shary was the 18th named storm and the 11th hurricane of the Atlantic hurricane season. There have been only two other tropical cyclones in the Atlantic Basin with a name beginning with the letter 'S' — Tropical Storm Sebastian in 1995 and Hurricane Stan in 2005. Tropical Storm Shary formed in the Atlantic on October 29th, 350 miles (560 km) southeast of Bermuda. On the 30th, Shary strengthened into a Category 1 hurricane with sustained winds of 75 mph and a central minimum pressure of 989 mb. Shary became extratropical later that day and moved off into the North Atlantic without having directly impacted any landmass.
 Tropical Storm Shary Satellite Image |
 Tropical Storm Shary Forecast Track Saffir-Simpson Scale Color Legend |
| Tropical Cyclone | Shary | ||||||||
| Cyclogenesis Date | 10/28 | ||||||||
| Cyclolysis Date | 10/30 | ||||||||
| Highest Saffir-Simpson Category | Cat 1 | ||||||||
| Maximum 6-hr Sustained Wind | 75 mph (65 kt or 120 km/h) | ||||||||
| Min Pressure | 989 mbar | ||||||||
| Accumulated Cyclone Energy (ACE*) Index (kt2) | 4.7600 x 10⁴ | ||||||||
| Landfall Information (date, location and sustained winds) | N/A | ||||||||
| Deaths | 0 | ||||||||
| *The (ACE) Index calculations are based on preliminary data. | |||||||||
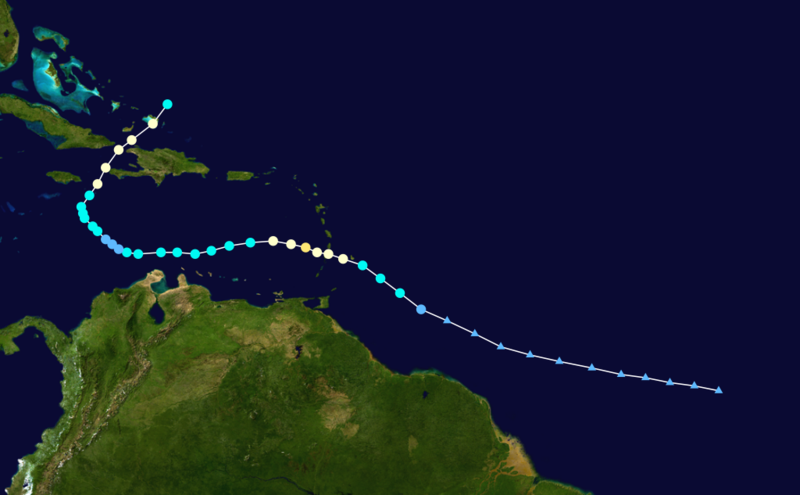
Hurricane Tomas was the 19th named storm and 12th hurricane of the 2010 Atlantic hurricane season. Tomas developed from a tropical wave on October 29th, east of the Lesser Antilles and quickly strengthened into a hurricane. On October 31st, Tomas passed near Saint Lucia, causing flooding and landslides on the small island. The storm moved westward over the Caribbean, strengthening to a Category 2 hurricane with maximum sustained winds of 100 mph and a central minimum pressure of 982 mb. Strong shear over the Caribbean caused the storm to weaken to a tropical storm as it moved off to the west and then north. Once Tomas turned northward, it entered an environment favorable for further development and it strengthened into a hurricane once again on November 5th. The storm’s forward movement sped up as it passed between Haiti and Cuba. Tomas moved off into the Atlantic and became extra-tropical on November 7th. The preliminary death toll of Tomas across the Caribbean islands is 41, marking the deadliest tropical cyclone of the 2010 Atlantic hurricane season, and damages were estimated at 572 million U.S. dollars. The storm also worsened the ongoing Cholera epidemic in Haiti by contributed to flooding rains in the nation. For more information on Tomas see our monthly Global Hazards report.
 Tropical Storm Tomas Satellite Image |
 Tropical Storm Tomas Forecast Track Saffir-Simpson Scale Color Legend |
| Tropical Cyclone | Tomas | ||||||||
| Cyclogenesis Date | 10/29 | ||||||||
| Cyclolysis Date | 11/07 | ||||||||
| Highest Saffir-Simpson Category | Cat 2 | ||||||||
| Maximum 6-hr Sustained Wind | 98 mph (85 kt or 157 km/h) | ||||||||
| Min Pressure | 982 mbar | ||||||||
| Accumulated Cyclone Energy (ACE*) Index (kt2) | 11.0725 x 10⁴s | ||||||||
| Landfall Information (date, location and sustained winds) | 10/30–Barbados (60 kt or 113 km/h) 11/06–Grand Turk, Turks and Caicos Island (65 kt or 121 km/h) |
||||||||
| Deaths | 0 | ||||||||
| *The (ACE) Index calculations are based on preliminary data. | |||||||||
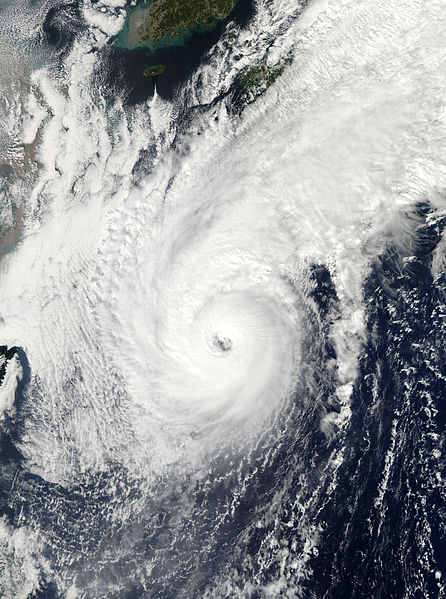
Northwest Pacific Basin
 Tropical Storm Megi Satellite Image |
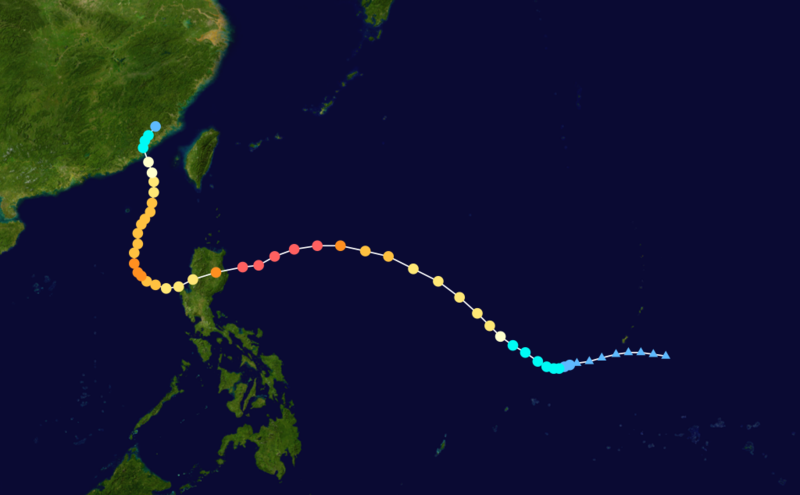 Tropical Storm Megi Forecast Track Saffir-Simpson Scale Color Legend |
| Tropical Cyclone | Megi | ||||||||
| Cyclogenesis Date | 10/13 | ||||||||
| Cyclolysis Date | 10/23 | ||||||||
| Highest Saffir-Simpson Category | Cat 5 | ||||||||
| Maximum 6-hr Sustained Wind | 178 mph (155 kt or 287 km/h) | ||||||||
| Min Pressure | 885 mbar | ||||||||
| Accumulated Cyclone Energy (ACE*) Index (kt2) | 41.2375 x 10⁴ | ||||||||
| Landfall Information (date, location and sustained winds) | 10/17–Sierra Madre, Luzon, Philippines (126 kt or 230 km/h) 10/23–Fujian province, China (48 kt or 89 km/h) |
||||||||
| Deaths | 0 | ||||||||
| *The (ACE) Index calculations are based on preliminary data. | |||||||||
 Tropical Storm Chaba Satellite Image |
 Tropical Storm Chaba Forecast Track Saffir-Simpson Scale Color Legend |
| Tropical Cyclone | Chaba | ||||||||
| Cyclogenesis Date | 10/24 | ||||||||
| Cyclolysis Date | 10/30 | ||||||||
| Highest Saffir-Simpson Category | Cat 3 | ||||||||
| Maximum 6-hr Sustained Wind | 132 mph (115 kt or 213 km/h) | ||||||||
| Min Pressure | 935 mbar | ||||||||
| Accumulated Cyclone Energy (ACE*) Index (kt2) | 17.1325 x 10⁴ | ||||||||
| Landfall Information (date, location and sustained winds) | N/A | ||||||||
| Deaths | 0 | ||||||||
| *The (ACE) Index calculations are based on preliminary data. | |||||||||
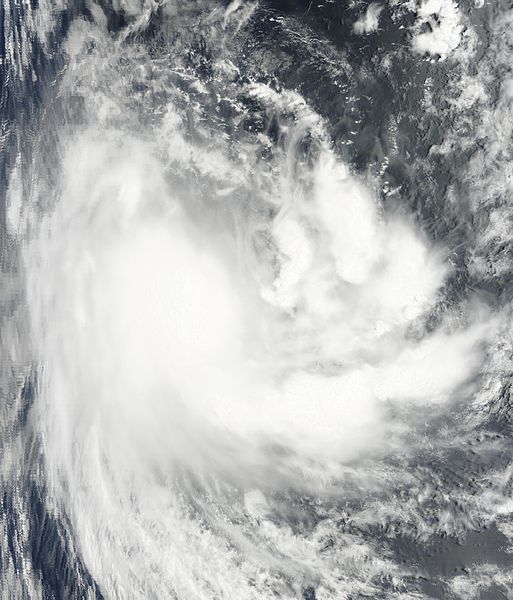
North Indian Basin
 Tropical Storm Giri Satellite Image |
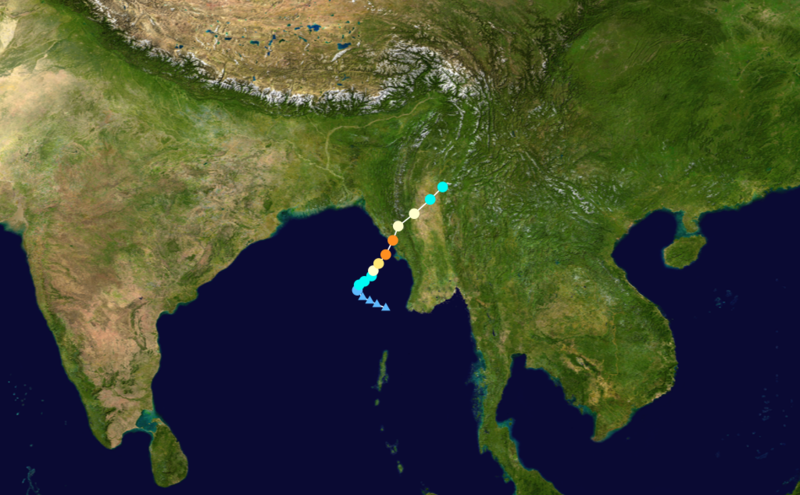 Tropical Storm Giri Forecast Track Saffir-Simpson Scale Color Legend |
| Tropical Cyclone | Giri | ||||||||
| Cyclogenesis Date | 10/21 | ||||||||
| Cyclolysis Date | 10/22 | ||||||||
| Highest Saffir-Simpson Category | Cat 4 | ||||||||
| Maximum 6-hr Sustained Wind | 155 mph (135 kt or 250 km/h) | ||||||||
| Min Pressure | 950 mbar | ||||||||
| Accumulated Cyclone Energy (ACE*) Index (kt2) | 5.8125 x 10⁴ | ||||||||
| Landfall Information (date, location and sustained winds) | 10/22–Kyaukphyu, Rakhine, Myanmar (92 kt or 169 km/h) | ||||||||
| Deaths | 84 | ||||||||
| *The (ACE) Index calculations are based on preliminary data. | |||||||||
South Indian Basin
 Tropical Storm 01S Satellite Image |
 Tropical Storm 01S Forecast Track Saffir-Simpson Scale Color Legend |
| Tropical Cyclone | 01S | ||||||||
| Cyclogenesis Date | 10/26 | ||||||||
| Cyclolysis Date | 10/27 | ||||||||
| Highest Saffir-Simpson Category | TS | ||||||||
| Maximum 6-hr Sustained Wind | 40 mph (35 kt or 65 km/h) | ||||||||
| Min Pressure | 997 mbar | ||||||||
| Accumulated Cyclone Energy (ACE*) Index (kt2) | .4900 x 104 | ||||||||
| Landfall Information (date, location and sustained winds) | N/A | ||||||||
| Deaths | 0 | ||||||||
| *The (ACE) Index calculations are based on preliminary data. | |||||||||
Australian Basin
 Tropical Storm Anggrek Satellite Image  Australian Scale Color Legend |
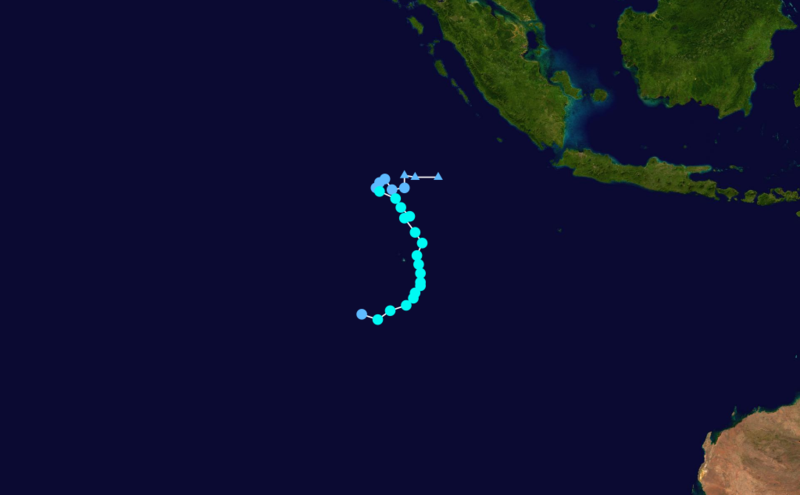 Tropical Storm Anggrek Track Saffir-Simpson Scale Color Legend | ||||||||
| Tropical Cyclone | Anggrek | ||||||||
| Cyclogenesis Date | 10/30 | Cyclolysis Date | 11/03 | ||||||
| Highest Australian Category | Cat 1 | Maximum Gust | 130 km/h | ||||||
| Highest Saffir-Simpson Category | TS | ||||||||
| Maximum 6-hr Sustained Wind | 63 mph (55 kt or 102 km/h) | ||||||||
| Min Pressure | 986 mbar | ||||||||
| Accumulated Cyclone Energy (ACE*) Index (kt2) | 3.5643 x 10⁴ | ||||||||
| Landfall Information (date, location and sustained winds) | N/A | ||||||||
| Deaths | 0 | ||||||||
| *The (ACE) Index calculations are based on preliminary data. | |||||||||