 September Tropical Cyclones |
 Season-to-Date Tropical Cyclones |
Atlantic Basin
The number of North Atlantic tropical cyclones during the month of September was below normal with only one cyclone reaching hurricane intensity in the month. On average, 2.5 cyclones reach hurricane strength at some point in September. For the season-to-date period, two cyclones have reached hurricane strength. On average, 4.8 hurricanes form in the North Atlantic from the start of the season to the end of September.
Hurricane Fred gained notoriety by becoming only the third major hurricane to be noted east of 35 degrees West in the tropical Atlantic Ocean. In 1926 there was an unnamed hurricane observed and more recently Hurricane Frances in 1980. Frances became a hurricane further east than Fred, but was not as powerful. HURSAT utilizes Google Earth by displaying 30-years worth of tropical cyclone satellite imagery in all basins. The infrared satellite loop of Frances shows how quickly the cyclone was able to organize and gain hurricane strength. Satellite imagery was not available prior to 1960, so it is possible more storms occurred but were not spotted. All averages are based on a 1979—2009 period.
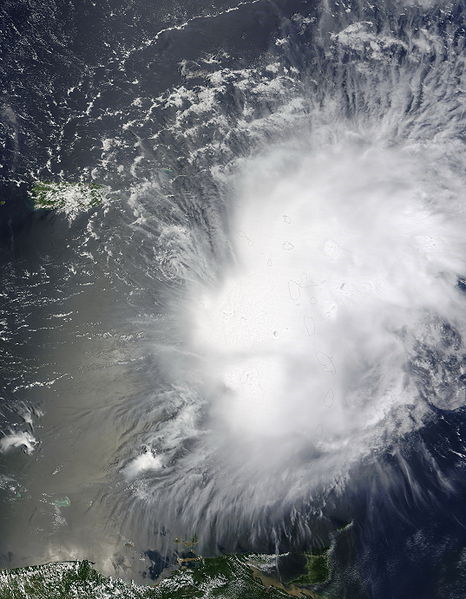 Tropical Storm Erika Satellite Image |
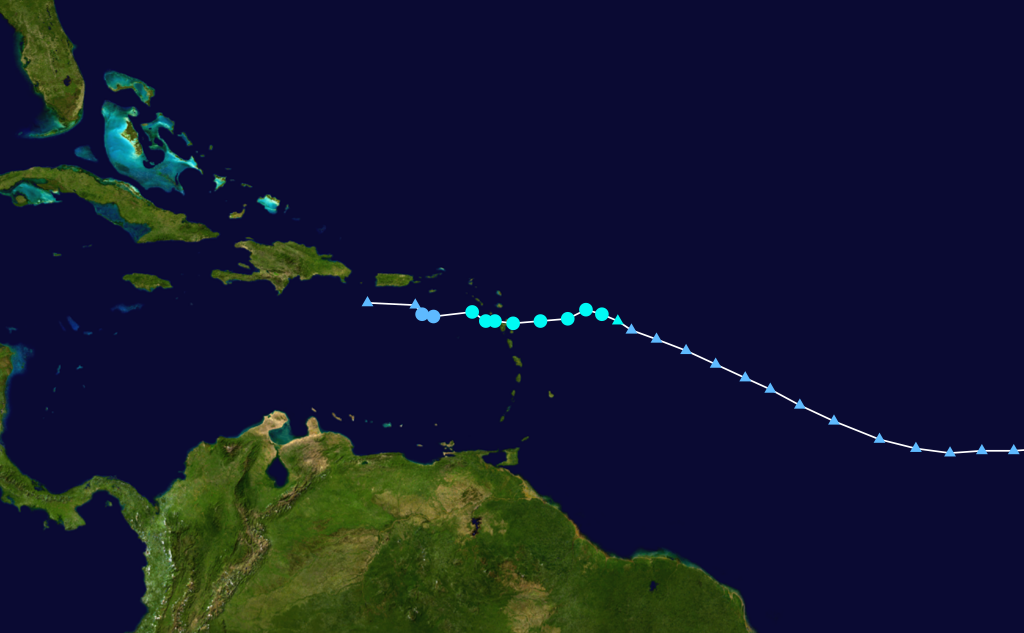 Tropical Storm Erika Track  Saffir-Simpson Scale Color Legend | ||||||||
| Tropical Cyclone | Erika | ||||||||
| Cyclogenesis Date | 09/01 | ||||||||
| Cyclolysis Date | 09/03 | ||||||||
| Highest Saffir-Simpson Category | TS | ||||||||
| Maximum 6-hr Sustained Wind | 58 mph (50 kt or 93 km/h) | ||||||||
| Min Pressure | 1004 mbar | ||||||||
| Accumulated Cyclone Energy (ACE*) Index (kt2) | 1.7200 x 10⁴ | ||||||||
| Landfall Information (date, location and sustained winds) | N/A | ||||||||
| Deaths | 0 | ||||||||
| *The (ACE) Index calculations are based on preliminary data. | |||||||||
More information on Erika is available from the NOAA National Hurricane Center.
 Tropical Storm Fred Satellite Image |
 Tropical Storm Fred Track Saffir-Simpson Scale Color Legend | ||||||||
| Tropical Cyclone | Fred | ||||||||
| Cyclogenesis Date | 09/07 | ||||||||
| Cyclolysis Date | 09/12 | ||||||||
| Highest Saffir-Simpson Category | Cat 3 | ||||||||
| Maximum 6-hr Sustained Wind | 121 mph (105 kt or 195 km/h) | ||||||||
| Min Pressure | 958 mbar | ||||||||
| Accumulated Cyclone Energy (ACE*) Index (kt2) | 9.8125 x 10⁴ | ||||||||
| Landfall Information (date, location and sustained winds) | N/A | ||||||||
| Deaths | 0 | ||||||||
| *The (ACE) Index calculations are based on preliminary data. | |||||||||
More information on Fred is available from the NOAA National Hurricane Center.
Northeast Pacific Basin
 Tropical Storm Linda Satellite Image |
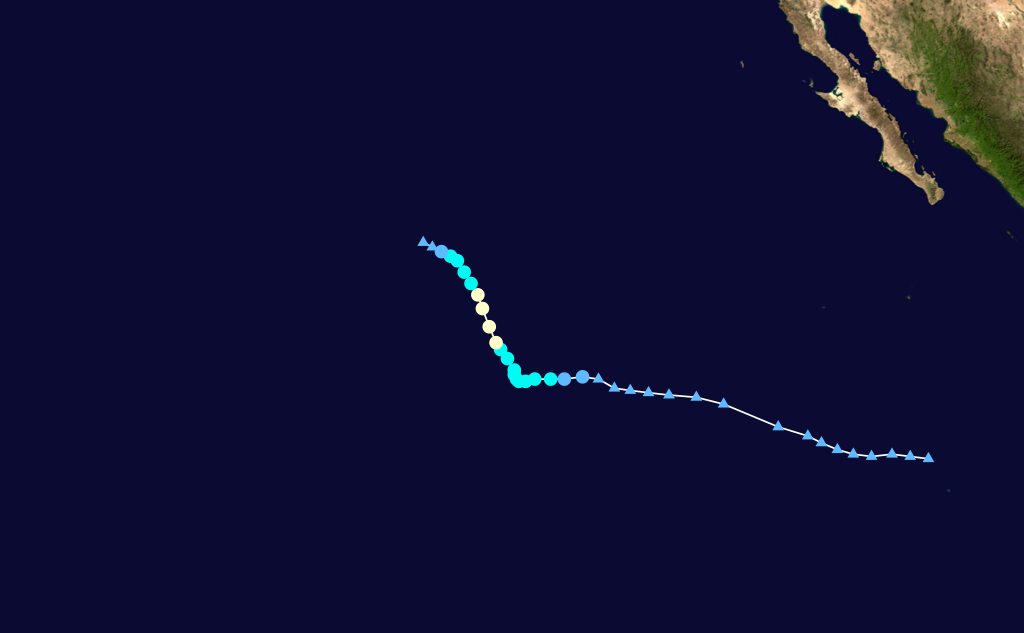 Tropical Storm Linda Track Saffir-Simpson Scale Color Legend | ||||||||
| Tropical Cyclone | Linda | ||||||||
| Cyclogenesis Date | 09/07 | ||||||||
| Cyclolysis Date | 09/11 | ||||||||
| Highest Saffir-Simpson Category | Cat 1 | ||||||||
| Max Wind | 86 mph (75 kt or 138 km/h) | ||||||||
| Min Pressure | 985 mbar | ||||||||
| Accumulated Cyclone Energy (ACE*) Index (kt2) | 5.2700 x 10⁴ | ||||||||
| Landfall Information (date, location and sustained winds) | N/A | ||||||||
| Deaths | 0 | ||||||||
| *The (ACE) Index calculations are based on preliminary data. | |||||||||
More information on Linda is available from the NOAA National Hurricane Center.
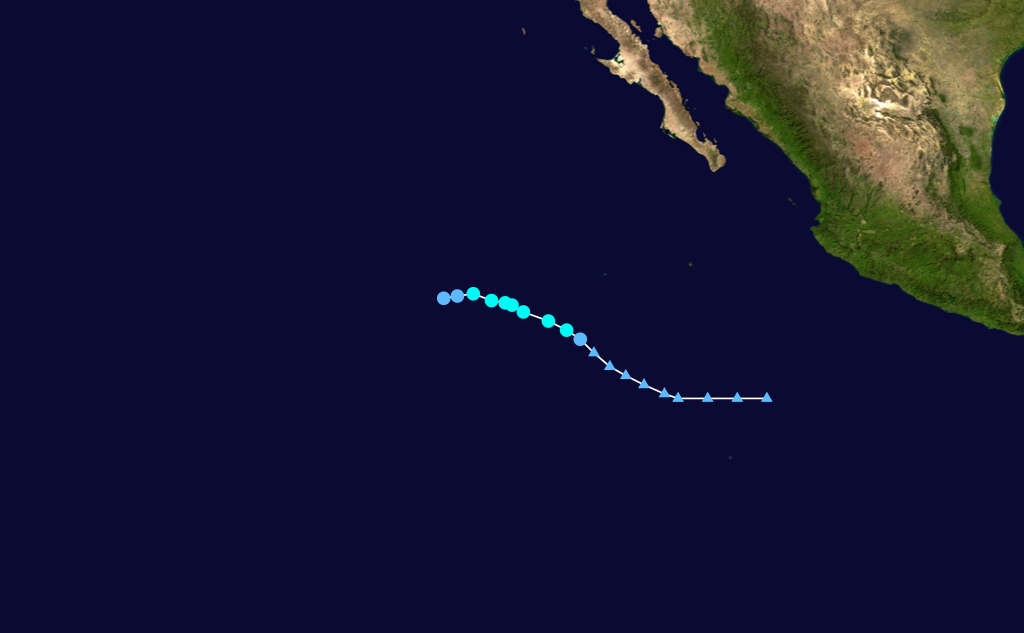
 Hurricane Marty Satellite Image |
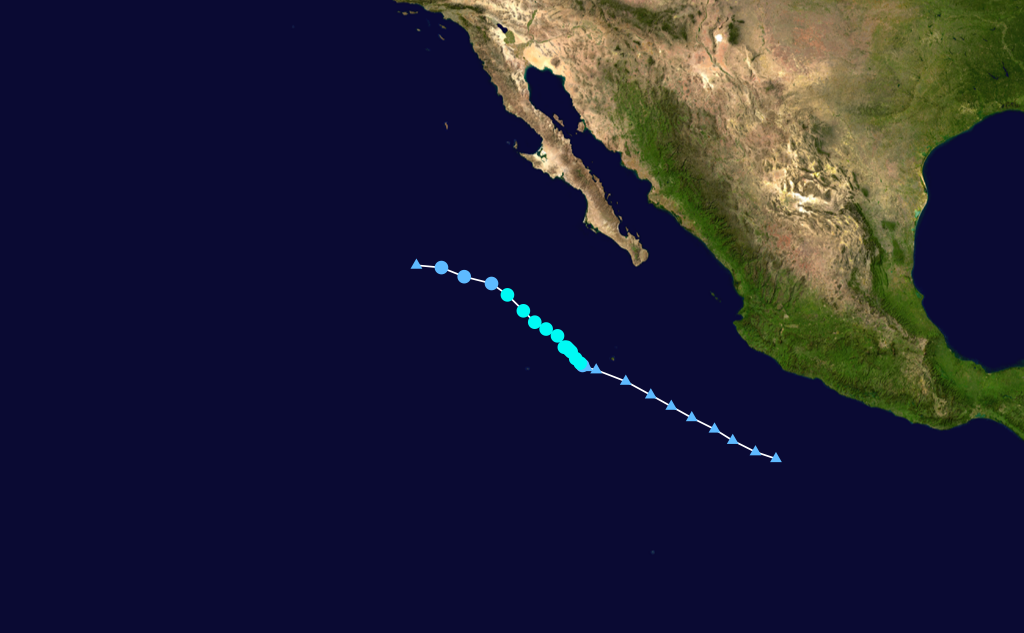 Hurricane Marty Track Saffir-Simpson Scale Color Legend | ||||||||
| Tropical Cyclone | Marty | ||||||||
| Cyclogenesis Date | 09/16 | ||||||||
| Cyclolysis Date | 09/19 | ||||||||
| Highest Saffir-Simpson Category | TS | ||||||||
| Max Wind | 52 mph (45 kt or 83 km/h) | ||||||||
| Min Pressure | 1001 mbar | ||||||||
| Accumulated Cyclone Energy (ACE*) Index (kt2) | 1.5725 x 10⁴ | ||||||||
| Landfall Information (date, location and sustained winds) | N/A | ||||||||
| Deaths | 0 | ||||||||
| *The (ACE) Index calculations are based on preliminary data. | |||||||||
More information on Marty is available from the NOAA National Hurricane Center.
 Hurricane Nora Satellite Image |
 Hurricane Nora Track Saffir-Simpson Scale Color Legend | ||||||||
| Tropical Cyclone | Nora | ||||||||
| Cyclogenesis Date | 09/23 | ||||||||
| Cyclolysis Date | 09/24 | ||||||||
| Highest Saffir-Simpson Category | TS | ||||||||
| Max Wind | 58 mph (50 kt or 93 km/h) | ||||||||
| Min Pressure | 997 mbar | ||||||||
| Accumulated Cyclone Energy (ACE*) Index (kt2) | 1.3000 x 10⁴ | ||||||||
| Landfall Information (date, location and sustained winds) | N/A | ||||||||
| Deaths | N/A | ||||||||
| *The (ACE) Index calculations are based on preliminary data. | |||||||||
More information on Nora is available from the NOAA National Hurricane Center.
Northwest Pacific Basin
 Hurricane Dujuan Satellite Image |
 Hurricane Dujuan Track Saffir-Simpson Scale Color Legend | ||||||||
| Tropical Cyclone | Dujuan | ||||||||
| Cyclogenesis Date | 09/04 | ||||||||
| Cyclolysis Date | 09/07 | ||||||||
| Highest Saffir-Simpson Category | TS | ||||||||
| Maximum 6-hr Sustained Wind | 52 mph (45 kt or 83 km/h) | ||||||||
| Min Pressure | N/A | ||||||||
| Accumulated Cyclone Energy (ACE*) Index (kt2) | 2.1850 x 10⁴ | ||||||||
| Landfall Information (date, location and sustained winds) | N/A | ||||||||
| Deaths | N/A | ||||||||
| *The (ACE) Index calculations are based on preliminary data. | |||||||||
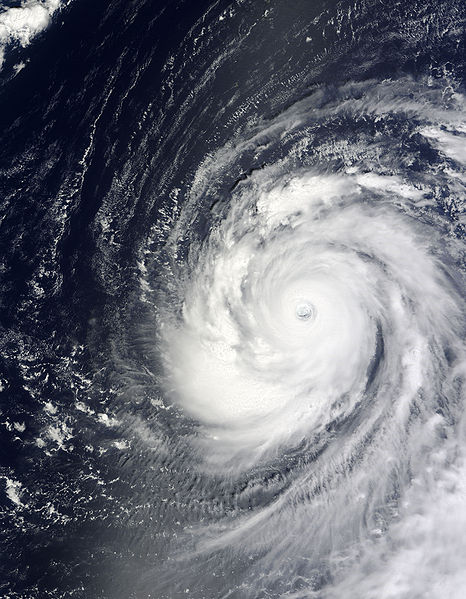 Hurricane Choi-Wan Satellite Image |
 Hurricane Choi-Wan Track Saffir-Simpson Scale Color Legend | ||||||||
| Tropical Cyclone | Choi-Wan | ||||||||
| Cyclogenesis Date | 09/12 | ||||||||
| Cyclolysis Date | 09/15 | ||||||||
| Highest Saffir-Simpson Category | Cat 5 | ||||||||
| Maximum 6-hr Sustained Wind | 161 mph (140 kt or 259 km/h) | ||||||||
| Min Pressure | N/A | ||||||||
| Accumulated Cyclone Energy (ACE*) Index (kt2) | 34.5056 x 10⁴ | ||||||||
| Landfall Information (date, location and sustained winds) | N/A | ||||||||
| Deaths | N/A | ||||||||
| *The (ACE) Index calculations are based on preliminary data. | |||||||||
 Hurricane Koppu Satellite Image |
 Hurricane Koppu Track Saffir-Simpson Scale Color Legend | ||||||||
| Tropical Cyclone | Koppu | ||||||||
| Cyclogenesis Date | 09/13 | ||||||||
| Cyclolysis Date | 09/15 | ||||||||
| Highest Saffir-Simpson Category | Cat 1 | ||||||||
| Maximum 6-hr Sustained Wind | 81 mph (70 kt or 83 km/h) | ||||||||
| Min Pressure | N/A | ||||||||
| Accumulated Cyclone Energy (ACE*) Index (kt2) | 2.2200 x 10⁴ | ||||||||
| Landfall Information (date, location and sustained winds) | N/A | ||||||||
| Deaths | N/A | ||||||||
| *The (ACE) Index calculations are based on preliminary data. | |||||||||
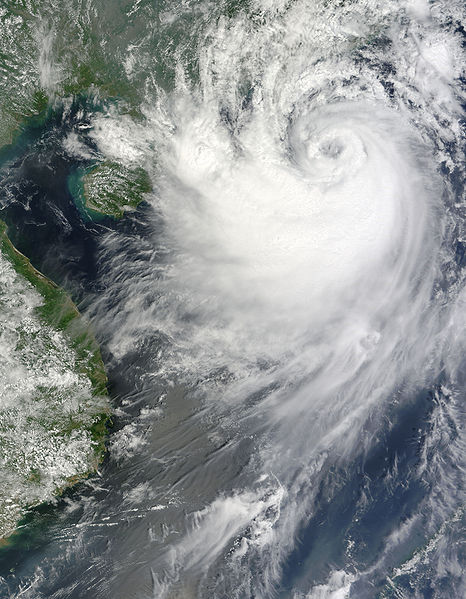
 Hurricane Ketsana Satellite Image |
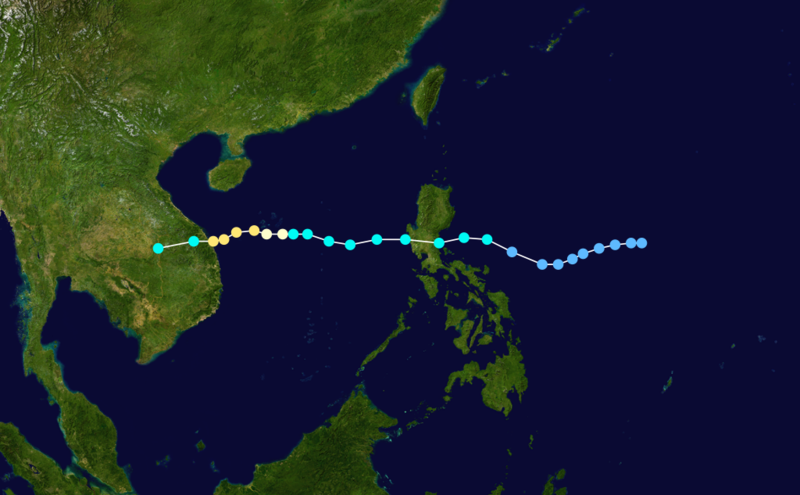 Hurricane Ketsana Track Saffir-Simpson Scale Color Legend | ||||||||
| Tropical Cyclone | Ketsana | ||||||||
| Cyclogenesis Date | 09/25 | ||||||||
| Cyclolysis Date | 09/29 | ||||||||
| Highest Saffir-Simpson Category | Cat 2 | ||||||||
| Maximum 6-hr Sustained Wind | 104 mph (90 kt or 167 km/h) | ||||||||
| Min Pressure | xxx mbar | ||||||||
| Accumulated Cyclone Energy (ACE*) Index (kt2) | 6.4225 x 10⁴ | ||||||||
| Landfall Information (date, location and sustained winds) | 09/26 Luzon, Philippines (45 kt or 85 km/h) 09/29 Quang, Vietnam (90 kt or 167 km/h) |
||||||||
| Deaths | N/A | ||||||||
| *The (ACE) Index calculations are based on preliminary data. | |||||||||
 Hurricane Parma Satellite Image |
 Hurricane Parma Track Saffir-Simpson Scale Color Legend | ||||||||
| Tropical Cyclone | Parma | ||||||||
| Cyclogenesis Date | 09/28 | ||||||||
| Cyclolysis Date | 10/14 | ||||||||
| Highest Saffir-Simpson Category | Cat 4 | ||||||||
| Maximum 6-hr Sustained Wind | 150 mph (130 kt or 241 km/hr) | ||||||||
| Min Pressure | N/A | ||||||||
| Accumulated Cyclone Energy (ACE*) Index (kt2) | 24.2025 x 10⁴ | ||||||||
| Landfall Information (date, location and sustained winds) | 10/03 Cagayan Valley, Philippines (80 kt or 148 km/h) | ||||||||
| Deaths | 186 | ||||||||
| *The (ACE) Index calculations are based on preliminary data. | |||||||||
 Hurricane Melor Satellite Image |
 Hurricane Melor Track Saffir-Simpson Scale Color Legend | ||||||||
| Tropical Cyclone | Melor | ||||||||
| Cyclogenesis Date | 09/29 | ||||||||
| Cyclolysis Date | 10/08 | ||||||||
| Highest Saffir-Simpson Category | Cat 4 | ||||||||
| Maximum 6-hr Sustained Wind | 161 mph (140 kt or 259 km/h) | ||||||||
| Min Pressure | N/A | ||||||||
| Accumulated Cyclone Energy (ACE*) Index (kt2) | 39.5950 x 10⁴ | ||||||||
| Landfall Information (date, location and sustained winds) | 10/08 southern Japan (70 kt or 112 km/h) | ||||||||
| Deaths | 5 | ||||||||
| *The (ACE) Index calculations are based on preliminary data. | |||||||||