Visit:NCEI U.S. Tornadoes

July 2019 Tornado Occurrences
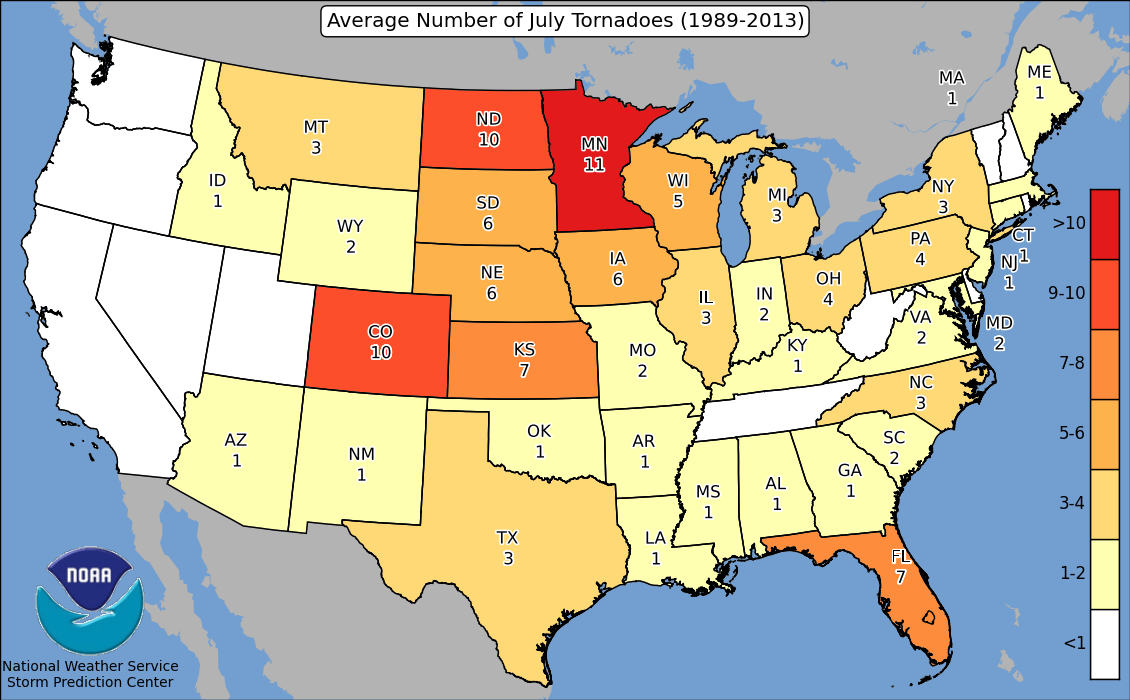
Source: SPC
This analysis is based on preliminary data available from the Storm Prediction Center. Final tornado counts published by the Storm Prediction Center and NCEI's Storm Events Database might differ from this report. For a more detailed climatology, please visit our tornado climatology page.
According to data from NOAA's Storm Prediction Center, during July, there were 102 preliminary tornado reports. This is below the 1991-2010 average of 134 tornadoes for the month of July. Many of the July tornadoes occurred throughout the month in counts of 10 or fewer tornadoes per day. More than half of the July tornadoes occurred during July 8-9, July 17-20 and July 28. Also, a large majority of tornado events occurred across the North Central Plains, which is consistent with past climatology for tornadoes during the month of July.
On July 8-9, there were 15 reported tornadoes across Minnesota, North Dakota, Nebraska and Iowa. There were no deaths associated with these events. The highest frequency of tornadoes in consecutive days occurred during July 17-20 with 29 reported tornadoes across Montana, Wyoming, Minnesota, South Dakota, Wisconsin and Louisiana. Wisconsin experienced the highest frequency of tornadoes during this multi-day event. There were no deaths associated with these events. On July 28, there were 12 reported tornadoes across Minnesota, Wisconsin and the Dakotas, with no reported deaths.
Did You Know?
Tornado Count
Final monthly tornado counts are typically less than the preliminary count. This can be due to some phenomena being inaccurately reported as tornadic activity or a single tornado being reported multiple times. Tornado accounts are reported to the local National Weather Service forecast offices who are responsible for going into the field and verifying each tornado reported. This process often takes several months to complete. Once all reports have been investigated, the final count is published by the Storm Prediction Center (SPC).
The Tornado Monthly Climate Reports are written using the preliminary numbers because the final data is not available at the time of production. Historically, for every 100 preliminary tornado reports, at least 65 tornadoes are confirmed. An error bar is depicted on the tornado count graphic representing this uncertainty in the preliminary tornado count.
The following U.S. studies performed by SPC meteorologists offer deeper context and discussion regarding the frequency and distribution of tornado intensity climatologies:
-
Edwards, R., H. E. Brooks, and H. Cohn, 2021: Changes in tornado climatology accompanying the Enhanced
Fujita scale. J. Appl. Meteor. Climatol., 60, 1465-1482
DOI: 10.1175/JAMC-D-21-0058.1. - Mccarthy, Daniel & Schaefer, Joseph. (2004). Tornado trends over the past thirty years. paper presented at 14th Conference on Applied Meteorology.