Note: This Synoptic Discussion describes recent weather events and climate anomalies in relation to the phenomena that cause the weather. These phenomena include the jet stream, fronts and low pressure systems that bring precipitation, high pressure systems that bring dry weather, and the mechanisms which control these features — such as El Niño, La Niña, and other oceanic and atmospheric drivers (PNA, NAO, AO, and others). The report may contain more technical language than other components of the State of the Climate series.
Summary
| Time Period | Key Driver | Other Drivers |
|---|---|---|
| Month | Western Ridge, Southwest Monsoon | AO+ |
| July 1-7 | PNA+ | AO+, NAO+, EPO- |
| July 8-13 | Southwest Ridge | NAO+, Hurricane Elsa |
| July 14-23 | AO+ | PNA-, Southwest Monsoon |
| July 24-31 | Southwest Monsoon |
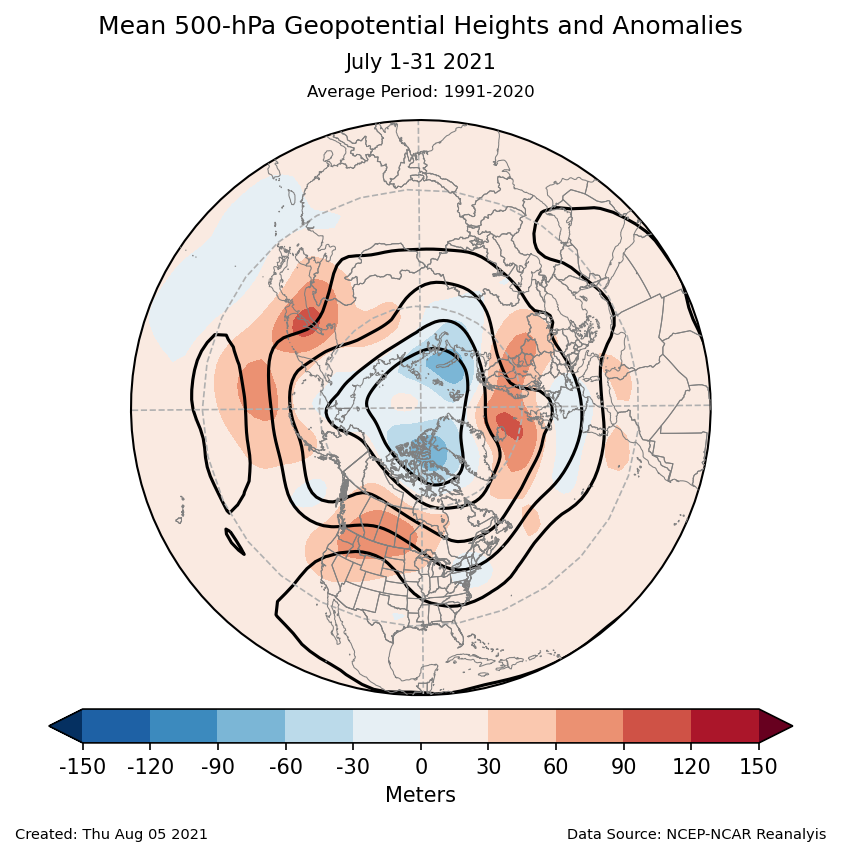
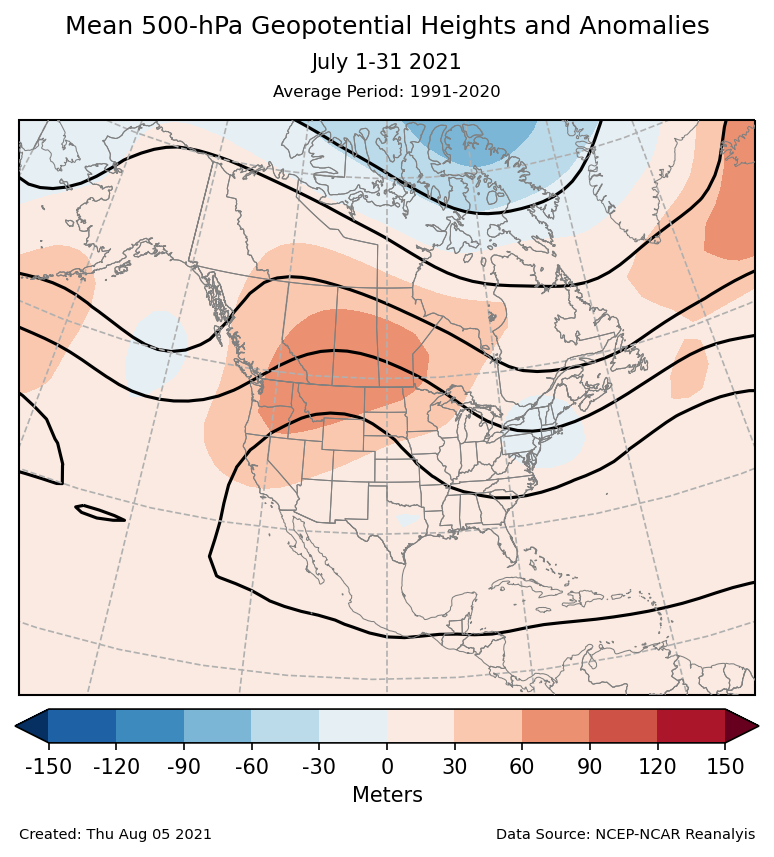
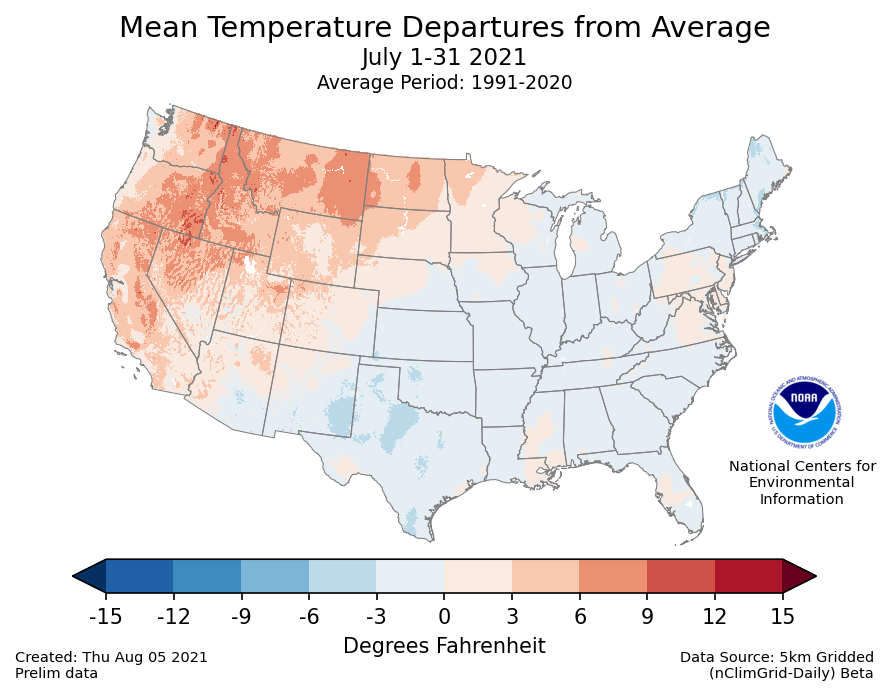
The circulation patterns were remarkably stable during July with a ridge dominating the western U.S. and trough to the east. The ridge was also a major feature in June, and it continued to cause record heat across the West. The ridge also exacerbated drought conditions for northern California and the Pacific Northwest.
Around the middle of July, the ridge shifted eastward towards the Northern Plains. This change allowed the Southwest monsoon to become active. The monsoonal moisture reached as far northward as central Oregon. The Southwest monsoon had been relatively inactive for the last two years, which led to a significant drought. This monsoonal rainfall was beneficial to the region, but not enough to make up for the long-term deficits.
The eastern U.S. was generally under an upper-level trough during July. This trough brought cool and moist anomalies to most of the eastern half of the country. The moisture was also enhanced by the tropical storm that had been Hurricane Elsa. Elsa was the earliest 'E' storm on record when it formed on July 1, breaking the record set by Tropical Storm Edouard on July 4, 2020. However, the tropical Atlantic was quiet for the remainder of July.
Monthly Mean

Submonthly Evolution
July 1-7
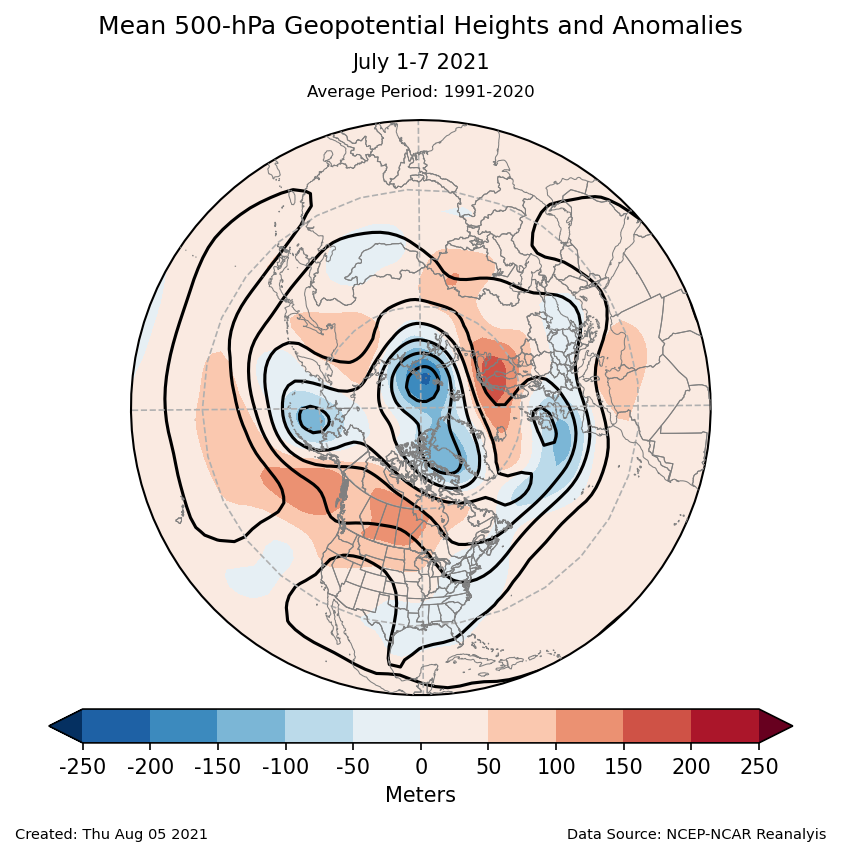
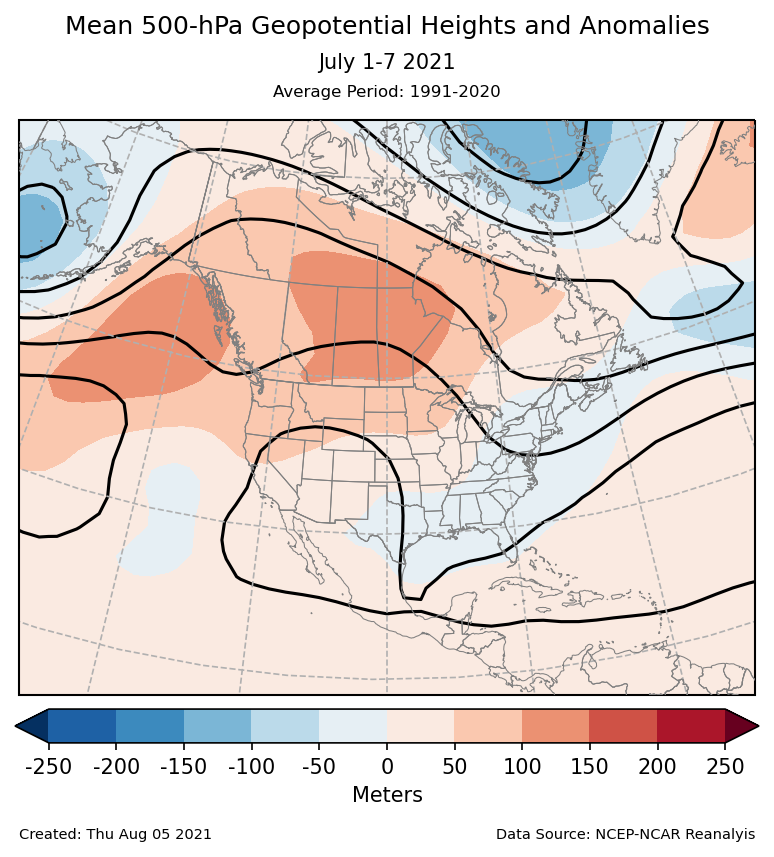
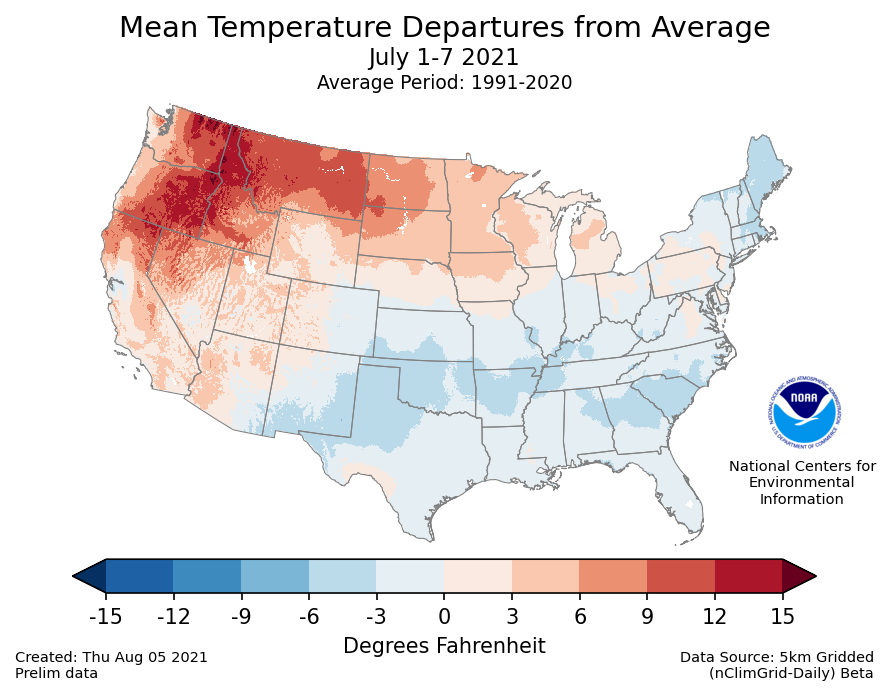

July began with an ongoing record heat wave over the Pacific Northwest that began at the end of June. This heat wave was driven by a high amplitude ridge over western Canada that was part of a positive PNA wavetrain. While the extremity of the heat weakened in July, the ridge moved eastward and spread the heat with it. This ridge also maintained the dry conditions across the West Coast. A trough over the eastern U.S. brought cool and moist conditions there.
July 8-13
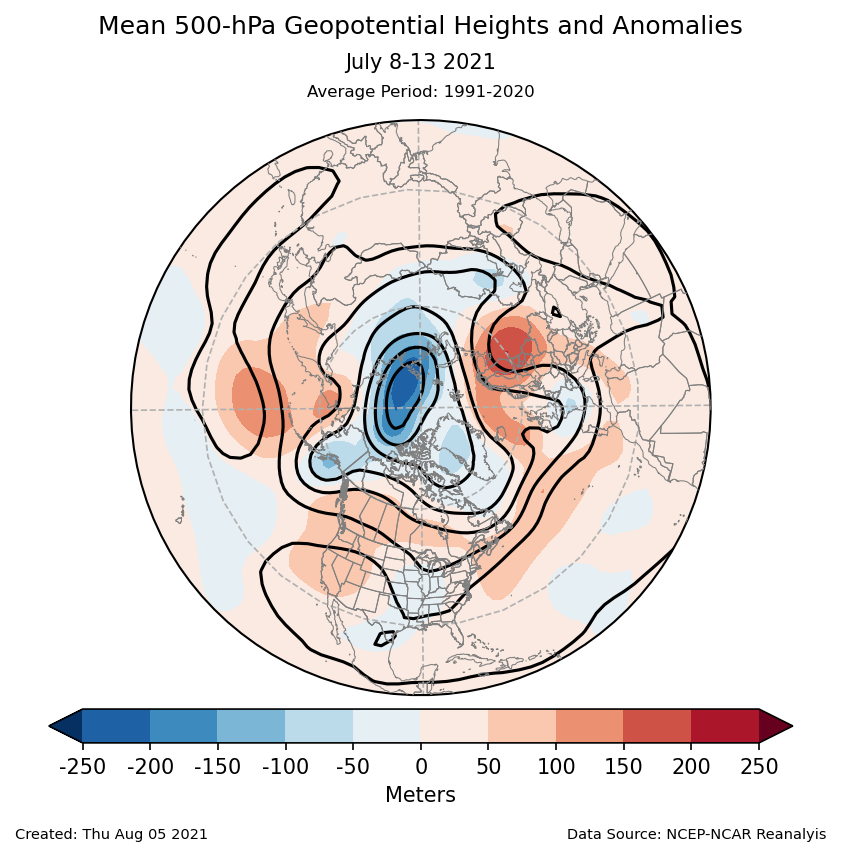
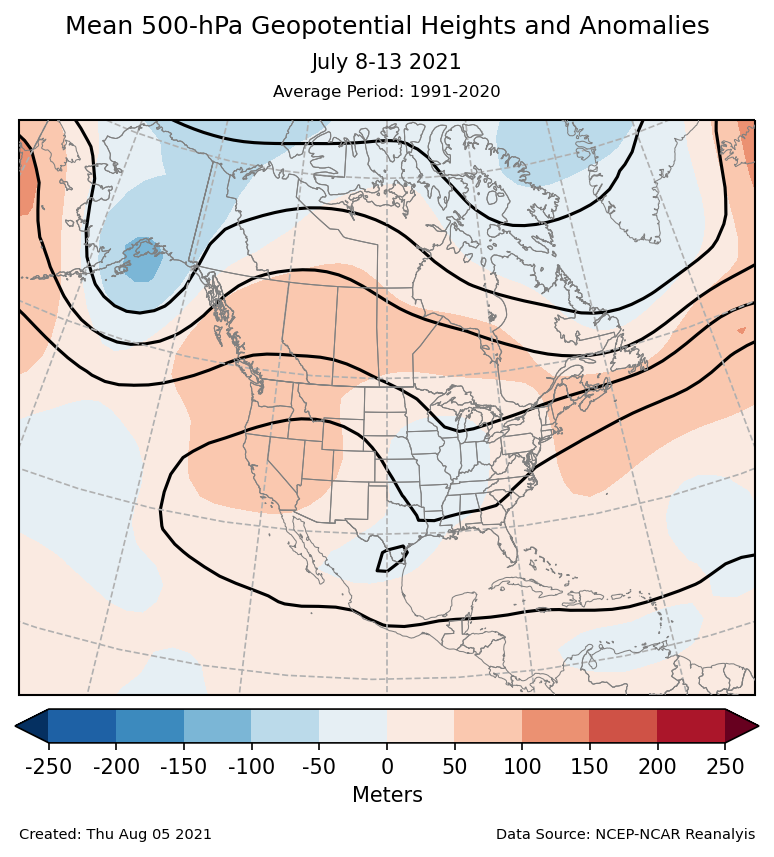
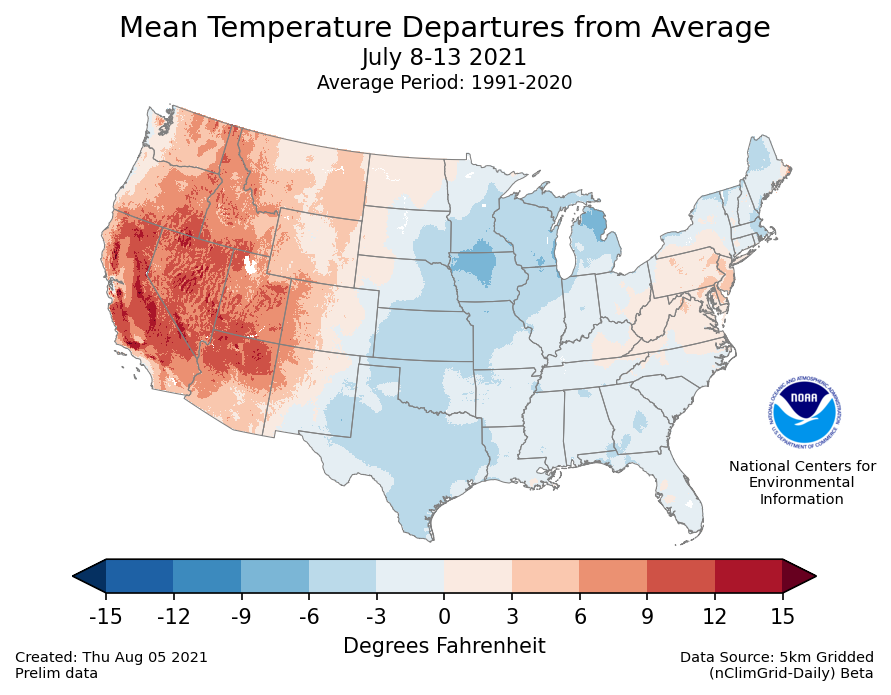
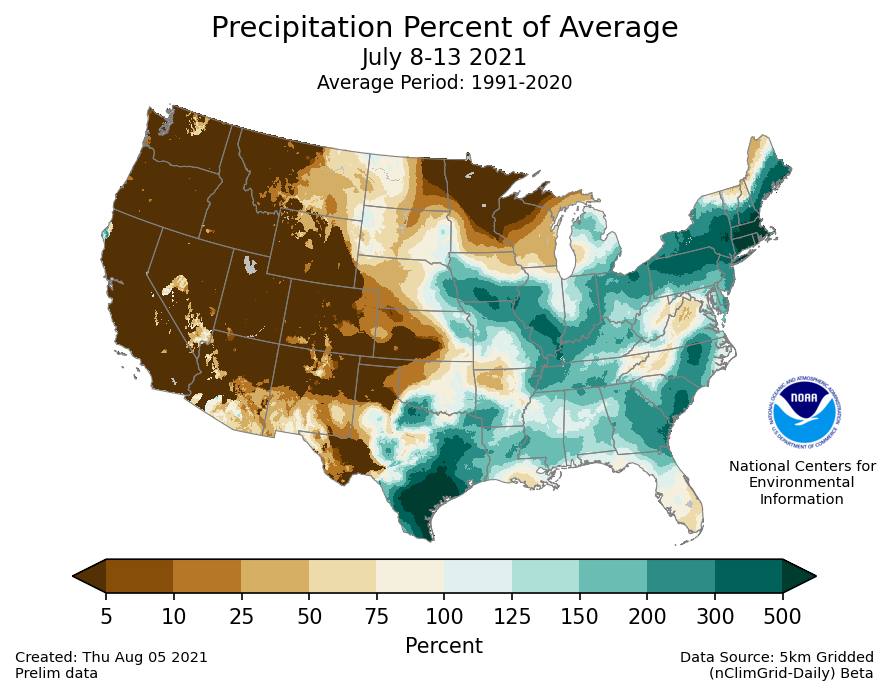
During the second week of July, another ridge developed over western North America. This time the warmest anomalies were centered on the Southwest. Temperatures in Death Valley, CA reached 130°F on July 9. Meanwhile, a cutoff trough over the Mississippi Valley brought cool and moist conditions across the Eastern U.S. This moisture was aided by the landfall of the tropical storm that had been Hurricane Elsa, which brought flooding and tornadoes to Florida, Georgia, and the Carolinas.
July 14-23

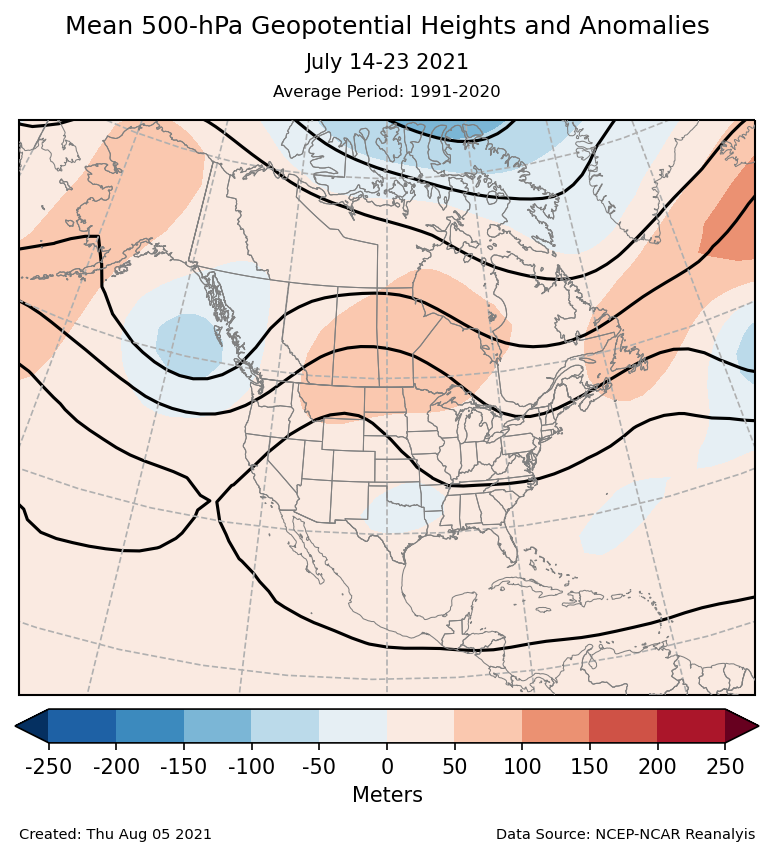
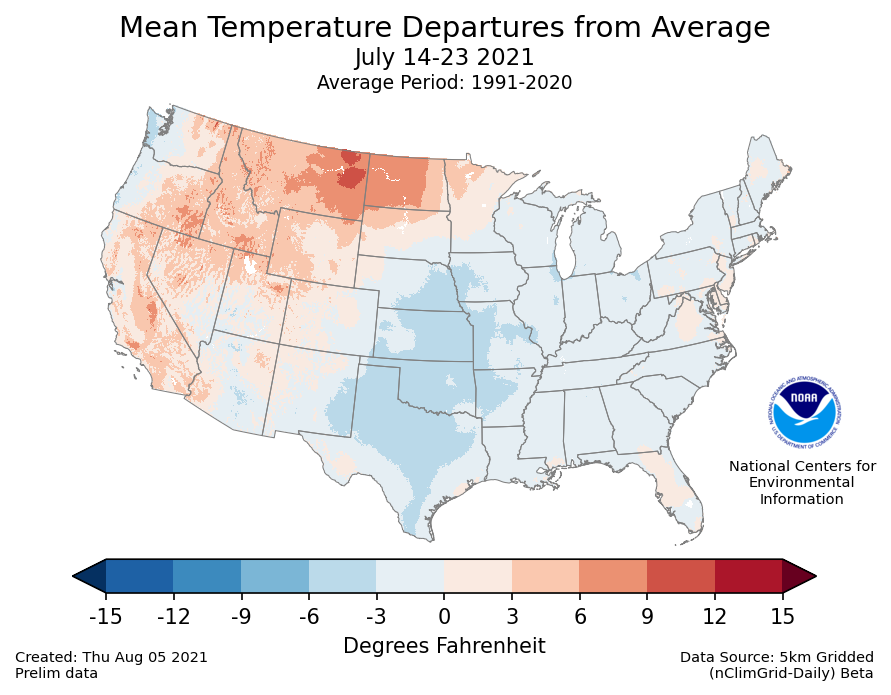
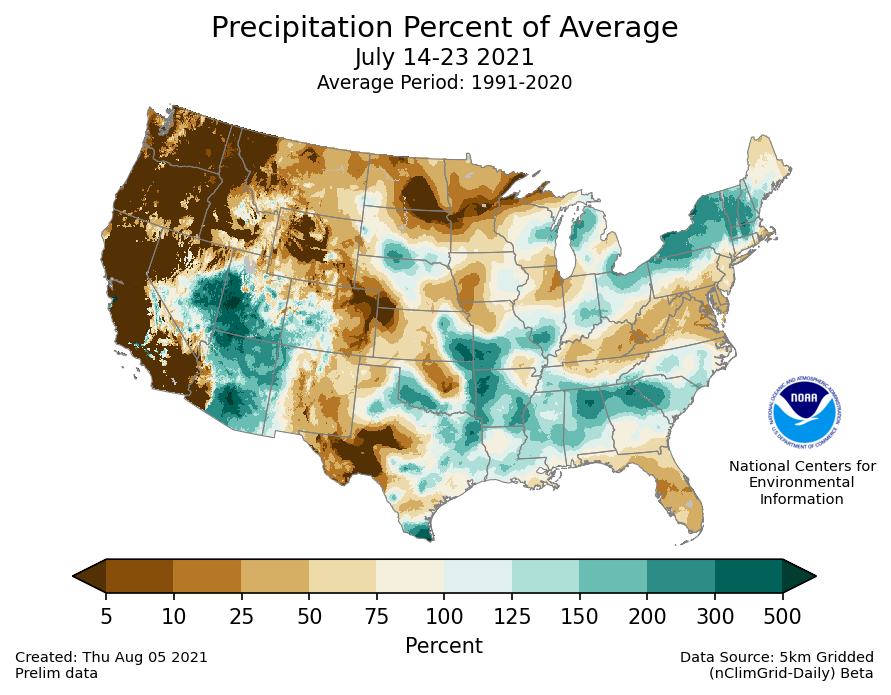
During July 14-23, the Southwest monsoon initiated with the most activity in two years. Tucson, AZ would have its wettest July and month on record with most of it coming in the second half of the month. The circulation anomalies were weaker, but the Northern Plains were generally under a ridge, consistent with the positive AO. The Southeast continued to have more troughs, which maintained the cool and moist anomalies there.
July 24-31
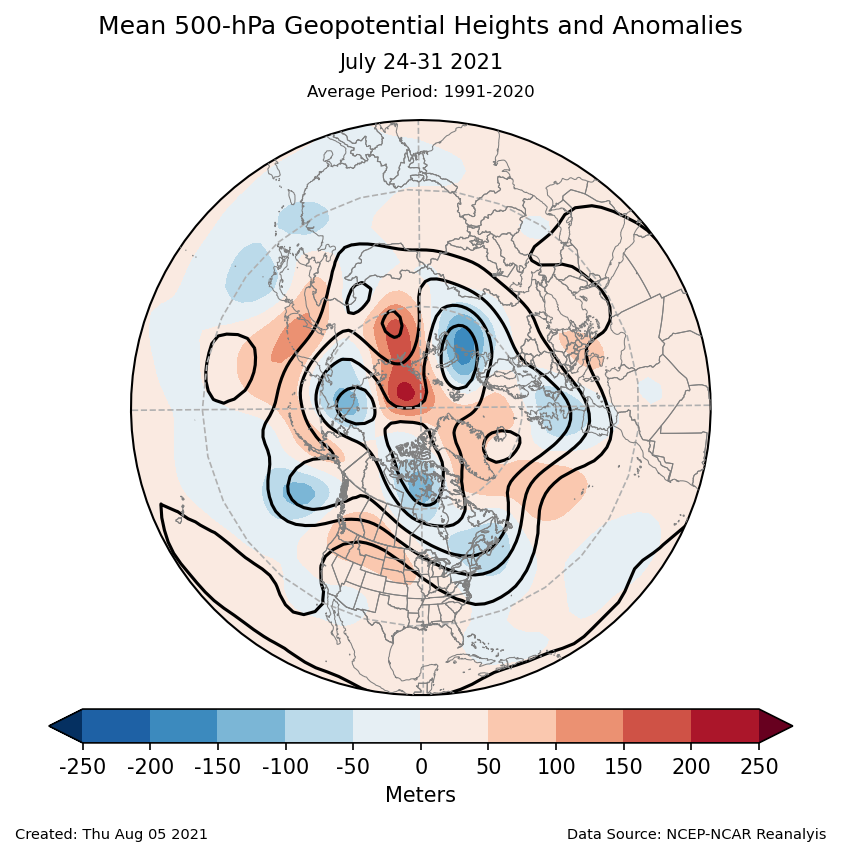
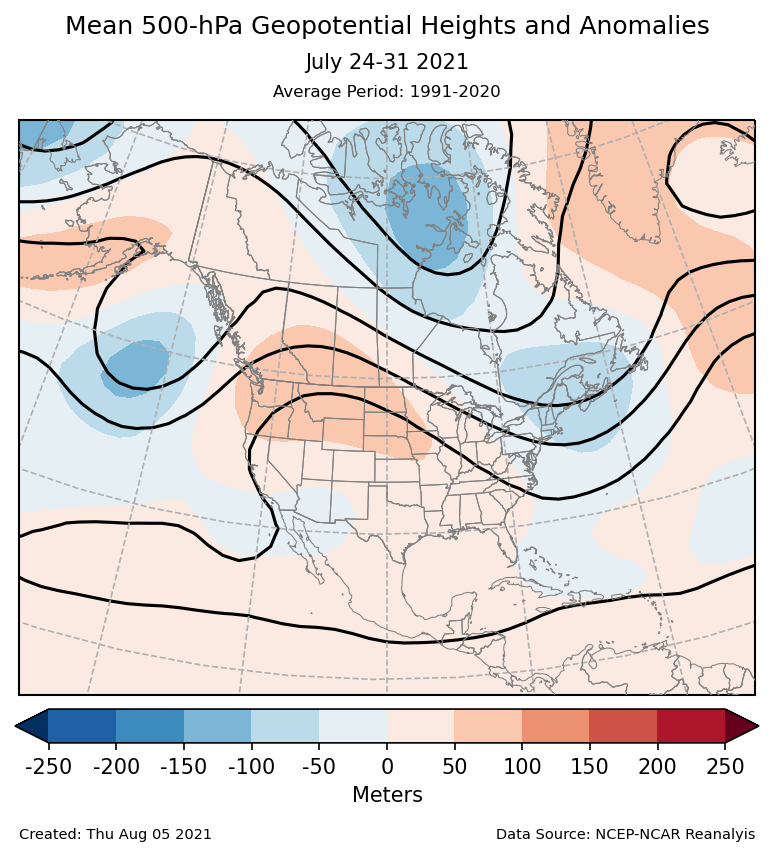
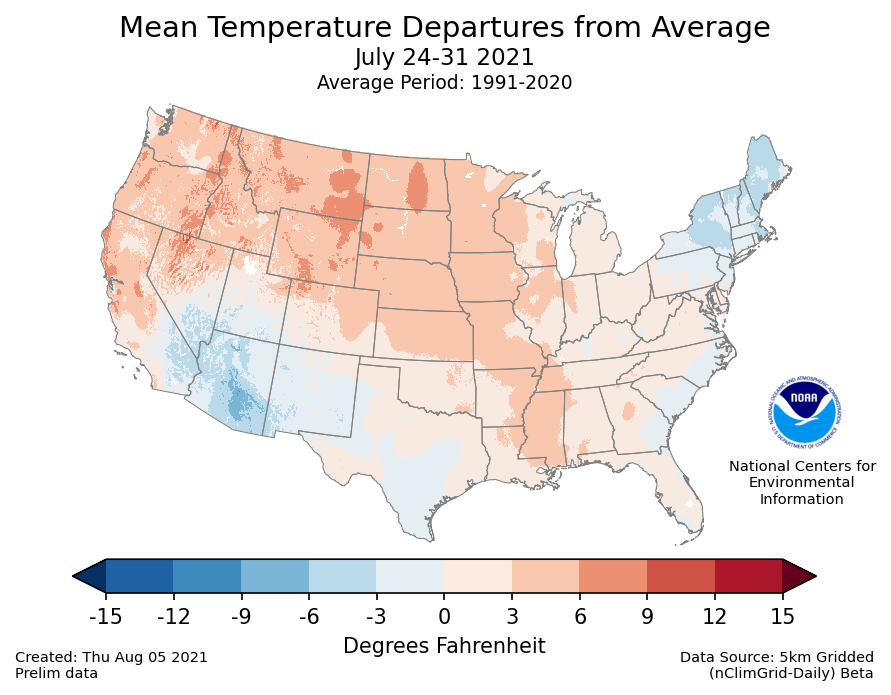
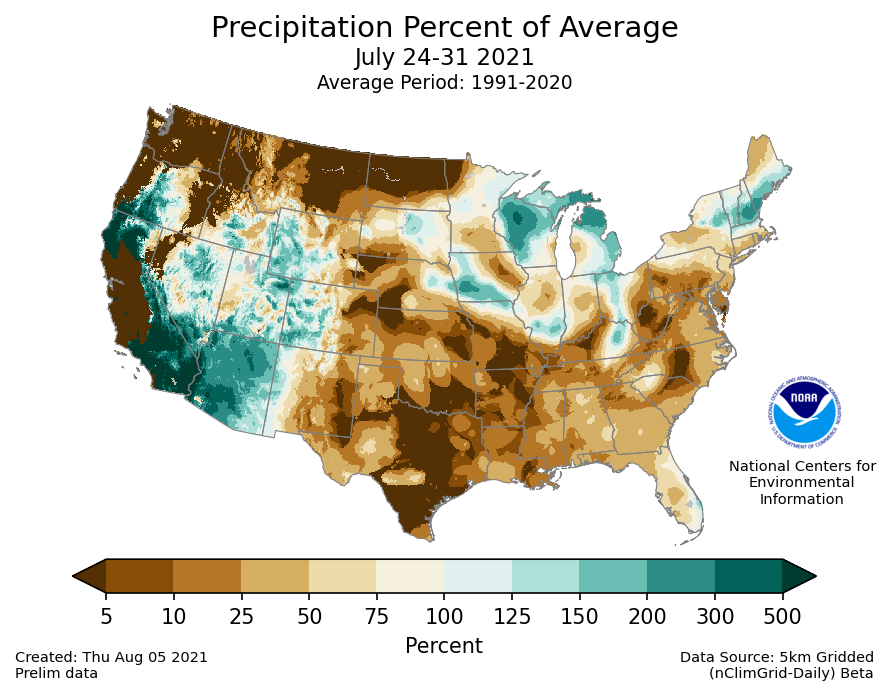
During the final week of July, the ridge returned to the Pacific Northwest and extended to the Southeast. The Southwest monsoon continued to intensify with its moisture extending as far north as central Oregon. This widespread precipitation helped cool temperatures across the Southwest. The ridge brought dry and hot conditions to the Southeast, while a trough over the Canadian Maritimes brought cooler temperatures to New England.
Atmospheric Drivers
ENSO: El Niño Southern Oscillation
- Description: Oceanic and atmospheric conditions in the tropical Pacific Ocean can influence weather across the globe. ENSO is characterized by two extreme modes: El Niño (warmer-than-normal sea surface temperature [SST] anomalies in the tropical Pacific) and La Niña (cooler-than-normal SST anomalies), with the absence of either of these modes termed “ENSO-neutral” conditions. These variations in SST change the locations of the Pacific's largest thunderstorms, which can in turn change circulation patterns around the globe.
- Status: ENSO conditions remained neutral in July. The most common metric for ENSO is the SST anomalies in the Central Pacific, the Niño 3.4 region. These remained weak at around -0.3° in July. The Southern Oscillation Index, which measures the atmospheric response, became more positive. This trend suggests an La Niña-like atmospheric circulation despite the weak SST anomalies.
- Teleconnections (influence on weather): La Niña favors cooler than normal for the western U.S. and the East Coast. It also favors wetter conditions for the Southwest monsoon and drier for the rest of the country. The temperature patterns were not apparent during July, but the Southwest monsoon precipitation did strengthen during the second half of the month.
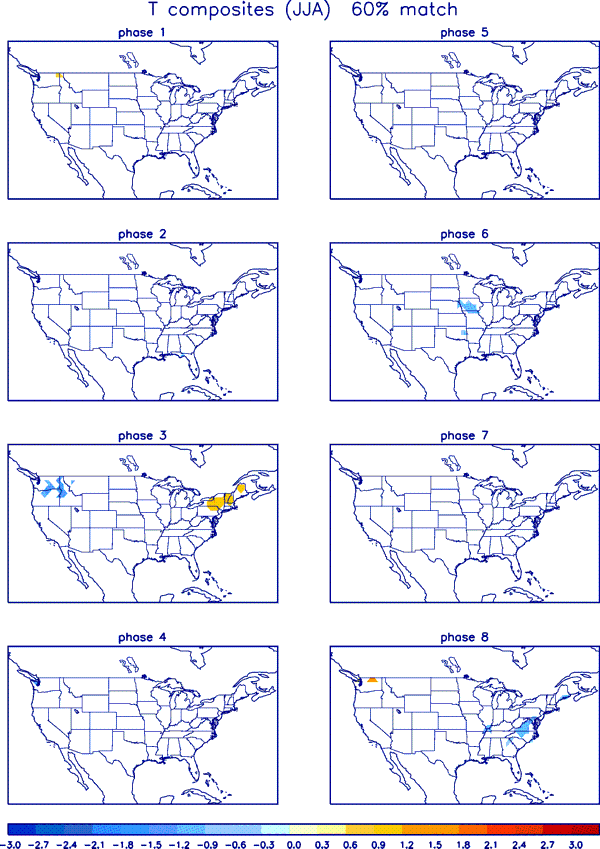
MJO: Madden-Julian Oscillation
- Description: The MJO is the biggest source of subseasonal (31-70 day) tropical variability. It typically develops as a large envelope of tropical thunderstorms that develops over the Indian Ocean that then moves eastward. Like ENSO, the MJO's effects on tropical rainfall is so strong that it can alter the atmospheric circulation around the globe. The thunderstorms decay when they cross the Pacific, but the associated winds can often continue across the Western Hemisphere to initiate the next MJO in the Indian Ocean. The MJO is episodic, meaning that it is not always active. Most indices for tracking the MJO identify both the MJO's amplitude and the longitude of its strongest rainfall, usually described as one of eight phases.
- Status: The MJO was active during the July. The MJO index began the month over the Indian Ocean (phase 2/3), moved across the Maritime Continent (phase 4/5) during the middle of July, and ended the month over the western Pacific (phase 8/1).
- Teleconnections (influence on weather): The MJO's impacts on North American weather tend to be weaker during July, so there were no clear U.S. impacts.
PNA: Pacific/North American pattern
- Description: The PNA teleconnection pattern is associated with strong fluctuations in the strength and location of the East Asian jet stream. PNA-related blocking of the jet stream flow in the Pacific can affect weather downstream over North America, especially the West and especially in the winter half of the year.
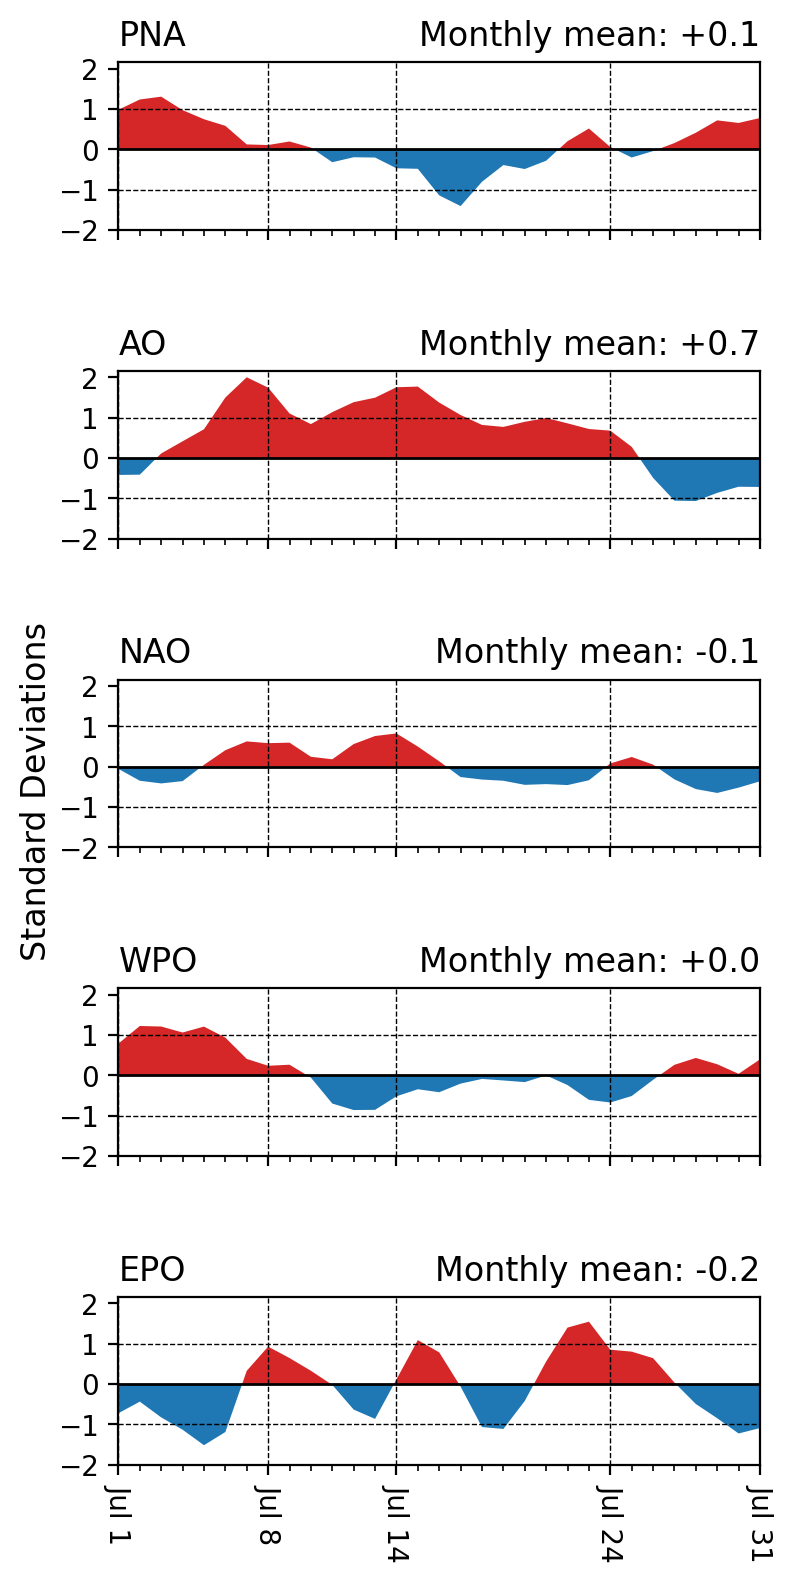
- Status: The daily PNA index was positive during the first week of July and negative around the middle of July. The monthly mean was near zero. The positive PNA early in the month was associated with a trough near the Aleutians, a ridge in the Pacific Northwest, and a trough over the Southeast. These patterns weakened or reversed later in the month when the PNA became negative.
- Teleconnections (influence on weather): The PNA's impact on North American temperatures is usually less during the summer. Even so, the positive PNA would have favored warmer conditions in the Pacific Northwest and cooler in the Southeast with the opposite happening during the negative PNA. The expected anomalies were present with the positive PNA early in the month. The signal was weaker during the negative PNA later in the month, but that was a period of relatively cooler temperatures for the Pacific Northwest.
AO: Arctic Oscillation
- Description: The AO teleconnection pattern generally measures the pressure difference between the low pressure over the North Pole and the higher pressures in the subtropical ridges. This pressure difference is larger during a positive AO, resulting in a stronger midlatitude jet. When the AO is negative, the jet is weaker and will have larger troughs and ridges.
- Status: The daily AO was positive during most of July until the last week of the month. The +2.0 on July 7 was the sixth highest July daily value since 1950. The monthly mean was the fifth most positive for July since 1950. The positive AO was driven by the troughs around the Arctic Ocean and Greenland along with ridges near northwestern Europe, northeastern Asia, the North Pacific, and the Pacific Northwest.
- Teleconnections (influence on weather): The positive AO is typically associated with warmer than normal temperatures for the Northern Plains. These were apparent throughout July, but especially July 1-7 and July 14-23.
NAO: North Atlantic Oscillation
- Description: The NAO teleconnection pattern relates the pressure over the sub-polar low near Greenland and Iceland with the subtropical high over the Central Atlantic. It significantly affects the weather on both sides of the Atlantic.
- Status: The daily NAO was weak during most of July. It exhibited positive values around the middle of the month, but the monthly mean was near zero. The canonical trough near Greenland was present throughout July, but the ridge over the North Atlantic was only apparent near the middle of the month
- Teleconnections (influence on weather): The positive NAO typically favors cooler than normal conditions for the southeast and warmer than normal for the Northern Rockies during the summer. This pattern was apparent throughout the month despite the NAO's low amplitude.
WPO: West Pacific Oscillation
- Description: The WPO teleconnection pattern is a primary mode of low-frequency variability over the North Pacific and reflects zonal and meridional variations in the location and intensity of the East Asian jet stream in the western Pacific.
- Status: The daily WPO index was positive during the first week of July and then weak during the rest of the month. The monthly mean was near zero. The positive WPO early in the month was associated with a trough near the Aleutians and a ridge over the northwestern Pacific.
- Teleconnections (influence on weather): The positive WPO is typically associated with cooler temperatures over the Southwest and the Northeast during summer. Neither of these were apparent during July.
EPO: East Pacific Oscillation
- Description: The EPO pattern identifies variations in the strength and location of the eastern Pacific jet stream. During the positive phase, the jet is stronger and shifted southward. The negative phase is associated with an Alaskan ridge that weakens the jet. The EPO is closely related to the East Pacific–North Pacific (EP–NP) teleconnection pattern, although the two are defined with opposite signs.
- Status: The daily EPO index oscillated frequently between positive and negative values throughout the month. The monthly mean was near-zero.
- Teleconnections (influence on weather): The positive phase of the EPO favors warmer than normal temperatures across the Upper Midwest and cooler along the West Coast with the opposite happening during the negative phase. The negative EPO temperature pattern was apparent during the first week of July. During the rest of the month, the EPO's oscillations were too short to significantly contribute to the weekly means.