Note: This Synoptic Discussion describes recent weather events and climate anomalies in relation to the phenomena that cause the weather. These phenomena include the jet stream, fronts and low pressure systems that bring precipitation, high pressure systems that bring dry weather, and the mechanisms which control these features — such as El Niño, La Niña, and other oceanic and atmospheric drivers (PNA, NAO, AO, and others). The report may contain more technical language than other components of the State of the Climate series.
Summary
| Time Period | Key Driver | Other Drivers |
|---|---|---|
| Month | WPO-, EPO- | NAO-, MJO |
| April 1-7 | NAO- | AO+ |
| April 8-14 | MJO | |
| April 15-23 | WPO-, EPO- | MJO, NAO- |
| April 24-30 | EPO+ |

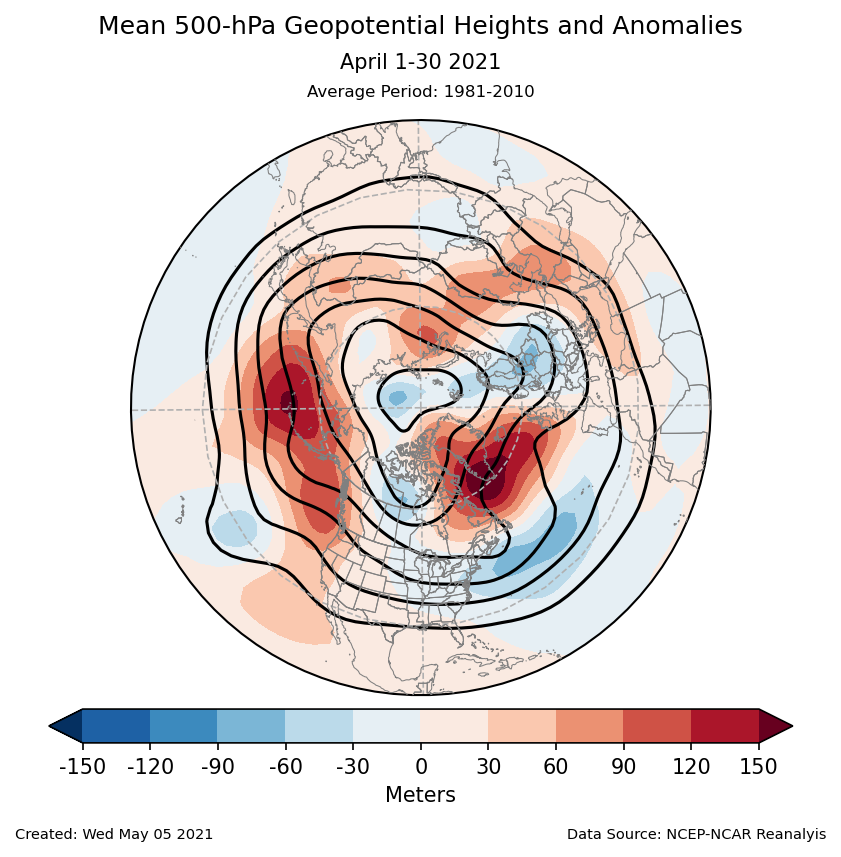
The primary circulation features during April were strong ridges in the far northern Pacific and Atlantic. The Pacific ridge was associated with strongly negative phases of the East Pacific Oscillation (EPO) and the West Pacific Oscillation. The Atlantic ridge was related to a negative North Atlantic Oscillation (NAO) although that ridge was shifted somewhat southward from the canonical negative NAO. Both ridges led to blocking patterns that weakened the jet stream and made for more persistent weather patterns.
The Pacific ridge peaked during April 15-23 when it led to some of the warmest early spring temperatures for Alaska. The southeastward extension of that ridge along the West Coast throughout April also maintained the warm and dry conditions over the Southwest.
The monthly temperature anomalies for April were weak for most of the country, but that is largely because the anomalies from different parts of the month canceled one another. For example, a large swath of the country experienced warm anomalies April 1-7 followed by cool anomalies April 15-23.
Most of the country was dry for the bulk of April under the influence of the Pacific ridge. However, the Great Lakes experienced significant precipitation during April 8-14 with a slow-moving extratropical cyclone. The southern tier of the country experienced enhanced storminess with an active subtropical jet during April 24-30.
Monthly Mean


Submonthly Evolution
April 1-7
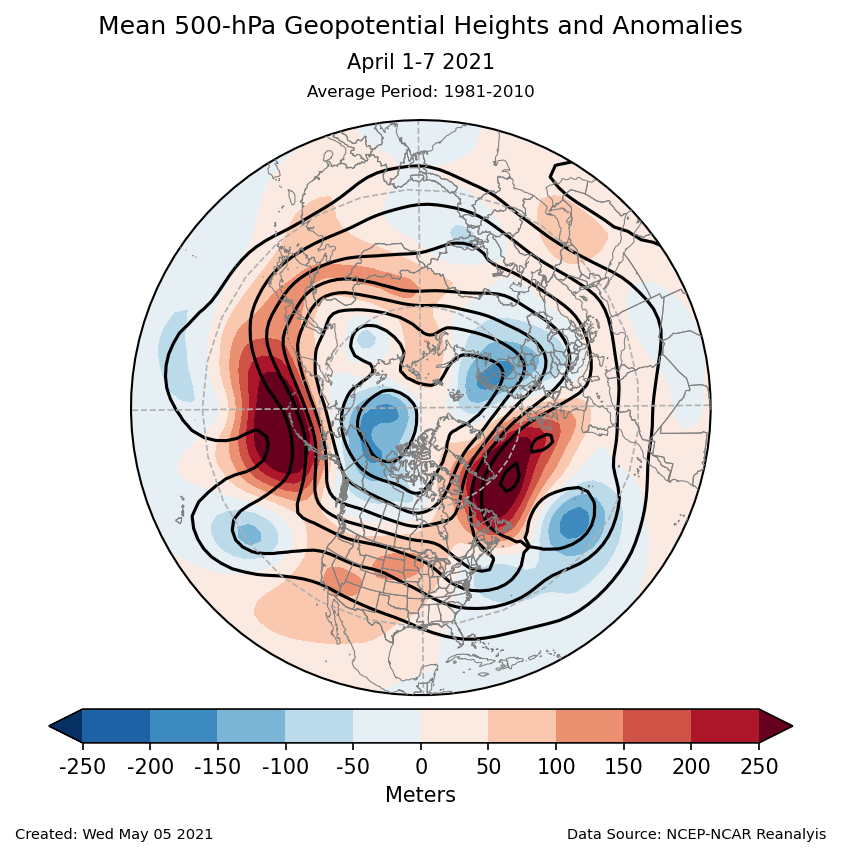


April began with a broad ridge extending from the Southwest to the Great Lakes. Strong ridges over the North Pacific and North Atlantic created blocking patterns that kept the North America ridge in place. The ridge was associated with above-normal temperatures across the western U.S. and the Northern Plains. It also suppressed precipitation across the country. A trough over the central Atlantic extended westward to bring cooler temperatures along the East Coast. Towards the end of the week, a strong cold front began to weaken the warm anomalies over the western U.S. and brought some precipitation to the Northern Plains.
April 8-14
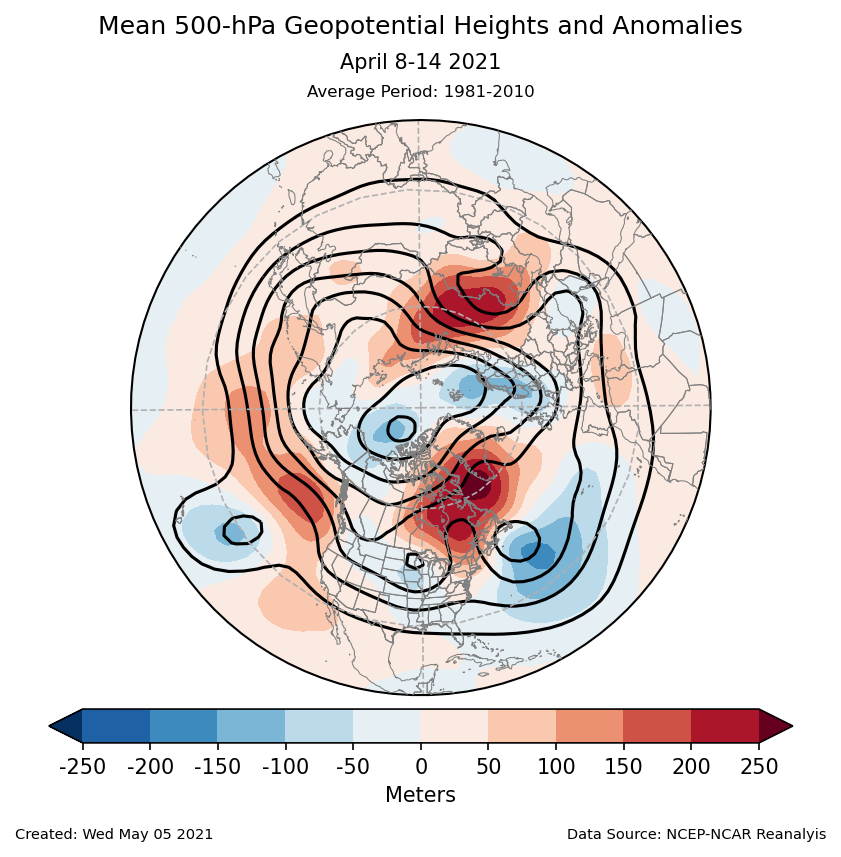


The blocking ridges over the North Pacific and North Atlantic weakened during the second week of April. This allowed a series of shortwave troughs to dig southward from the Beaufort Sea to the central U.S. behind the cold front from the end of the previous week. The ridge that had dominated the country shifted towards the northeast. These shifts in the pattern brought cool temperatures to the northwestern U.S. while the Southwest and Northeast were warmer than normal. A slow-moving extratropical cyclone centered near the Great Lakes brought significant precipitation to the region.
April 15-23
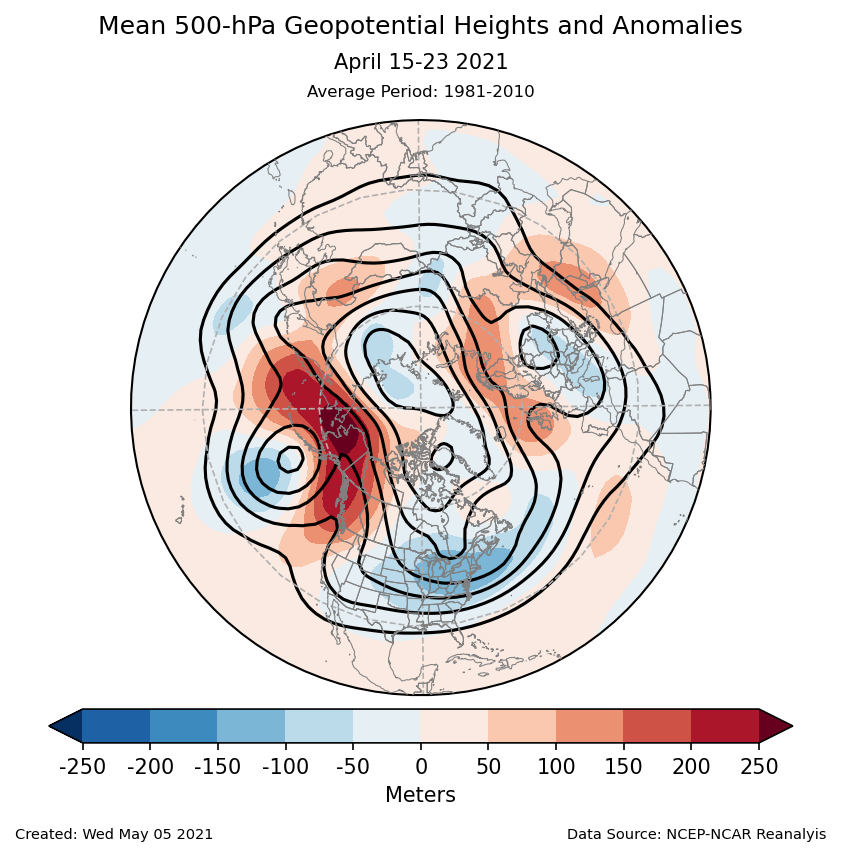

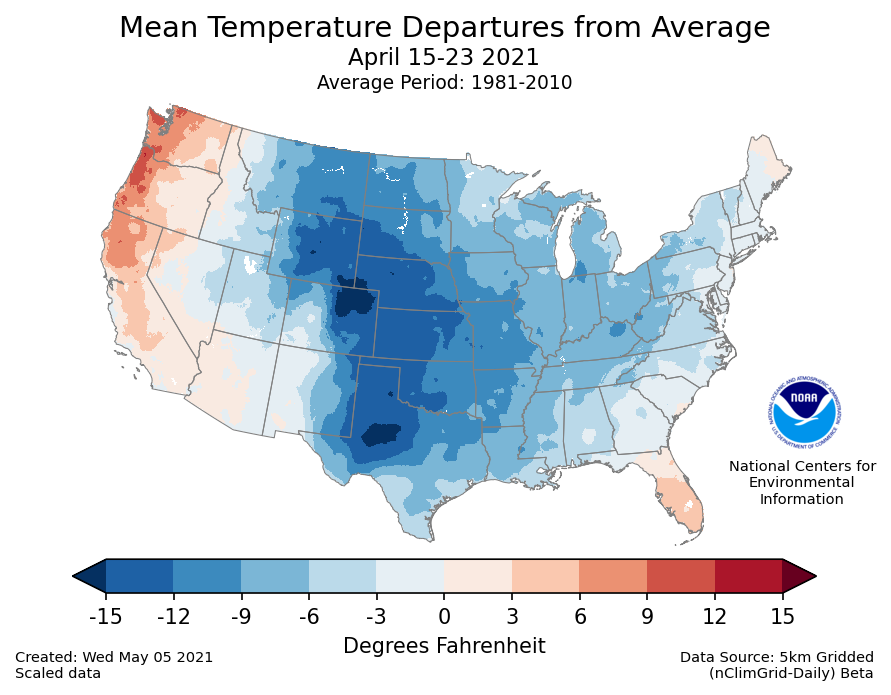

The third week of April featured an exceptionally strong ridge over Alaska in association with negative phases of the EPO and WPO. The northerlies on the east side of that ridge fed another major cold front that led to a cold air outbreak from the Great Plains eastward.
April 24-30

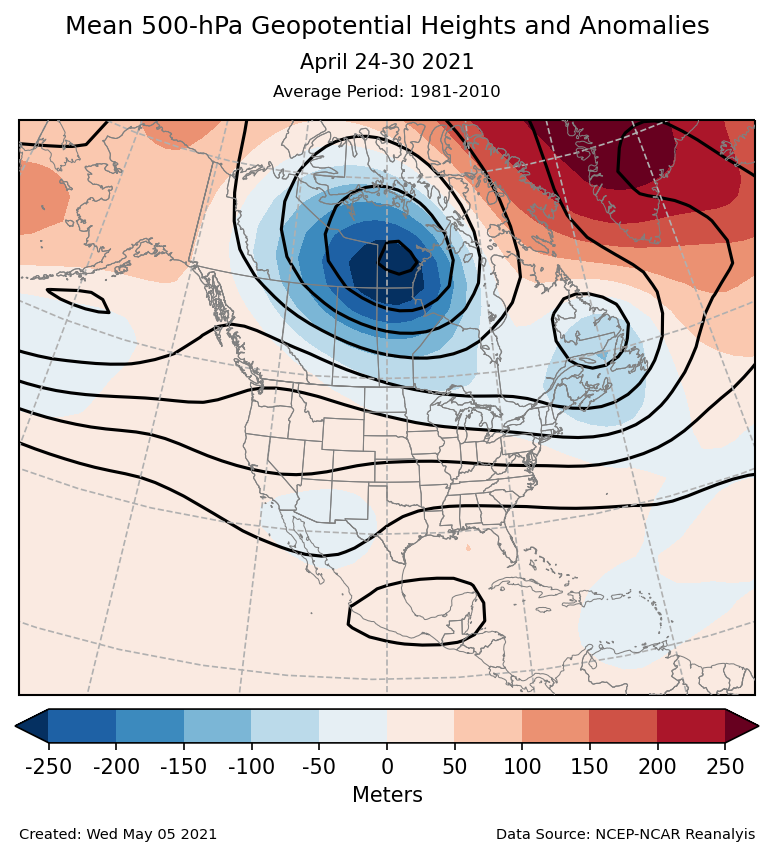

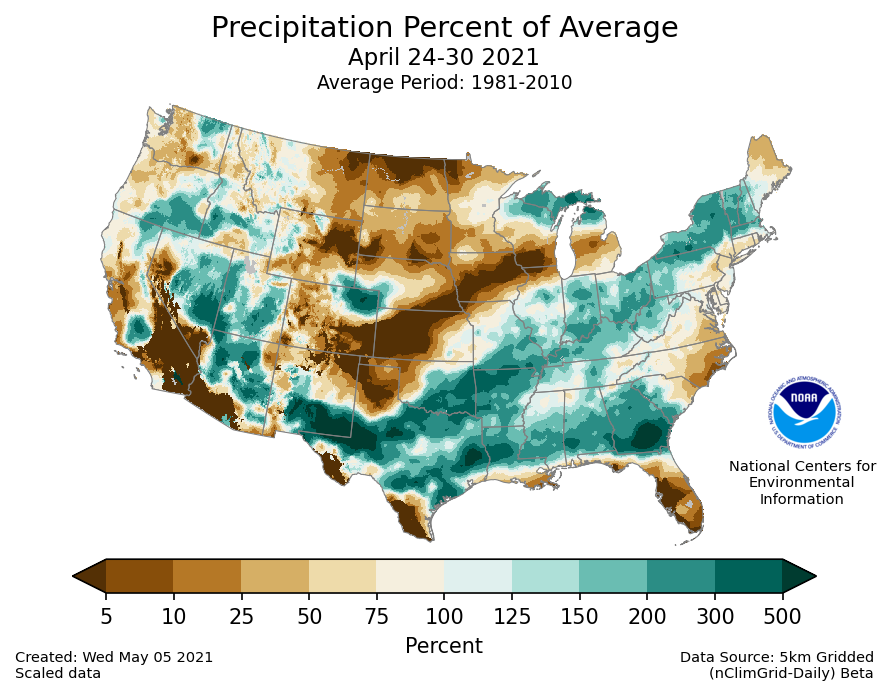
During the final week of April, the ridge over the North Pacific finally weakened, which allowed a more active and propagating weather pattern over North America. The temperature anomalies were more transient during this period. However, the enhanced activity along the subtropical jet brought precipitation to portions of the Southwest and the Southeast including a major hailstorm across Texas and Oklahoma on April 28.
Atmospheric Drivers
ENSO: El Niño Southern Oscillation
- Description: Oceanic and atmospheric conditions in the tropical Pacific Ocean can influence weather across the globe. ENSO is characterized by two extreme modes: El Niño (warmer-than-normal sea surface temperature [SST] anomalies in the tropical Pacific) and La Niña (cooler-than-normal SST anomalies), with the absence of either of these modes termed “ENSO-neutral” conditions. These variations in SST change the locations of the Pacific's largest thunderstorms, which can in turn change circulation patterns around the globe.
- Status: La Niña conditions continued weakening during April. The most common metric for ENSO is the SST anomalies in the Central Pacific, the Niño 3.4 region. These weakened to around -0.5° in April. The Southern Oscillation Index, which measures the atmospheric response, also remained weak during April. Together, these patterns are consistent with the remnants of a weakening La Niña.
- Teleconnections (influence on weather): La Niña favors warmer than normal temperatures near Texas and cooler than normal for the northwest. It also favors drier than normal conditions across the southern U.S., and wetter than normal for the Tennessee Valley and the Pacific Northwest. None of these patterns occurred in April.
MJO: Madden-Julian Oscillation
- Description: The MJO is the biggest source of subseasonal (31-70 day) tropical variability. It typically develops as a large envelope of tropical thunderstorms that develops over the Indian Ocean that then moves eastward. Like ENSO, the MJO's effects on tropical rainfall is so strong that it can alter the atmospheric circulation around the globe. The thunderstorms decay when they cross the Pacific, but the associated winds can often continue across the Western Hemisphere to initiate the next MJO in the Indian Ocean. The MJO is episodic, meaning that it is not always active. Most indices for tracking the MJO identify both the MJO's amplitude and the longitude of its strongest rainfall, usually described as one of eight phases.
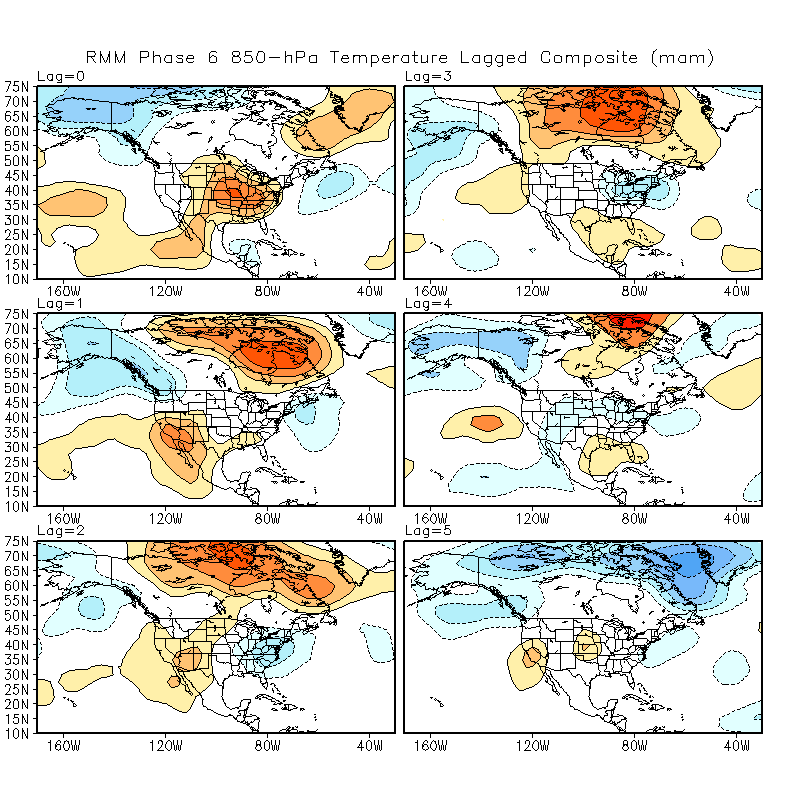
- Status: The MJO was active during April. The MJO index began the month over the Maritime Continent (phases 4/5). It stalled for a week or so over the Western Pacific (phases 6/7) before ending the month with high amplitudes over the Western Hemisphere (phases 8/1). Some of the MJO's large amplitude was due to void left by the receding La Niña signal.
- Teleconnections (influence on weather): The MJO in phase 6 around April 5-11 was consistent with the warm anomalies over the eastern U.S. followed by cold anomalies in the subsequent weeks. Those warm anomalies were observed April 8-14 as were the cold anomalies April 15-23.
PNA: Pacific/North American pattern
- Description: The PNA teleconnection pattern is associated with strong fluctuations in the strength and location of the East Asian jet stream. PNA-related blocking of the jet stream flow in the Pacific can affect weather downstream over North America, especially the West and especially in the winter half of the year.
- Status: The daily PNA index was moderately negative near the beginning and end of April with weak positive values in between. The monthly mean was moderately negative. The negative PNA was primarily driven by the strong ridge in the North Pacific throughout April. However, the rest of the PNA wavetrain was generally missing.
- Teleconnections (influence on weather): A negative PNA would have favored cooler conditions in the Pacific Northwest and warmer in the Southeast. Neither was observed in April due to the weak PNA wavetrain.
AO: Arctic Oscillation
- Description: The AO teleconnection pattern generally measures the pressure difference between the low pressure over the North Pole and the higher pressures in the subtropical ridges. This pressure difference is larger during a positive AO, resulting in a stronger midlatitude jet. When the AO is negative, the jet is weaker and will have larger troughs and ridges.
- Status: The daily AO began April with weak positive values and gradually shifted to moderately negative values by the end of the month. The monthly mean was near zero. The positive AO early in the month was associated with troughs over the Arctic Ocean coupled with strong ridges over the North Pacific and North Atlantic. Meanwhile, the negative AO later on was driven by the collapsing of the oceanic ridges along with the development of a strong ridge over Greenland.
- Teleconnections (influence on weather): Temperatures over the eastern half of the U.S. are typically warmer than normal during a positive AO and cooler during the negative phase. The warmth early in April was shifted northwestward of its typical location for a positive AO, and the cool anomalies did not develop with the negative AO later in the month.
NAO: North Atlantic Oscillation
- Description: The NAO teleconnection pattern relates the pressure over the sub-polar low near Greenland and Iceland with the subtropical high over the Central Atlantic. It significantly affects the weather on both sides of the Atlantic.
- Status: The daily NAO had fluctuated between near zero and moderately negative throughout April. The monthly mean was negative. The negative NAO was driven by a strong ridge near southern Greenland and a trough over the central Atlantic. Its amplitude was limited somewhat because the trough was relatively weak and the ridge was often farther south than would be typical for a negative NAO.
- Teleconnections (influence on weather): The negative NAO typically favors cooler than normal conditions and increased storminess over the eastern U.S. The cool anomalies were most strongly associated with negative NAO during April 1-7. The negative NAO later in the month may have contributed to the winter storm in the Northeast around April 20-22.
WPO: West Pacific Oscillation
- Description: The WPO teleconnection pattern is a primary mode of low-frequency variability over the North Pacific and reflects zonal and meridional variations in the location and intensity of the East Asian jet stream in the western Pacific.
- Status: The daily WPO index was negative for most of April except for some positive values around April 10-12. It was strongly negative around April 21. The monthly mean was strongly negative. The negative WPO was primarily associated with the ridge near the Bering Sea. The stronger values April 15-23 were associated with that ridge moving northward and allowing the trough to develop to its south, which produced a more typical negative WPO pattern.
- Teleconnections (influence on weather): The negative WPO is typically associated with cooler than normal temperatures for the Northern Plains and warmer for the Southwest, both of which were present during the peak of the negative WPO.
EPO: East Pacific Oscillation
- Description: The EPO pattern identifies variations in the strength and location of the eastern Pacific jet stream. During the positive phase, the jet is stronger and shifted southward. The negative phase is associated with an Alaskan ridge that weakens the jet. The EPO is closely related to the East Pacific–North Pacific (EP–NP) teleconnection pattern, although the two are defined with opposite signs.
- Status: The daily EPO index oscillated around zero except for a period of exceptionally negative values around April 16-21. The monthly mean was strongly negative. The negative EPO was associated with the strong ridge near Alaska, which peaked during April 15-23.
- Teleconnections (influence on weather): The negative phase of the EPO favors cooler than normal temperatures across the Upper Midwest and Northeast, which was prominent April 15-23.