Note: This Synoptic Discussion describes recent weather events and climate anomalies in relation to the phenomena that cause the weather. These phenomena include the jet stream, fronts and low pressure systems that bring precipitation, high pressure systems that bring dry weather, and the mechanisms which control these features — such as El Niño, La Niña, and other oceanic and atmospheric drivers (PNA, NAO, AO, and others). The report may contain more technical language than other components of the State of the Climate series.
Summary
| Time Period | Key Driver | Other Drivers |
|---|---|---|
| Month | AO+, WPO+ | EPO+ |
| March 1-9 | AO+, WPO+ | MJO, EPO+ |
| March 10-18 | AO+, WPO+ | EPO+ |
| March 19-31 | La Niña | AO+ |

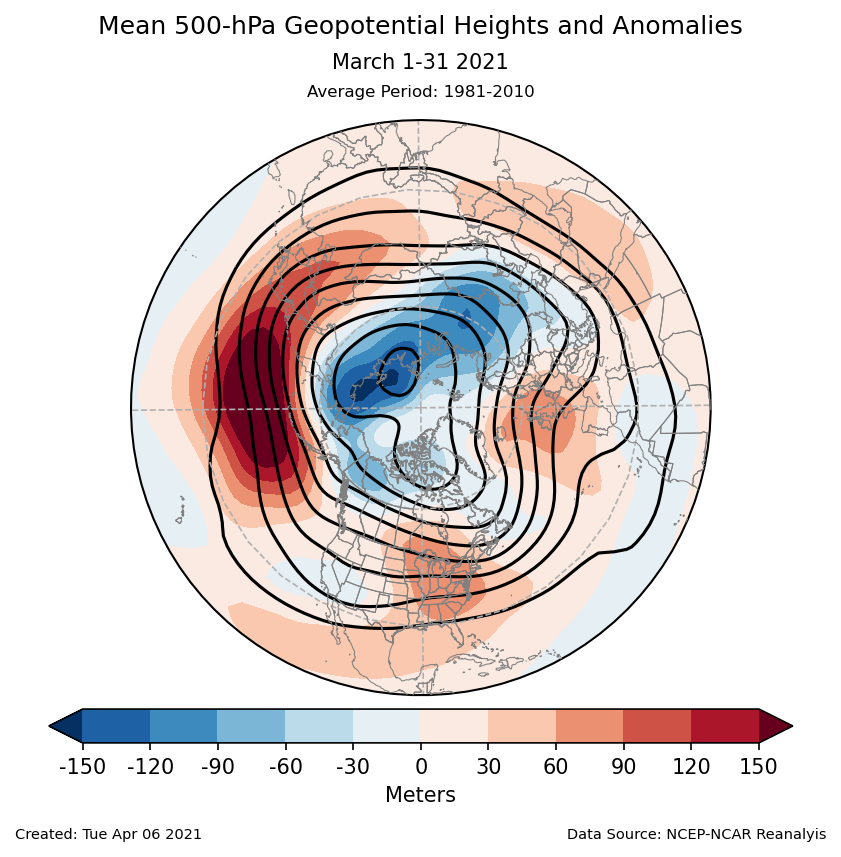
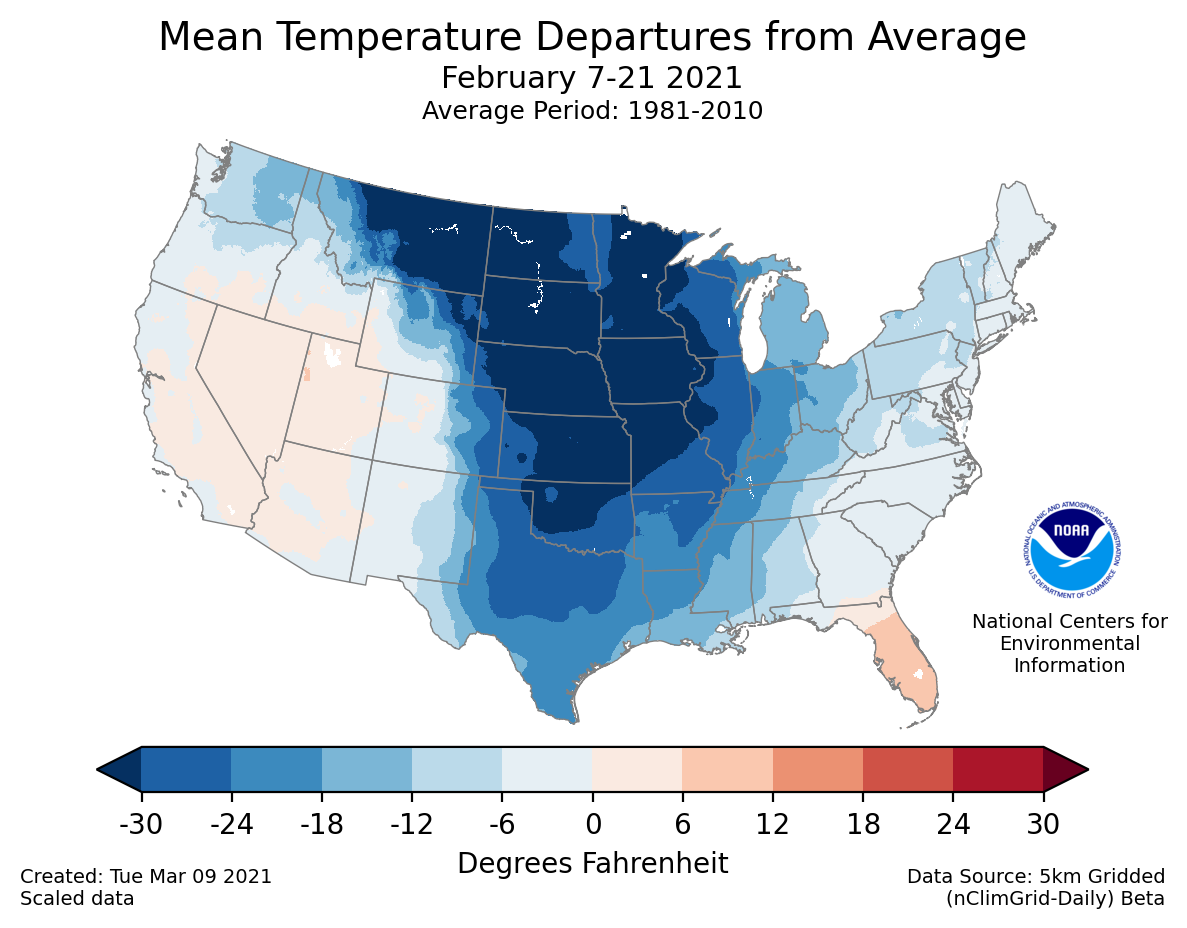
The dominant climate pattern in March was a strongly positive Arctic Oscillation (AO). March 11 was the ninth highest daily AO value since 1950, and the monthly mean was the fifth highest March on record. This signal is particularly noteworthy because February had some of the most negative values on record.
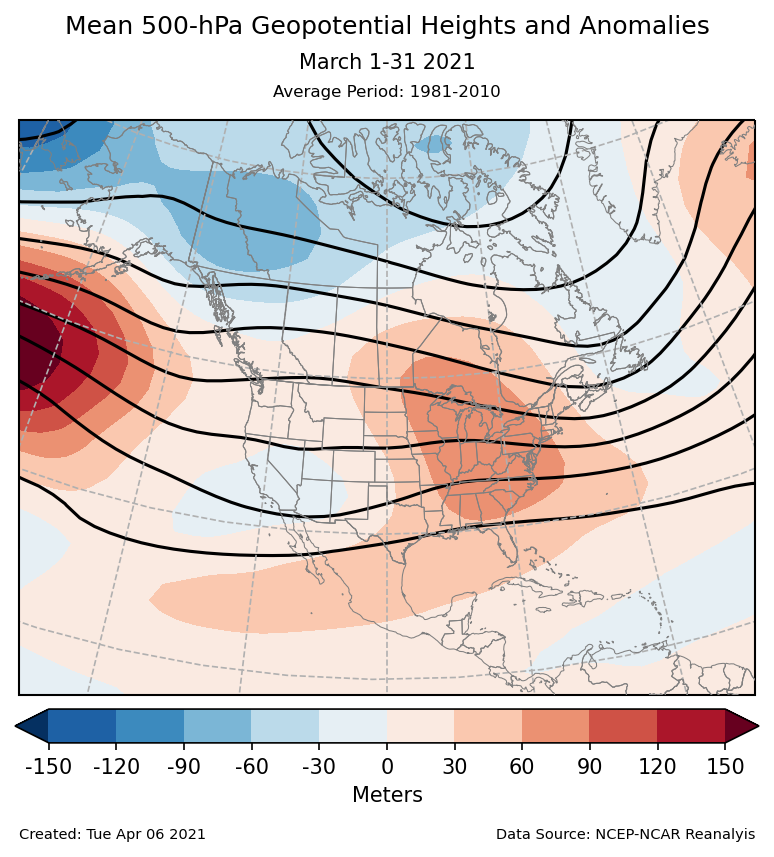
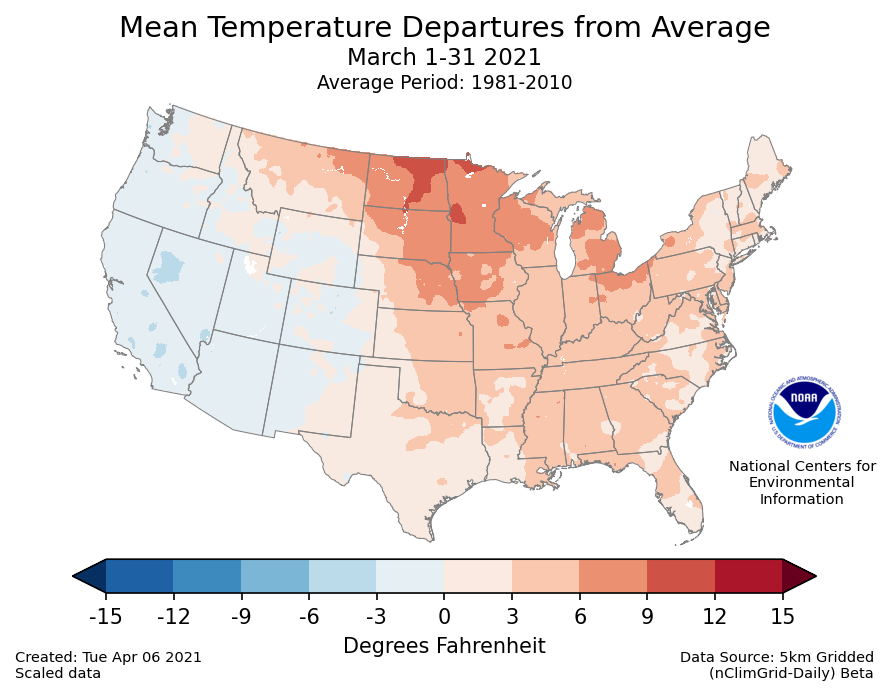
The positive AO was coupled with a strongly positive West Pacific Oscillation (WPO), which shifted the polar vortex towards northeastern Russia with a strong ridge over the North Pacific. This circulation pattern also led to a ridge over the eastern U.S., which contributed to the warm temperatures from the Northern Plains to the Northeast.
The East Pacific Oscillation (EPO) was also positive early in March, which helped extend the ridge towards the southwestern U.S. This pattern weakened later in the month leading to a series of troughs moving across the southern tier. The first of these led to a historic blizzard for the central Rockies and High Plains. The second produce a major tornado outbreak over the Southeast on March 17, which was repeated eight days later by the final trough.
Monthly Mean

Submonthly Evolution
March 1-9
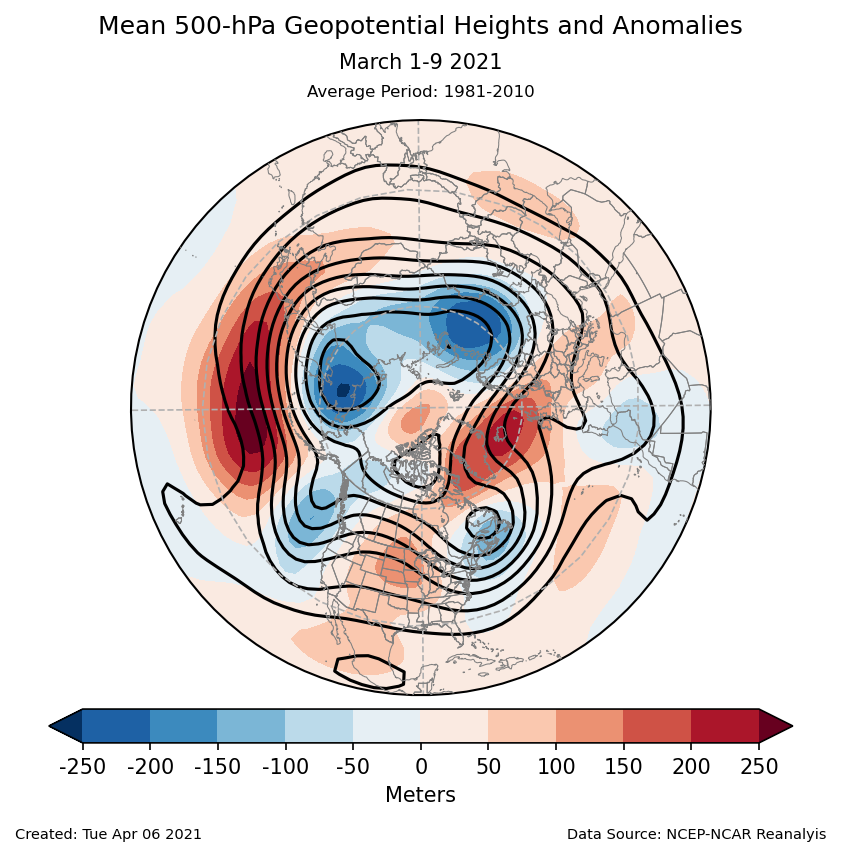


March began with a ridge over the Great Plains that suppressed precipitation across the country. It was also associated with warmer than normal temperatures particularly for the Northern Plains. These anomalies were particularly noteworthy compared with the very cold anomalies from just a few weeks earlier. The ridge was associated with a wavetrain that included a strong ridge over the northwestern Pacific and a trough over the Gulf of Alaska. The northwestern Pacific ridge was part of exceptionally positive AO and WPO signals, while the trough was part of a strongly positive EPO.
March 10-18

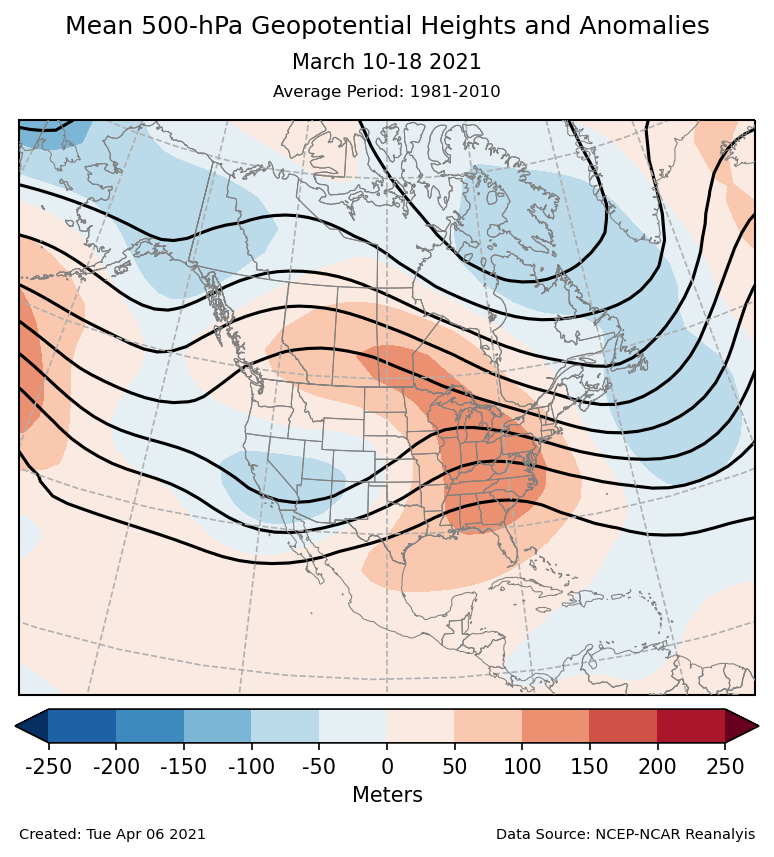
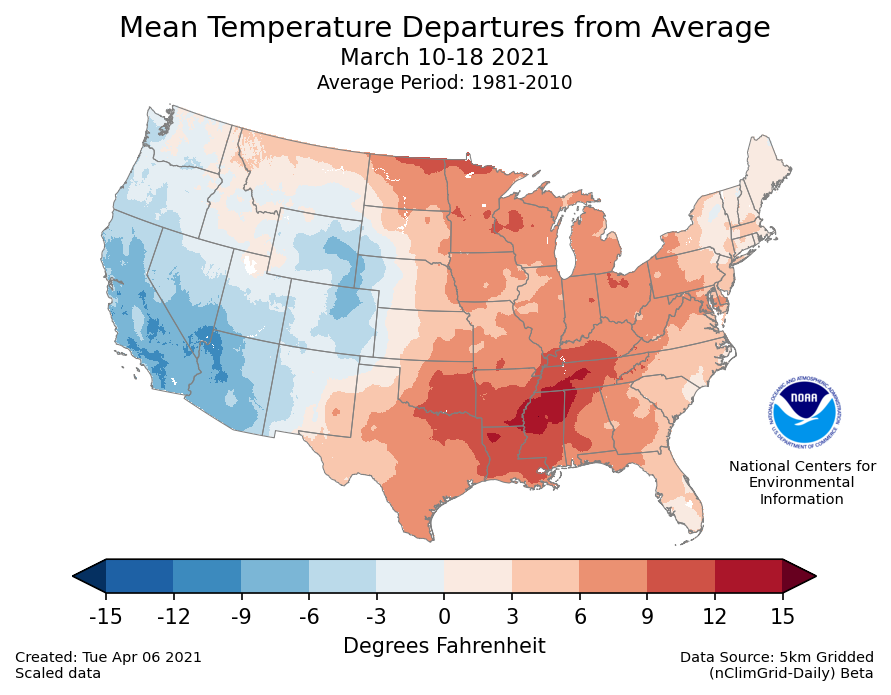

During the middle of March, the trough from the Gulf of Alaska shifted southwestward, and the ridge moved from the Plains to the East Coast. The trough over the Southwest led to cold anomalies there. As it moved eastward, it also spawned a strong surface cyclone that led to a historic blizzard for the central Rockies and High Plains. A subsequent trough propagated across the southern tier and led to the first of two significant tornado outbreaks for the Southeast.
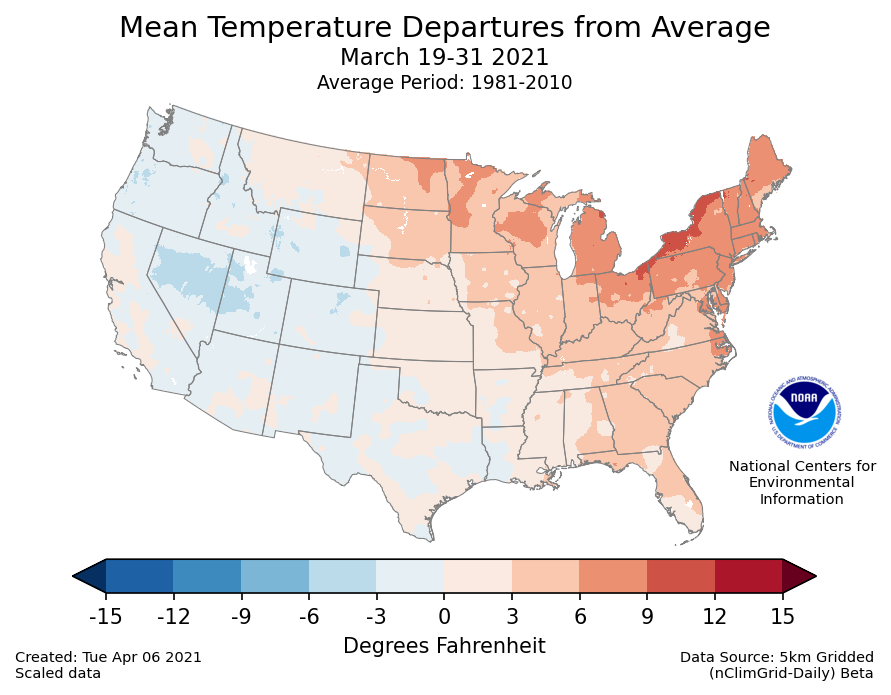
March 19-31


The latter part of March featured a more propagating pattern with a series of troughs and ridges moving across North America. On average, the troughs were strongest in the western U.S. and the ridges dominated the Northeast. The last of these troughs led to a second tornado outbreak over the Southeast and flooding to Tennessee.
Atmospheric Drivers
ENSO: El Niño Southern Oscillation
- Description: Oceanic and atmospheric conditions in the tropical Pacific Ocean can influence weather across the globe. ENSO is characterized by two extreme modes: El Niño (warmer-than-normal sea surface temperature [SST] anomalies in the tropical Pacific) and La Niña (cooler-than-normal SST anomalies), with the absence of either of these modes termed “ENSO-neutral” conditions. These variations in SST change the locations of the Pacific's largest thunderstorms, which can in turn change circulation patterns around the globe.
- Status: La Niña conditions weakened during March. The most common metric for ENSO is the SST anomalies in the Central Pacific, the Niño 3.4 region. These weakened from -1°C in February to -0.8° in March. However, it is still consistent with the ongoing La Niña. The Southern Oscillation Index, which measures the atmospheric response, also weakened substantially in March.
- Teleconnections (influence on weather): La Niña favors warmer than normal temperatures for the Southeast and cooler than normal for the northwest. It also favors drier than normal conditions across the southern U.S., and wetter than normal for the Tennessee Valley and the Pacific Northwest. The temperature pattern was not observed during March, but the enhanced precipitation over the Tennessee Valley was particularly prominent during March 19-31.
MJO: Madden-Julian Oscillation
- Description: The MJO is the biggest source of subseasonal (31-90 day) tropical variability. It typically develops as a large envelope of tropical thunderstorms that develops over the Indian Ocean that then moves eastward. Like ENSO, the MJO's effects on tropical rainfall is so strong that it can alter the atmospheric circulation around the globe. The thunderstorms decay when they cross the Pacific, but the associated winds can often continue across the Western Hemisphere to initiate the next MJO in the Indian Ocean. The MJO is episodic, meaning that it is not always active. Most indices for tracking the MJO identify both the MJO's amplitude and the longitude of its strongest rainfall, usually described as one of eight phases.
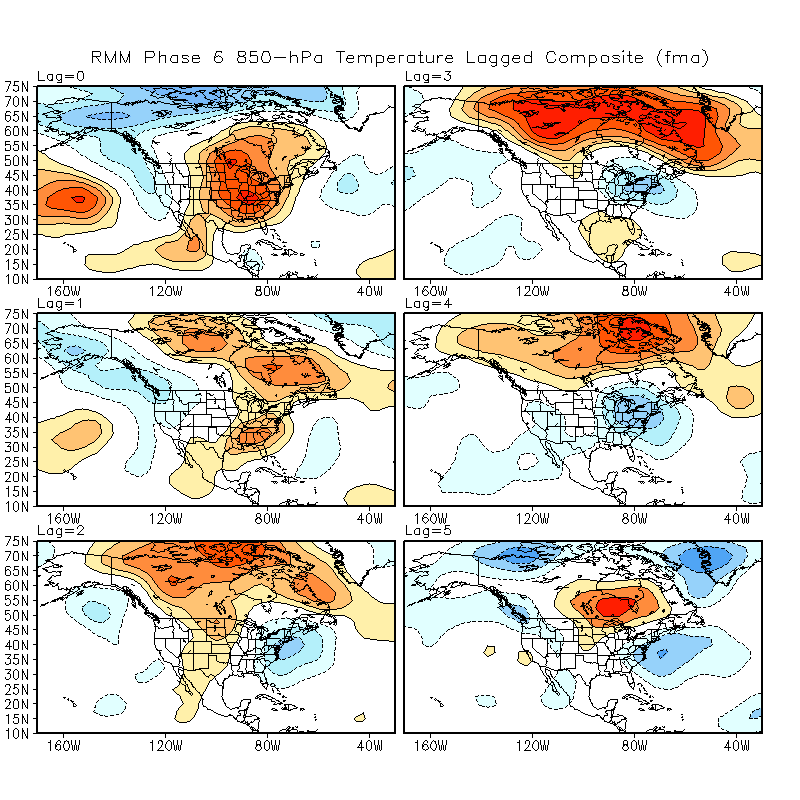
- Status: The MJO was active during March. The MJO index began the month in western Pacific (phases 6/7) and propagated smoothly to the Western Hemisphere (phases 8/1) by mid-month. After stalling there for a few days, the MJO continued across the Indian Ocean (phases 2/3) and ended the month over the Maritime Continent (phases 4/5).
- Teleconnections (influence on weather): The MJO in phase 6 at the start of March was consistent with the warm anomalies observed March 1-9. However, those would usually be followed by cold anomalies in the subsequent weeks, which were not observed.
PNA: Pacific/North American pattern
- Description: The PNA teleconnection pattern is associated with strong fluctuations in the strength and location of the East Asian jet stream. PNA-related blocking of the jet stream flow in the Pacific can affect weather downstream over North America, especially the West and especially in the winter half of the year.
- Status: The daily PNA index was weakly negative during most of March. The monthly mean was negative. The negative PNA was associated with the ridges over the North Pacific and eastern North America. However, the trough over the West Coast was weaker than normal, which limited the PNA's amplitude.
- Teleconnections (influence on weather): A negative PNA would have favored cooler conditions in the Pacific Northwest and warmer in the Southeast. However, the lack of a strong PNA signal in March precluded any significant impacts.
AO: Arctic Oscillation
- Description: The AO teleconnection pattern generally measures the pressure difference between the low pressure over the North Pole and the higher pressures in the subtropical ridges. This pressure difference is larger during a positive AO, resulting in a stronger midlatitude jet. When the AO is negative, the jet is weaker and will have larger troughs and ridges.
- Status: The daily AO was strongly positive during March. The peak on March 11 was the ninth highest daily value since 1950 and the third highest for a day in March. The monthly mean AO was the fifth highest March value since 1950. These positive values are particularly noteworthy because February had some of the most negative AO values on record. The positive AO in March was driven by an enhanced trough near northwestern Siberia coupled with a strong ridge over the North Pacific.
- Teleconnections (influence on weather): Temperatures over the eastern half of the U.S. are typically warmer than normal during a positive AO. That pattern was prominent throughout the month.
NAO: North Atlantic Oscillation
- Description: The NAO teleconnection pattern relates the pressure over the sub-polar low near Greenland and Iceland with the subtropical high over the Central Atlantic. It significantly affects the weather on both sides of the Atlantic.
- Status: The daily NAO had weakly positive values during most of March. The monthly mean was positive. The low amplitude NAO was unusual given the high amplitude AO. During March, the positive AO circulation was shifted towards Russia. As a result, the ridges over the North Atlantic was weaker and shifted farther north, which disrupted the typical NAO pattern.
- Teleconnections (influence on weather): The positive NAO typically favors warmer than normal conditions and decreased storminess over the eastern U.S. The warm anomalies were a fixture in March, but the associated ridge did not align well with the canonical positive NAO.
WPO: West Pacific Oscillation
- Description: The WPO teleconnection pattern is a primary mode of low-frequency variability over the North Pacific and reflects zonal and meridional variations in the location and intensity of the East Asian jet stream in the western Pacific.
- Status: The daily WPO index was strongly positive during most of March except for some negative values near the end of the month. The monthly mean was strongly positive in association with a strong ridge in the northwestern Pacific and a trough near northeastern Russia. These features were strongest early in the month when the WPO was its most positive.
- Teleconnections (influence on weather): The positive WPO is typically associated with warmer than normal temperatures from the Northern Plains to the Great Lakes, which were present throughout the month.
EPO: East Pacific Oscillation
- Description: The EPO pattern identifies variations in the strength and location of the eastern Pacific jet stream. During the positive phase, the jet is stronger and shifted southward. The negative phase is associated with an Alaskan ridge that weakens the jet. The EPO is closely related to the East Pacific–North Pacific (EP–NP) teleconnection pattern, although the two are defined with opposite signs.
- Status: The daily EPO index experienced large oscillations during March with strongly positive values during the early and middle parts of the month and negative values near the end. The monthly mean was weakly positive. The positive EPO early in March was driven primarily by a trough in the Gulf of Alaska. That trough was replaced with a ridge later in the month, which led to the negative values.
- Teleconnections (influence on weather): The negative phase of the EPO favors warmer than normal temperatures across the Upper Midwest and Northeast. That pattern was prominent in the March mean, but the opposite cool signal did not materialize with the negative EPO later in the month.