Note: This Synoptic Discussion describes recent weather events and climate anomalies in relation to the phenomena that cause the weather. These phenomena include the jet stream, fronts and low pressure systems that bring precipitation, high pressure systems that bring dry weather, and the mechanisms which control these features — such as El Niño, La Niña, and other oceanic and atmospheric drivers (PNA, NAO, AO, and others). The report may contain more technical language than other components of the State of the Climate series.
Summary
| Time Period | Key Driver | Other Drivers |
|---|---|---|
| Month | PNA- |
AO+, EPO- |
| March 1-6 | AO+ |
EPO+ |
| March 7-12 | AO+ | |
| March 13-23 | EPO-, PNA- |
MJO, WPO- |
| March 24-31 | PNA- |
The main driver of climate variability in March was a persistently negative Pacific/North American (PNA) pattern that featured a ridge over the North Pacific, a trough along the West Coast, and a ridge in the Southeast. The trough brought cooler than normal temperatures to the West Coast. For much of the month, it was also associated with a trough off the coast of California that brought much-needed moisture to the Southwest. At times, that moisture came too quickly and led to flash flooding. The ridge over the Southeast brought hot and dry conditions, particularly for the Gulf Coast and Florida where they led to a flash drought.
The other two major factors for March were a continuing positive Arctic Oscillation (AO) and variations in the East Pacific Oscillation (EPO). Alaska found itself wedged between a strong polar low associated with the positive AO and the ridge in the North Pacific. Early in the month, the positive EPO enhanced the polar trough over Alaska, continuing the below normal temperatures there from February. As the EPO transitioned to negative later in the month, the ridge intensified and expanded over Alaska. The resulting warm temperatures largely countered the below-normal temperatures from earlier in the month, resulting in near-normal conditions for the month as a whole.
Monthly Mean


Submonthly Evolution
March 1-6


March began with warm temperatures along the Mississippi Valley in advance of a strong cold front. That warm, moist air fueled a deadly tornado outbreak in Tennessee. It also brought heavy rain to a swath of the southeast. Conspicuously, none of that precipitation fell on the Gulf Coast, including Florida, a pattern that would continue throughout the month. The rest of the CONUS was dry during this period. Meanwhile, Alaska continued to be influenced by the polar trough that brought below normal temperatures there in February.
March 7-12


During March 7-12, a ridge in the central U.S. brought warm temperatures across much of the country. Meanwhile, a trough developed off the California coast. Moisture from that trough brought much-needed precipitation to the Southwest U.S. and southern California.
March 13-23


A strong ridge developed over Alaska in the middle of March. To its south, a trough persisted near the California coast, and the ridge over the eastern U.S. strengthened and moved southeastward. The resulting pattern combined aspects of both the negative PNA and the negative EPO. The ridge over Alaska brought warm temperatures that largely countered the cooler anomalies from earlier in the month. The trough near California continued to bring moisture to the Southwest. While the moisture was needed to counter drought conditions, it came too quickly and led to flash flooding. This trough was also connected to a broader trough in eastern Canada that brought cool anomalies to the Northern Plains and precipitation to much of the central U.S. However, the ridge to its east continued the hot and dry conditions for the Southeast.
March 24-31


The California trough weakened during the final week of March and the ridge near Alaska moved southwestward. The resulting pattern was a more typical negative PNA. Without the trough off the coast of California, the wet conditions over the Southwest came to an end. However, the remaining larger scale trough continued to bring below-normal temperatures to the western U.S. The ridge in the Southeast continued the hot and dry conditions for the Gulf Coast.
Atmospheric Drivers

ENSO: El Niño Southern Oscillation
- Description: Oceanic and atmospheric conditions in the tropical Pacific Ocean can influence weather across the globe. ENSO is characterized by two extreme modes: El Niño (warmer-than-normal sea surface temperature [SST] anomalies in the tropical Pacific) and La Niña (cooler-than-normal SST anomalies), with the absence of either of these modes termed “ENSO-neutral” conditions. These variations in SST change the locations of the Pacific's largest thunderstorms, which can in turn change circulation patterns around the globe.
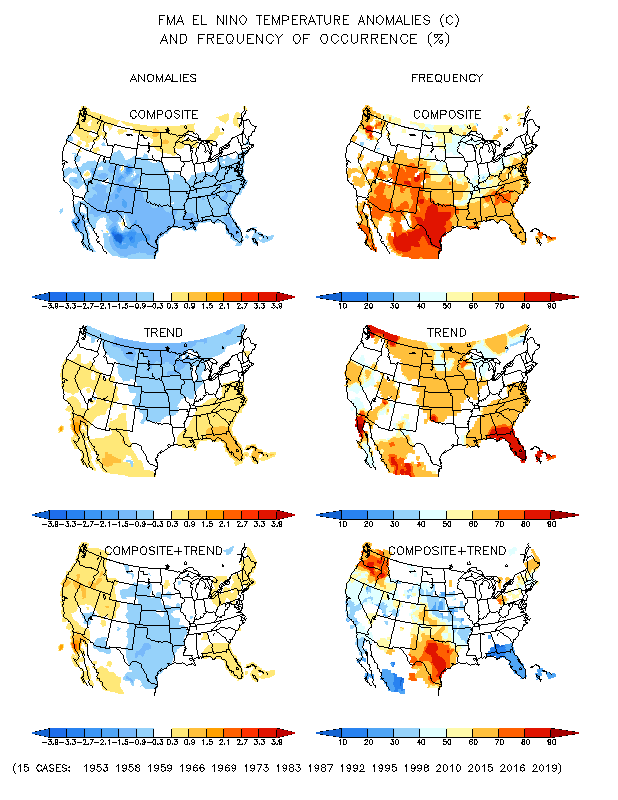
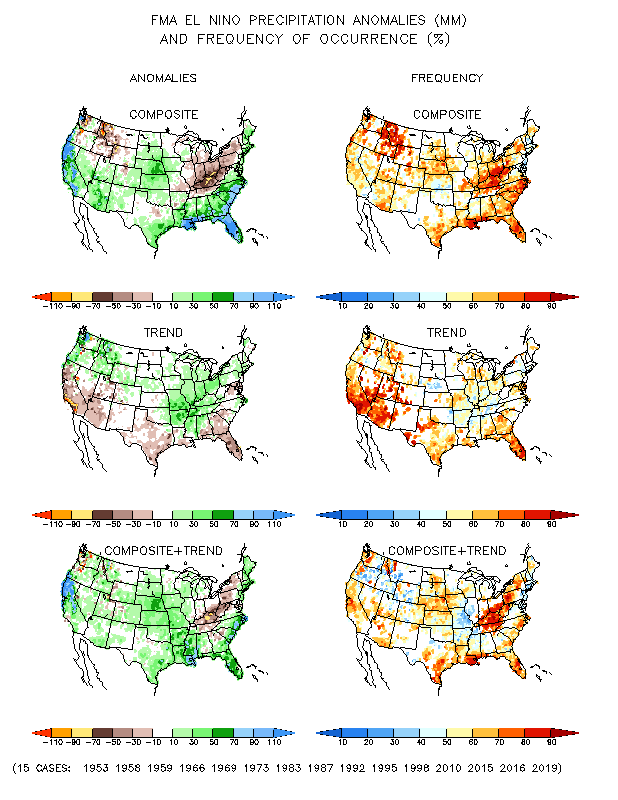
- Status: The ocean and atmosphere system continued to be in ENSO-neutral during March 2020. The most common metric for ENSO is the SST anomalies in the Central Pacific, the Niño 3.4 region. These have been moderately warm since October after being near-zero in August and September. However, they have not been sustained for long enough to qualify as an El Niño and the atmospheric coupling is still lacking.
- Teleconnections (influence on weather): The teleconnections with ENSO are muted during near-neutral conditions. An active El Niño would have favored cooler and wetter than normal conditions in the Southeastern U.S. as well as warm and dry conditions in the Ohio Valley. The wet conditions in the Southeast were a bit farther north than typical for an El Niño, and the temperature anomalies did not transpire. An El Niño would have also favored enhanced precipitation in the Southwest, particularly northern California. These were present in March 2020, but they were concentrated farther south and east than typical.
MJO: Madden-Julian Oscillation
- Description: The MJO is the biggest source of subseasonal (31-60 day) tropical variability. It typically develops as a large envelope of tropical thunderstorms that develops over the Indian Ocean that then moves eastward. Like ENSO, the MJO's effects on tropical rainfall is so strong that it can alter the atmospheric circulation around the globe. The thunderstorms decay when they cross the Pacific, but the associated winds can often continue across the Western Hemisphere to initiate the next MJO in the Indian Ocean. The MJO is episodic, meaning that it is not always active. Most indices for tracking the MJO identify both the MJO's amplitude and the longitude of its strongest rainfall, usually described as one of eight phases.
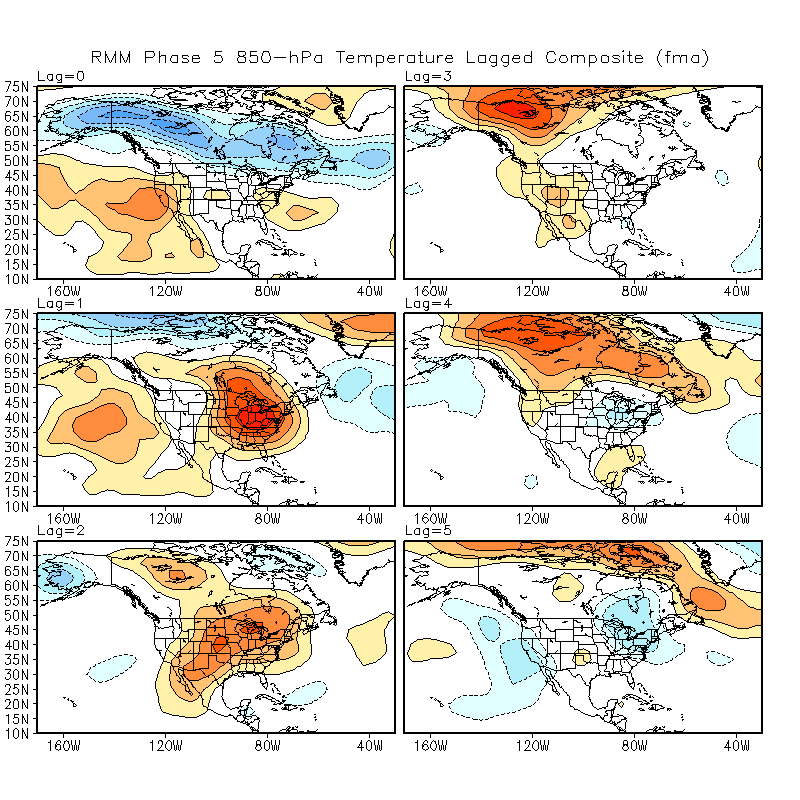
- Status: The MJO was moderately active during March. The most commonly used MJO index began and ended the month near the Maritime Continent (phase 4). The index weakened in the middle of the month as the MJO traversed the Western Hemisphere (phases 7 and 8), but it strengthened again as the MJO entered the Indian Ocean (phases 1 and 2).
- Teleconnections (influence on weather): The MJO's projection onto phase 5 (Maritime Continent) early in the month favored the warmer temperatures in the Eastern U.S. in the following weeks, although it occurred farther south than would be typical.
PNA: Pacific/North American pattern
- Description: The PNA teleconnection pattern is associated with strong fluctuations in the strength and location of the East Asian jet stream. PNA-related blocking of the jet stream flow in the Pacific can affect weather downstream over North America, especially the West and especially in the winter half of the year.
- Status: The daily PNA index was negative during the entire month, particularly near the end of the month. It was strongly negative when averaged over the month. The March 2020 circulation was a canonical negative PNA with a strong ridge over the North Pacific, a trough along the West Coast, and a ridge in the southeastern U.S.
- Teleconnections (influence on weather): A positive PNA favors cooler temperatures along the West Coast and warmer temperatures over the Southeast. That pattern was most apparent towards the end of the month, consistent with the stronger negative signal then. The negative PNA was also consistent with the above-normal temperatures in Alaska later in the month.
AO: Arctic Oscillation
- Description: The AO teleconnection pattern generally measures the pressure difference between the low pressure over the North Pole and the higher pressures in the subtropical ridges. This pressure difference is larger during a positive AO, resulting in a stronger midlatitude jet. When the AO is negative, the jet is weaker and will have larger troughs and ridges.
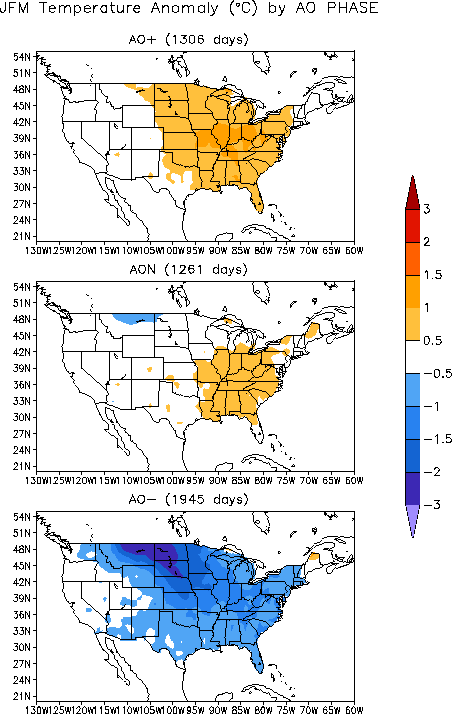
- Status: The daily AO was strongly positive until the final days of the month when it became neutral. The monthly average was strongly positive. The positive AO was primarily driven by the strong ridge in the North Pacific and the anomalous trough near the North Pole.
- Teleconnections (influence on weather): The positive AO is associated with warmer than average temperatures east of the Rockies, which were particularly prominent in the first half of the month (March 1-6 and March 7-12).
NAO: North Atlantic Oscillation
- Description: The NAO teleconnection pattern relates the pressure over the sub-polar low near Greenland and Iceland with the subtropical high over the Central Atlantic. It significantly affects the weather on both sides of the Atlantic.
- Status: The daily NAO was neutral at the beginning and end of March and moderately positive in between. The monthly average was positive, largely due to the trough extending from the North Pole towards Greenland and the ridge in the North Atlantic. Both features were strongest in the middle of the month.
- Teleconnections (influence on weather): The warm temperatures over the Southeast in the middle of March would be more consistent with a positive NAO in January. In spring, those warm anomalies are usually more toward the Midwest, as they were earlier in the month.
WPO: West Pacific Oscillation
- Description: The WPO teleconnection pattern is a primary mode of low-frequency variability over the North Pacific and reflects zonal and meridional variations in the location and intensity of the East Asian jet stream in the western Pacific.
- Status: The daily WPO index had a lot of fluctuations during March. It was weakly positive early in the month and then had two strongly negative episodes later. The monthly average was weakly positive. The variations were primarily associated with transient westward extensions of the North Pacific ridge. However, these patterns were distinctly more associated with the central and eastern Pacific.
- Teleconnections (influence on weather): The negative WPO is typically associated with cooler than normal temperatures over the Northern Plains, which were present in the middle month when the WPO was negative.
EPO: East Pacific Oscillation
- Description: The EPO pattern identifies variations in the strength and location of the eastern Pacific jet stream. During the positive phase, the jet is stronger and shifted southward. The negative phase is associated with an Alaskan ridge that weakens the jet. The EPO is closely related to the East Pacific–North Pacific (EP–NP) teleconnection pattern, although the two are defined with opposite signs.
- Status: The daily EPO index was moderately positive at the beginning of the month, strongly negative in the middle, and then neutral towards the end. Averaged over March, the EPO was negative due primarily to the ridge near Alaska during the middle of the month.
- Teleconnections (influence on weather): The negative phase of the EPO favors cooler than normal temperatures across the Upper Midwest and Northeast. That pattern was most clear in the middle of March when the ridge was strongest. The trough to its south bring heavy moisture to California in the middle of the month.