Note: This Synoptic Discussion describes recent weather events and climate anomalies in relation to the phenomena that cause the weather. These phenomena include the jet stream, fronts and low pressure systems that bring precipitation, high pressure systems that bring dry weather, and the mechanisms which control these features — such as El Niño, La Niña, and other oceanic and atmospheric drivers (PNA, NAO, AO, and others). The report may contain more technical language than other components of the State of the Climate series.
Summary
| Time Period | Key Driver | Other Drivers |
|---|---|---|
| Month | WPO | EPO |
| September 1-7 | EPO | WPO, Dorian |
| September 8-14 | EPO | WPO |
| September 15-30 | WPO | EPO, Hurricanes |
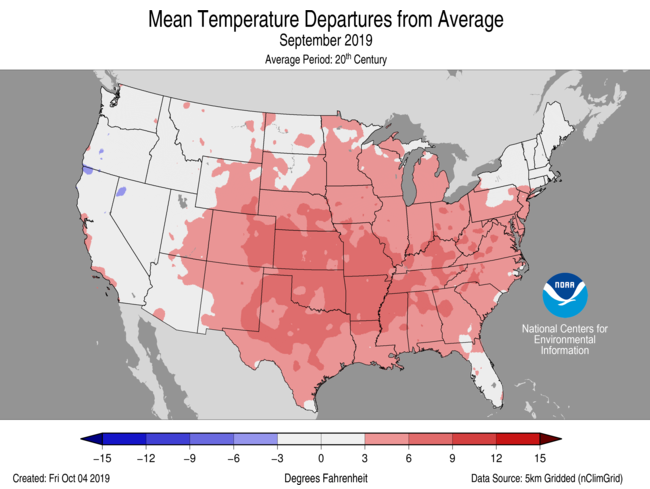
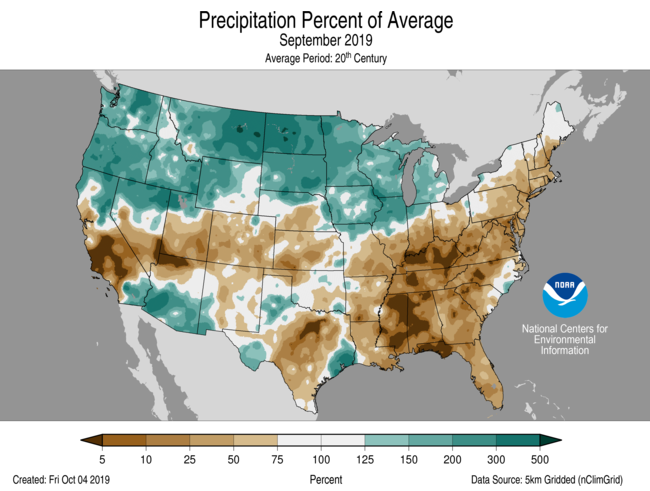
The synoptic pattern in September 2019 was dominated by a trough over the western U.S. and a ridge in the east ("trough–ridge"). The trough contributed to near-normal conditions along the West Coast and brought significant moisture to the Northern Tier, including a record wet September for North Dakota. The ridge brought hot and dry conditions to the eastern half the country and contributed to several states having their hottest or driest Septembers on record. This combination of heat and dry conditions led to the formation of a "flash drought" over much of the South, Ohio Valley, and mid-Atlantic. The primary teleconnections were a positive West Pacific Oscillation (WPO) and a generally negative East Pacific Oscillation (EPO). Both of these favor the trough in the west and ridge in the east.
In the tropics, the El Niño-Southern Oscillation (ENSO) remained neutral, although it inched back towards the El Niño side of neutral. The neutrality continues to be a balance between warm ocean anomalies in the western ENSO region and cool anomalies in the east canceling one another. Several tropical cyclones featured prominently this month, as is common for September. Hurricane Dorian brushed the southern Atlantic Coast and brought heavy rain and flooding to the Coastal Carolinas. Tropical Storm Imelda stalled over eastern Texas and brought torrential rainfall reminiscent of Hurricane Harvey (2017). These two storms were the only significant rainmakers within the developing drought over the Southeast. Farther west, the remnants of Hurricane Lorena and Tropical Storm Mario brought the first significant rains of the North American monsoon.
Monthly Mean
Submonthly Evolution
September 1-7
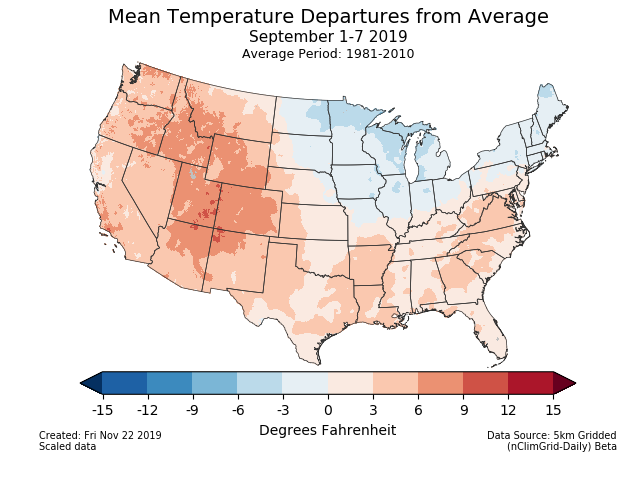
The key features during September 1-7 were a broad ridge over western North America and a trough in the east. The ridge was responsible for above normal temperatures, which were concentrated along the Rockies near the ridge's axis. Several record highs were set and both Denver and Salt Lake City hit 100°F, which is unusual for such high elevations this late in the year.
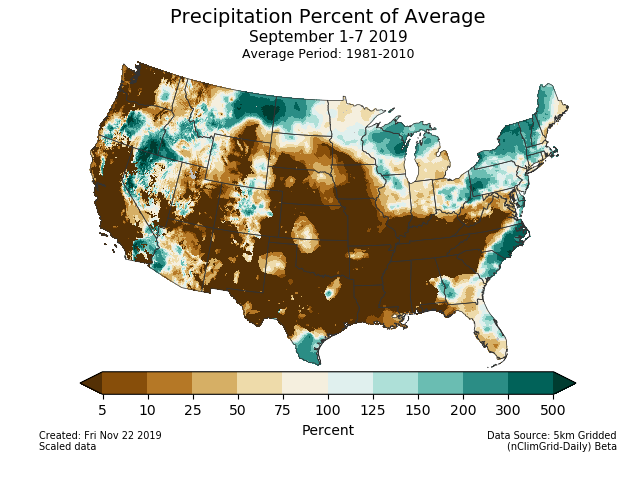
The ridge also brought drier than normal conditions to most of the CONUS. The two exceptions were the northern Rockies (even small amounts of precipitation would be above normal there) and the South Atlantic Coast (which experienced flooding from Hurricane Dorian). The trough in the east played a key role in keeping Dorian offshore until its eventual landfall in the Outer Banks.
September 8-14
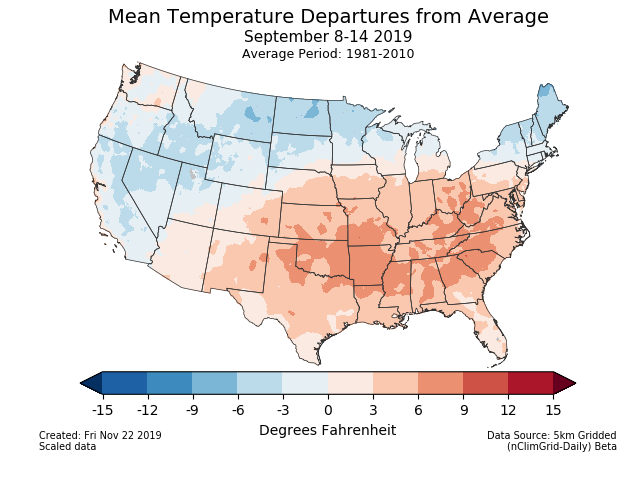
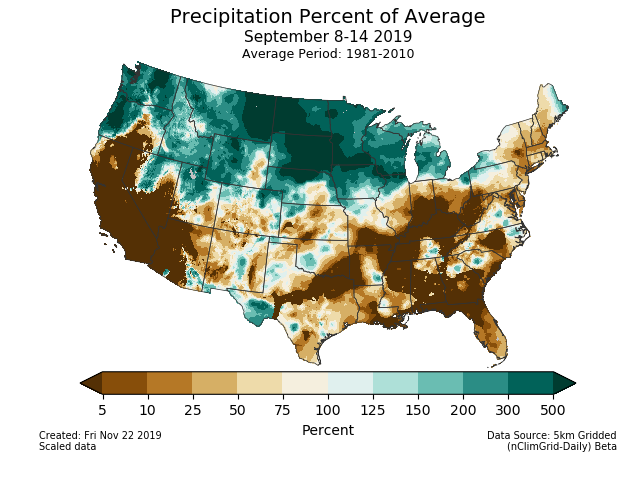
The North American circulation pattern switch during the second week of September to have a trough along the West Coast while the Ridge moved farther east. The pattern would have been a classic negative EPO except that the trough did not extend northward into Alaska. The trough brought cooler temperatures to the Northern Tier of the country. A series of stalled cold fronts brought heavy rains to the Northern Plains. These led to North Dakota recording its wettest September on record. The ridge on the other hand brought warm and dry conditions to the southern half of the country aside from some isolated convective events.
September 15-30
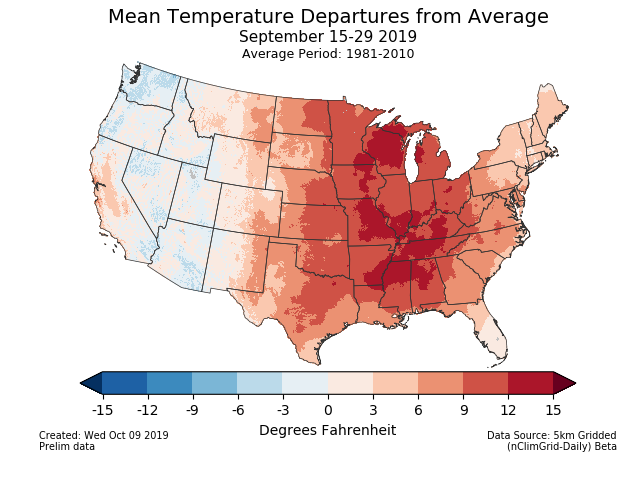
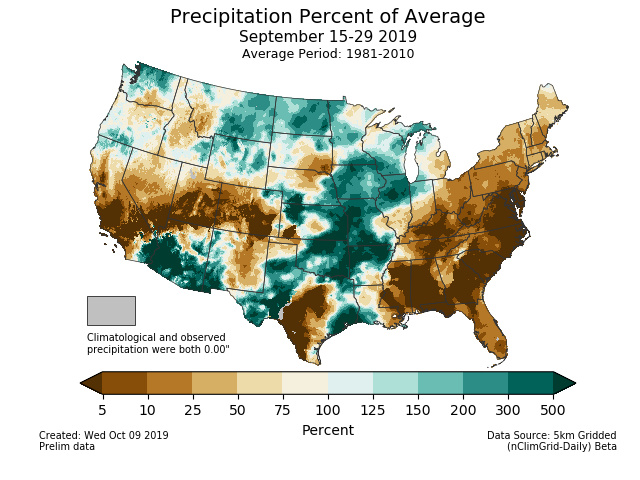
The trough–ridge pattern became even more entrenched during the final two weeks of September. These features were part of a strong positive WPO. The ridge led to a late-season heatwave for much of the Eastern U.S. That heat combined with the continued dry conditions led to the "flash drought" in the South, Ohio Valley, and mid-Atlantic.
Several significant weather events also happened during the latter half of September. A strong trough and associated cold front swept across the country September 21-26. It ultimately merged with Hurricane Humberto and helped keep Hurricane Jerry offshore. Meanwhile, a cutoff trough developed over Southern California. It got additional moisture and energy from the remnants of Hurricane Lorena and Tropical Storm Mario. These combined to produce flash flooding in Arizona and brought the only significant rains of the North American Monsoon in 2019.
The active weather continued in the final days of September. Several teleconnection indices (NAO, AO, WPO, and EPO) abruptly changed signs. The trough–ridge, which had weakened in the previous week, strongly reasserted itself. As that trough strengthened, it brought a major early season winter storm to Idaho, Montana, and Wyoming.
Atmospheric Drivers
- El Niño Southern Oscillation (ENSO)
- Description: Oceanic and atmospheric conditions in the tropical Pacific Ocean can influence weather across the globe. ENSO is characterized by two extreme modes: El Niño (warmer-than-normal sea surface temperature [SST] anomalies in the tropical Pacific) and La Niña (cooler-than-normal SST anomalies), with the absence of either of these modes termed “ENSO-neutral” conditions. These variations in SST change the locations of the Pacific's largest thunderstorms, which can in turn change circulation patterns around the globe.
- Status: The ocean and atmosphere system reflected ENSO-neutral during September 2019. The most common metric for ENSO is the SST anomalies in the Central Pacific, the Niño 3.4 region. These were around −0.3°C for most of the month before increasing to +0.5°C in the final week. That resulted in a monthly Niño 3.4 value near zero in September. As in previous months, these weak Niño 3.4 anomalies came in part from a cancellation of warm anomalies in the western Pacific (Niño 4) and cold anomalies in the eastern Pacific (Niño 3).
- Teleconnections (influence on weather): The teleconnections with ENSO are muted during near-neutral conditions. A more robust El Niño would have favored cooler than normal temperatures in the northeast, which were not observed in September 2019. However, El Niño also favors drier conditions over the South–Central CONUS and the Mid-Atlantic, both of which did occur.
- Madden-Julian Oscillation (MJO)
- Description: The MJO is the biggest source of subseasonal (30-60 day) tropical variability. It typically develops as a large envelope of tropical thunderstorms that develops over the Indian Ocean that then moves eastward. Like ENSO, the MJO's effects on tropical rainfall is so strong that it can alter the atmospheric circulation around the globe. The thunderstorms decay when they cross the Pacific, but the associated winds can often continue across the Western Hemisphere to initiate the next MJO in the Indian Ocean. The MJO is episodic, meaning that is not always active. Most indices for tracking the MJO identify both the MJO's amplitude and the longitude of its strongest rainfall, usually described as one of eight phases.
- Status: A moderate MJO began the month near the Maritime Continent (phases 4/5), moved eastward across the Pacific and Atlantic (phases 6/7/8), and ended the month over Africa (phase 1).
- Teleconnections (influence on weather): The MJO's impacts on the US are typically smaller during September than other months. Eight tropical cyclones formed within its convective envelope over the Eastern Pacific or the Atlantic during September.
- The Pacific/North American (PNA) pattern
- Description: The PNA teleconnection pattern is associated with strong fluctuations in the strength and location of the East Asian jet stream. PNA-related blocking of the jet stream flow in the Pacific can affect weather downstream over North America, especially the West and especially in the winter half of the year.
- Status: The daily PNA index was strongly positive throughout September with just a brief period of near-average around September 26. On average, the PNA was strongly positive during September 2019 due primarily to the trough in the Bering Sea, the enhanced subtropical ridge over the Pacific, and the ridge in northwestern Canada.
- Teleconnections (influence on weather): A positive PNA would generally be associated with above-normal temperatures along the West Coast and cooler temperatures over the Southeast, but those patterns were generally reversed this September.
- The Arctic Oscillation (AO) pattern
- Description: The AO teleconnection pattern generally measures the pressure difference between the low pressure over the North Pole and the higher pressures in the subtropical ridges. This pressure difference is larger during a positive AO, resulting in a stronger midlatitude jet. When the AO is negative, the jet is weaker and will have larger troughs and ridges.
- Status: The AO was weak but generally positive during most of September. It had two brief periods where it was strongly negative around September 18 and then strongly positive around September 24. The positive AO was primarily due to ridges over the Northeast Atlantic and Northeast Pacific.
- Teleconnections (influence on weather): A positive AO in September is typically associated with warmer than average temperatures over the Northern Plains. In September 2019, however, those warm anomalies were generally located farther south. Positive AO also favors drier conditions across the Central CONUS and the Northeast with enhanced moisture along the Southern Atlantic Coast. These generally transpired during September 2019, although the Northern Plains were wetter than normal, and the moisture along the Atlantic Coast was confined to the area affected by Hurricane Dorian.
- The North Atlantic Oscillation (NAO) pattern
- Description: The NAO teleconnection pattern relates the pressure over the sub-polar low near Greenland and Iceland with the subtropical high over the Central Atlantic. It significantly affects the weather on both sides of the Atlantic.
- Status: The daily NAO was weak but positive for the first half of the month and then increasingly negative during the second half. These canceled out in the monthly mean, which was near zero. The circulation during the first half of September looked like a classic positive NAO with an enhanced trough over Greenland and enhanced ridging over the northeast Atlantic. These patterns reversed during the second half of the month. Remarkably, the enhanced ridge over the eastern CONUS, which is typical of a positive NAO, remained throughout the month.
- Teleconnections (influence on weather): The NAO's impacts on the CONUS are generally weaker during the fall months, which might explain why the ridge over the eastern CONUS was unaffected by the change in NAO later in the month.
- The West Pacific Oscillation (WPO) pattern
- Description: The WPO teleconnection pattern is a primary mode of low-frequency variability over the North Pacific and reflects zonal and meridional variations in the location and intensity of the East Asian jet stream in the western Pacific.
- Status: The WPO index was moderately positive for most of the month with some weak negative values around September 15. The monthly average was moderately positive, due primarily to the anomalous trough near the Bering Sea and the enhanced ridges over eastern Russia and the subtropical Pacific.
- Teleconnections (influence on weather): A positive WPO is typically associated with warmer than normal temperatures in the Midwest-to-Northeast and cooler temperatures in the Southwest. Neither materialized in September 2019, but the positive WPO was consistent with the trough along the West Coast and the ridge in the East.
- The East Pacific Oscillation (EPO) pattern
- Description: The EPO pattern identifies variations in the strength and location of the eastern Pacific jet stream. During the positive phase, the jet is stronger and shifted southward. The negative phase is associated with an Alaskan ridge that weakens the jet. The EPO is closely related to the East Pacific–North Pacific (EP–NP) teleconnection pattern, although the two are defined with opposite signs.
- Status: The EPO index was weak but negative until around September 11. It then became increasingly positive, peaked on September 23, and then rapidly transitioned to negative for the remainder of the month. The resulting monthly average was near zero.
- Teleconnections (influence on weather): The negative phase of the EPO that occurred during much of the month would favor cooler than normal temperatures in the Pacific Northwest and warmer than average conditions across the Eastern U.S, the latter of which featured prominently in September 2019.