Note: This Synoptic Discussion describes recent weather events and climate anomalies in relation to the phenomena that cause the weather. These phenomena include the jet stream, fronts and low pressure systems that bring precipitation, high pressure systems that bring dry weather, and the mechanisms which control these features — such as El Niño, La Niña, and other oceanic and atmospheric drivers (PNA, NAO, AO, and others). The report may contain more technical language than other components of the State of the Climate series.
Summary
| Time Period | Key Driver | Other Drivers |
|---|---|---|
| Month | Pacific Blocking | NAO, AO |
| July 2–8 | Pacific Blocking | NAO, AO |
| July 9–15 | Hurricane Barry | NAO, AO |
| July 16–22 | NAO, AO | |
| July 23–29 | Strong Cold Front | NAO |
The synoptic pattern in July 2019 was dominated by a wavetrain consisting of a ridge over Alaska, a trough over the Pacific Northwest, and a ridge centered near the Great Lakes. As in June, the Alaskan ridge led to record warm there, although it weakened towards the end of the month. That ridge, along with the trough to its south, created a blocking pattern in the Pacific that likely played a role in the persistence of the pattern over North America. Blocking events like this are more common when the Arctic Oscillation (AO) is negative as it was in July 2019.
Positive 500-hPa height anomalies near the Great Lakes were associated with a strong and prolonged heatwave over the eastern half of the contiguous U.S. Hurricane Barry made landfall in Louisiana on July 14. Barry was a marginal category 1 hurricane, but it brought unwelcome heavy rainfall to the already soaked lower Mississippi. Barry's circulation also exacerbated the heatwave along the East Coast with a steady supply of tropical air. A strong cold front finally brought relief from the heat as it swept westward over July 20–24.
Weak El Niño conditions continued over the Pacific Ocean, but the warmest SST anomalies were confined to the western Pacific. Cold anomalies continued to develop over the eastern Pacific, suggesting the weakening of the El Niño. El Niño teleconnections are weaker during the summer, so it is not surprising that they did not really manifest themselves during July 2019. The North Atlantic Oscillation (NAO) remained negative for most of the month associated with a strong ridge over Greenland. The contiguous U.S. temperature patterns generally reflected that negative NAO, and the change in the final week of the month was also consistent with a brief transition to a positive NAO.
Monthly Mean


Submonthly Evolution


July 2–8


July began with a strong ridge over Alaska and a trough to its south over the northeastern Pacific. This blocking pattern weakens the jet stream over the Pacific Ocean, which played a role in the persistent weather pattern over North America during July. A trough along the West Coast brought below normal temperatures to the western half of the contiguous U.S., while a ridge near the Great Lakes brought above normal temperatures to the eastern half. The heaviest precipitation fell to the east of the trough along the Western Plains.
July 9–15


The pattern remained similar during the second week of July, except for the development of Hurricane Barry. Barry's circulation broke off of the southern end of a stationary front along the Gulf Coast. The initial disturbance actually formed over land and meandered for a few days before emerging over the Gulf of Mexico and developing into a tropical cyclone. It only became a marginal category 1 hurricane, but its slow northward movement brought heavy rain to the lower Mississippi. From July 13 to 18, Barry slowly made its way northeastward near the Mississippi and then the Ohio Rivers. The southerly winds on the eastern side of the storm brought tropical heat and humidity to the East Coast, and its upper-level outflow fed the ridge aloft.
July 16–22


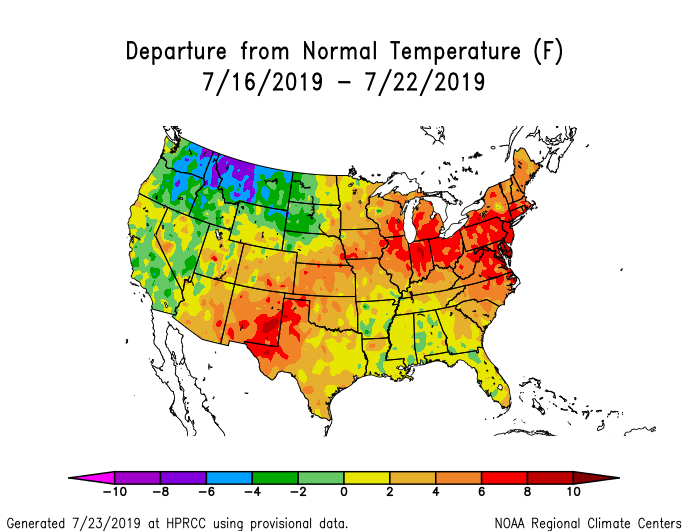

The pattern over the Pacific began to change in the second half of July. The Alaskan ridge, which had been present since mid-May, finally began to weaken. It was replaced by a trough in the Gulf of Alaska, which was north of an anomalously strong subtropical ridge in the Central Pacific. This configuration reversed the blocking pattern from earlier in the month and led to a stronger than normal Pacific jet stream. Despite these changes upstream, however, the pattern over the contiguous U.S. stayed the same as earlier in the month. July 16–22 was the peak of the heatwave over the northeastern quadrant of the country.
July 23–29


The enhanced Pacific jet led to a more propagating pattern in the final week of the month. A strong cold front swept across the country and brought much needed relief from the heat wave. Temperatures fell below normal over most of the country, especially the Southeast. Meanwhile, a ridge over the Southwest brought above normal temperatures there.
Atmospheric Drivers

- El Niño Southern Oscillation (ENSO)
- Description: Oceanic and atmospheric conditions in the tropical Pacific Ocean can influence weather across the globe. ENSO is characterized by two extreme modes: El Niño (warmer-than-normal sea surface temperature [SST] anomalies in the tropical Pacific) and La Niña (cooler-than-normal SST anomalies), with the absence of either of these modes termed "ENSO-neutral" conditions. These variations in SST change the locations of the Pacific's largest thunderstorms, which can in turn change circulation patterns around the globe.
- Status: The ocean and atmosphere system reflected a weak El Niño state during July 2019. The most common metric for ENSO is the SST anomalies in the Central Pacific, the Niño 3.4 region. These stayed around +0.5°C throughout the month. While Niño 3.4 is generally a good indicator of ENSO, in this case it straddled to extremes. The Niño 4 region in the western Pacific was near +1.0°C, while the Niño 3 region in the eastern Pacific was near 0°C.
- Teleconnections (influence on weather): The observed patterns in July 2019 did not align well with the typical temperature and precipitation patterns for El Niño. The teleconnections with ENSO are generally weaker during the Summer months, but El Niño generally produces cooler than normal temperatures over the southwestern and northeastern U.S., where July 2019 featured near-normal temperatures in the southwest and above-normal for the Northeast. On average, El Niño also produces above-average rainfall for the Central U.S. and below-normal for Texas, Louisiana, and the Great Lakes. In July 2019, Texas and the Great Lakes region were both drier than normal, but Louisiana was wetter than normal because of Hurricane Barry.
- Madden-Julian Oscillation (MJO)
- Description: The MJO is the biggest source of subseasonal (31–60 day) tropical variability. It typically develops as a large envelope of tropical thunderstorms that develops over the Indian Ocean that then moves eastward. Like ENSO, the MJO's effects on tropical rainfall is so strong that it can alter the atmospheric circulation around the globe. The thunderstorms decay when they cross the Pacific, but the associated winds can often continue across the Western Hemisphere to initiate the next MJO in the Indian Ocean. The MJO is episodic, meaning that is not always active. Most indices for tracking the MJO identify both the MJO's amplitude and the longitude of its strongest rainfall, usually described as one of eight phases.
- Status: The MJO was inactive throughout July. The tropical circulation was dominated by a stationary ascent over the western Pacific associated with the warm SSTs there. Several equatorial Rossby waves emanated westward towards the Indian Ocean from the stationary convection. Similarly, Kelvin waves moved eastward across the Pacific, but none of these developed into an MJO.
- Teleconnections (influence on weather): The MJO's impacts on the US are typically smaller during July than other months. The MJO was weak, but the remnant signal generally projected onto phase 1. That would typically be associated with an enhanced ridge over the Southwest U.S., which did not materialize in July.
- The Pacific/North American (PNA) pattern
- Description: The PNA teleconnection pattern is associated with strong fluctuations in the strength and location of the East Asian jet stream. PNA-related blocking of the jet stream flow in the Pacific can affect weather downstream over North America, especially the West and especially in the winter half of the year.
- Status: The daily PNA index was positive for most of the month, except for negative values July 1–5 and 20–21. The largest positive anomalies were on July 10, 15, and 26. On average, the PNA was strongly positive during July 2019.
- Teleconnections (influence on weather): A positive PNA would generally be associated with above-normal temperatures along the West Coast, but that did not occur in July.
- The Arctic Oscillation (AO) pattern
- Description: The AO teleconnection pattern generally measures the pressure difference between the low pressure over the North Pole and the higher pressures in the subtropical ridges. This pressure difference is larger during a positive AO, resulting in a stronger midlatitude jet. When the AO is negative, the jet is weaker and will have larger troughs and ridges.
- Status: The AO was negative during almost the entire month with just a brief period above zero around July 18–20. The negative AO was primarily due to the ridge over the North Pole and Greenland and the trough in the North Atlantic.
- Teleconnections (influence on weather): A negative AO in July is typically associated with cooler than average temperatures over the Northern Plains, but that did not happen in July 2019. The AO pattern may have played a bigger role in the precipitation patterns, as a negative AO favors enhanced precipitation across the Great Plains, which occurred at least over the Northern Plains in July 2019. Negative AO is also associated with a weaker jet stream and more blocking events, as happened in July.
- The North Atlantic Oscillation (NAO) pattern
- Description: The NAO teleconnection pattern relates the pressure over the sub-polar low near Greenland and Iceland with the subtropical high over the Central Atlantic. It significantly affects the weather on both sides of the Atlantic.
- Status: The NAO was negative throughout July 2019, except for a period of positive values July 22–25. The negative NAO was due primarily to the ridge over Greenland and the trough over the northwestern Atlantic.
- Teleconnections (influence on weather): Negative NAO during July generally brings cooler than normal conditions to the northern Rockies and warmer than normal temperatures to the Southeast. July 2019 broadly followed this pattern. The positive NAO around July 22–25 even coincided with the pattern switch to cooler temperatures over the Southeast.
- The West Pacific (WP) pattern
- Description: The WP teleconnection pattern is a primary mode of low-frequency variability over the North Pacific and reflects zonal and meridional variations in the location and intensity of the East Asian jet stream in the western Pacific.
- Status: The monthly WP index was slightly negative, due primarily to the anomalous ridges over Hawaii and Alaska and the trough near the West Coast (daily index values are not available).
- Teleconnections (influence on weather): The negative WP in July was consistent with the warmer than normal temperatures over the Northeast. However, it would usually also be associated with warmer than normal temperatures near California, which was generally near normal during July 2019.
- The East Pacific-North Pacific (EP-NP) pattern
- Description: The EP-NP teleconnection pattern relates SST and upper-level circulation patterns (geopotential height anomalies) over the eastern and northern Pacific to temperature, precipitation, and circulation anomalies downstream over North America. Its influence during the winter is not as strong as during the other three seasons.
- Status: The monthly EP-NP index was strongly positive, due to the wave train consisting of the trough in the Central Pacific, the ridge in the northwest Pacific, and the trough over the Midwest. (daily index values are not available)
- Teleconnections (influence on weather): Even though the EP–NP pattern was neutral, the temperature pattern in July 2019 resembled the negative phase of the EP–NP, which contains cooler than normal temperatures in the Pacific Northwest and warmer than average conditions across most of the U.S. east of the Rockies.