Note: This Synoptic Discussion describes recent weather events and climate anomalies in relation to the phenomena that cause the weather. These phenomena include the jet stream, fronts and low pressure systems that bring precipitation, high pressure systems that bring dry weather, and the mechanisms which control these features — such as El Niño, La Niña, and other oceanic and atmospheric drivers (PNA, NAO, AO, and others). The report may contain more technical language than other components of the State of the Climate series.
Summary
| Time Period | Key Driver | Other Drivers |
| Month | EP–NP | PNA, NAO, AO |
| June 1–9 | EP–NP | PNA, NAO |
| June 10–16 | EP–NP | PNA, NAO, AO |
| June 17–23 | EP–NP | PNA NAO, AO |
| June 24–30 | PNA |
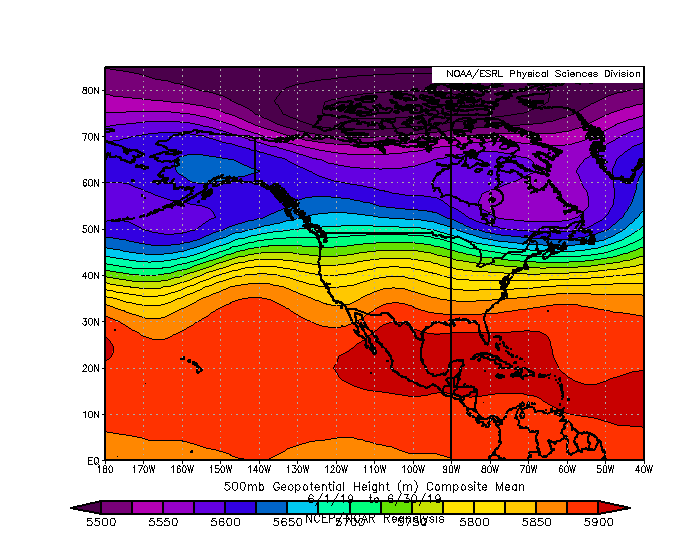
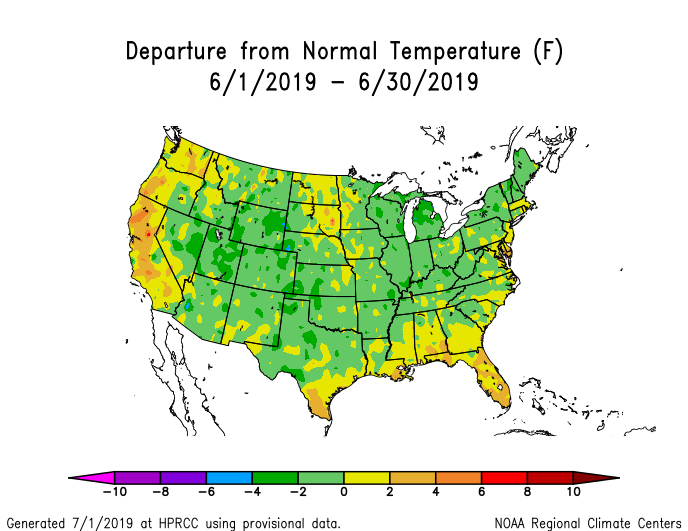
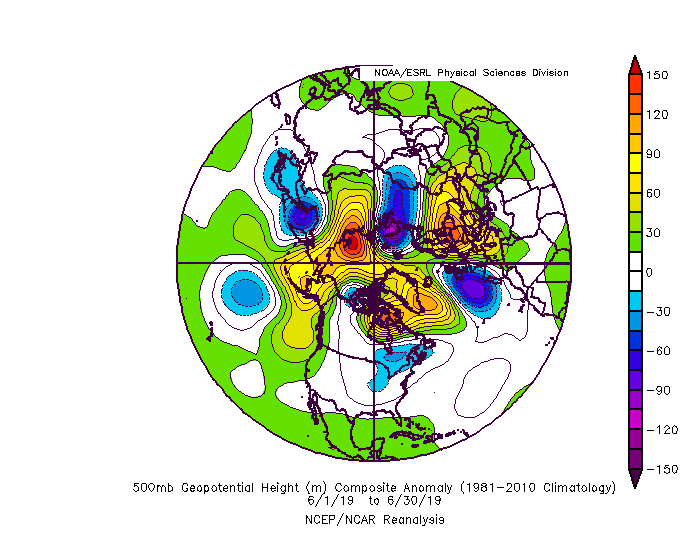
The synoptic pattern in June 2019 was dominated by a ridge in the Northeastern Pacific and a trough over the Northern Midwest. The ridge was associated with record heat and dry conditions in Alaska and the West Coast. Meanwhile the trough was associated with severeweather and flooding around the Ohio Valley and Lower Mississippi. The trough was also associated the moderately below normal temperatures across much of CONUS.
The circulation was associated with a series of atmospheric waves extending across the North Pacific, consistent with the positive phase of the East Pacific-North Pacific (EP-NP) pattern. A moderately negative Arctic Oscillation (AO) played a role in reducing the strength of the jet stream and fostering this wavy pattern. Meanwhile, the Pacific–North American (PNA) modulated the pattern, which shifted eastward around June 7 and again around June 23. The moderate El Niño conditions continued over the Pacific Ocean, but their amplitude declined under the influence of an upwelling Kelvin wave. El Niño teleconnections are weaker during the summer, so it is not surprising that they did not really manifest themselves during June 2019.
Monthly Mean


Submonthly Evolution


June 1–9


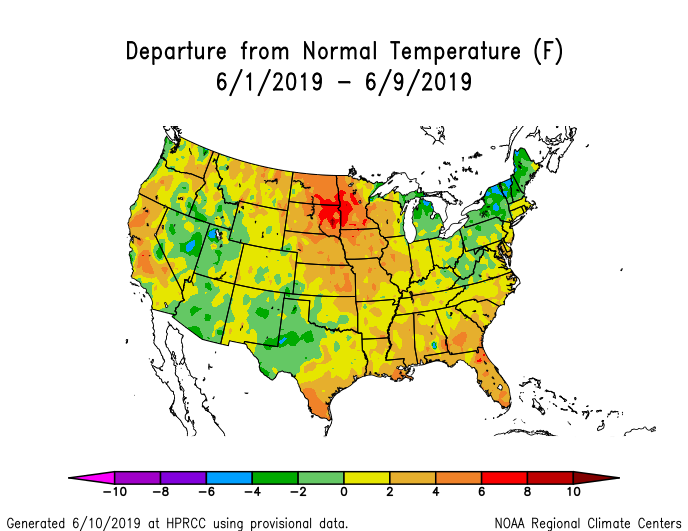

June began with a propagating pattern. A ridge moved across the northern CONUS from the Pacific Northwest towards the Great Lakes. This ridge produced anomalously hot and dry conditions along the West Coast and the Northern Plains. Meanwhile, a trough moved from the Great Lakes northeastward to the Canadian Maritimes. It brought moderately cooler temperatures to the Northeast and wetter conditions to the Southeast.
June 10–16
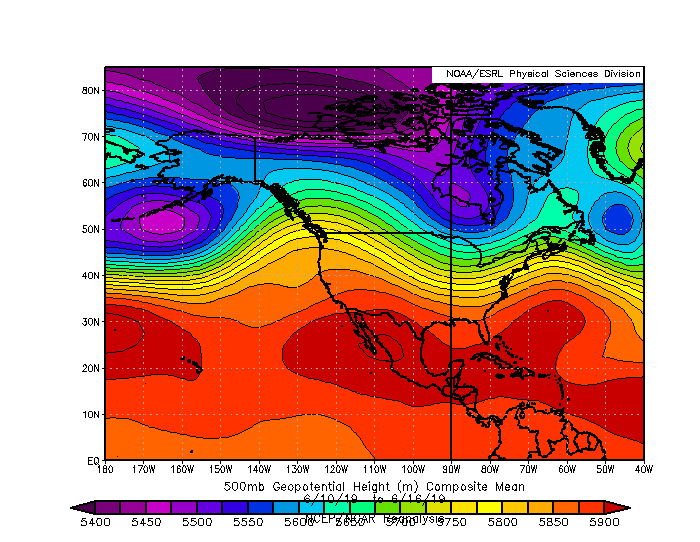


The ridge established itself near the coast of Washington and British Columbia around June 10. It produced extreme heat all along the West Coast, including San Francisco experiencing just its second 100°F day in its history. Meanwhile, the downstream trough brought slightly cooler than average temperatures across most of the country east of the Rockies.
June 17–23
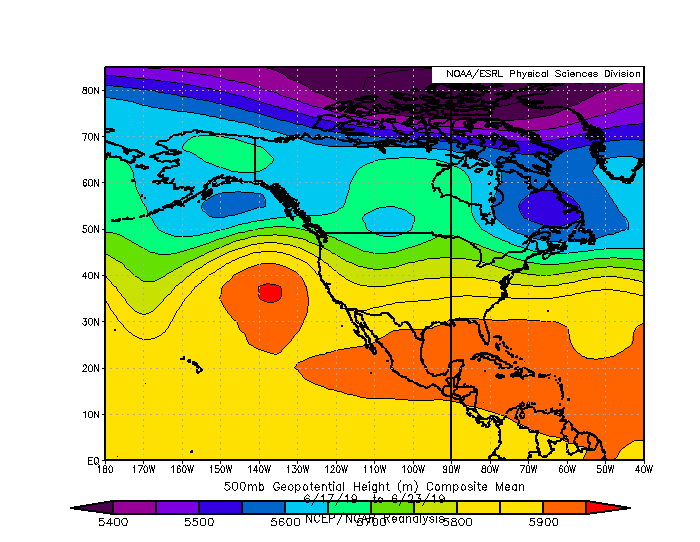


The ridge and trough strengthened and moved westward during June 17–23. The West Coast remained warmer than normal, but the heat was tempered by the ridge moving farther off the coast. The trough brought cooler than normal temperatures to the northern and central Rockies, which led to more than a foot of snow to portions of the region. The other side of the trough brought severe weather and flash flooding to Pennsylvania, New Jersey, Ohio, and Illinois.
June 24–30


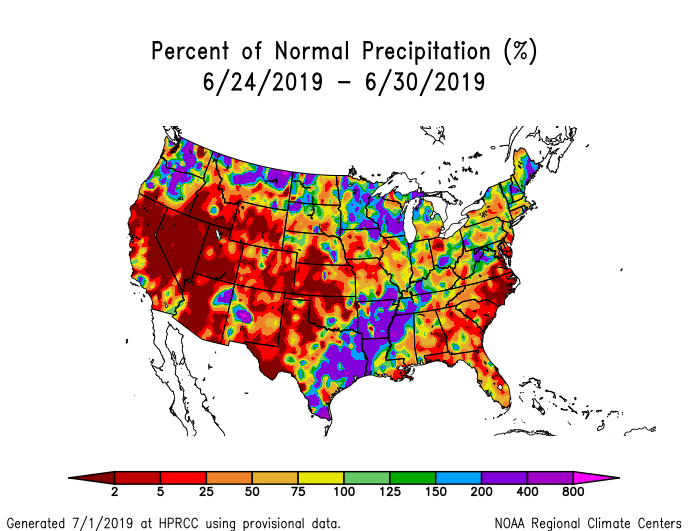
The trough continued moving westward during the final week of June. It brought relief to the West Coast in the form of cooler than normal temperatures. However, the associated moisture was confined to Washington and Oregon. The southwest remained dry, which is typical during June. A week ridge developed over the Northern Midwest during the final days of the month. It brought hotter than normal temperatures across the region and to the Northeast.
Atmospheric Drivers

-
El Niño Southern Oscillation (ENSO)
- Description: Oceanic and atmospheric conditions in the tropical Pacific Ocean can influence weather across the globe. ENSO is characterized by two extreme modes: El Niño (warmer-than-normal sea surface temperature [SST] anomalies in the tropical Pacific) and La Niña (cooler-than-normal SST anomalies), with the absence of either of these modes termed "ENSO-neutral" conditions. These variations in SST change the locations of the Pacific's largest thunderstorms, which can in turn change circulation patterns around the globe.
- Status: The ocean and atmosphere system reflected a weak El Niño state during June 2019. SSTs in the equatorial Pacific Ocean cooled throughout the month, beginning at around +1.0°C and ending the month near 0.3°C. Easterly wind anomalies associated with the MJO in June forced an upwelling Kelvin wave that likely played a role in the surface cooling.
- Teleconnections (influence on weather): The observed patterns in June 2019 did not align at all with the typical temperature and precipitation patterns for El Niño. The teleconnections with ENSO are generally weaker during the Summer months, but El Niño generally produces cooler than normal temperatures over the southwestern U.S., where June 2019 featured warmer than normal temperatures in California and near-normal for most of the rest of the Southwest. On average, El Niño also produces above average rainfall for the Plains extending from Texas to the Dakotas with below average rainfall in the Midwest. In June 2019, however, rainfall was near normal over most of the Plains and well above normal in the Ohio Valley.
-
Madden-Julian Oscillation (MJO)
- Description: The MJO is the biggest source of subseasonal (30–60 day) tropical variability. It typically develops as a large envelope of tropical thunderstorms that develops over the Indian Ocean that then moves eastward. Like ENSO, the MJO's effects on tropical rainfall is so strong that it can alter the atmospheric circulation around the globe. The thunderstorms decay when they cross the Pacific, but the associated winds can often continue across the Western Hemisphere to initiate the next MJO in the Indian Ocean. The MJO is episodic, meaning that is not always active. Most indices for tracking the MJO identify both the MJO's amplitude and the longitude of its strongest rainfall, usually described as one of eight phases.
- Status: The MJO was active throughout June. It started the month over the Indian Ocean (phase 2) and moved eastward across the Maritime Continent (Phase 4/5) before reaching the Western Pacific (Phase 6/7) by the end of the month. Its eastward propagation slowed and amplitude weakened during the second half of the month as its envelope of enhanced rainfall interacted with the El Niño conditions over the Pacific.
- Teleconnections (influence on weather): The MJO's impacts on the US are typically smaller during June than other months. The most significant impacts occur when the MJO is over the Western Pacific (Phase 7), as it was in the final week of the month. However, the MJO would favor a ridge over the Rockies and a trough over the eastern U.S., which is nearly the opposite of what transpired.
-
The Pacific/North American (PNA) pattern
- Description: The PNA teleconnection pattern is associated with strong fluctuations in the strength and location of the East Asian jet stream. PNA-related blocking of the jet stream flow in the Pacific can affect weather downstream over North America, especially the West and especially in the winter half of the year.
- Status: The daily PNA index oscillated around zero for most of the month. The largest anomalies were a negative PNA around June 9 and a positive PNA around June 16. The month ended with a rapid transition from a negative peak on June 25 and positive one on June 28. On average, the PNA was slightly positive during June 2019.
- Teleconnections (influence on weather): The positive PNA during the middle of the month was very consistent with the ridge and warm temperatures along the West Coast as well as the trough and cooler temperatures east of the Rockies during both June 10–16 and 17–23.
-
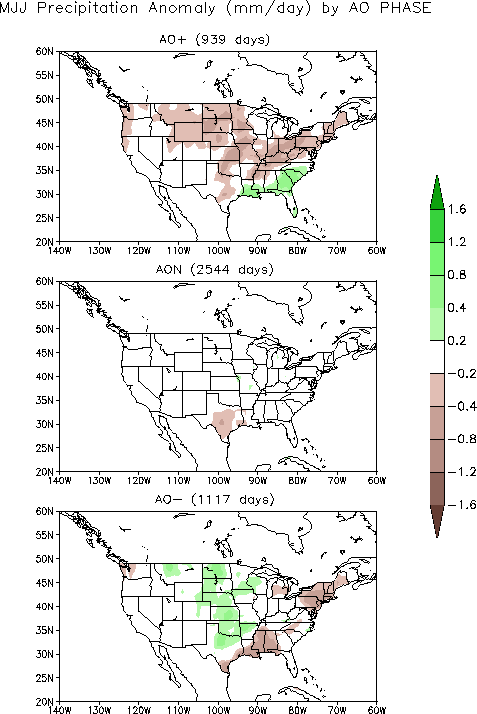
The Arctic Oscillation (AO) pattern
- Description: The AO teleconnection pattern generally measures the pressure difference between the low pressure over the North Pole and the higher pressures in the subtropical ridges. This pressure difference is larger during a positive AO, resulting in a stronger midlatitude jet. When the AO is negative, the jet is weaker and will have larger troughs and ridges.
- Status: The AO was negative during almost the entire month with just a brief period above zero around June 19. The negative AO was primarily due to the ridge over the North Pole and Greenland.
- Teleconnections (influence on weather): A negative AO in June is typically associated with cooler than average temperatures over the Northern Plains. In June 2019, however, those anomalies only occurred during June 17–23, when the AO was in the opposite phase. The AO pattern may have played a bigger role in the precipitation patterns, as a negative AO favors enhanced precipitation across the Great Plains, which occurred at least over the Southern Plains in June 2019.
-
The North Atlantic Oscillation (NAO) pattern
- Description: The NAO teleconnection pattern relates the pressure over the sub-polar low near Greenland and Iceland with the subtropical high over the Central Atlantic. It significantly affects the weather on both sides of the Atlantic.
- Status: The NAO was negative throughout June 2019 due to the ridge over Greenland and the troughs over southeastern Canada and the northeastern Atlantic. It reached its most negative values June 10–16 when the Greenland ridge was its strongest.
- Teleconnections (influence on weather): Negative NAO during June generally brings cooler than normal conditions to the northern Rockies and warmer than normal temperatures to the Southeast. June 2019 broadly followed this pattern although perhaps at lower amplitude than might be expected. Interestingly, the poorest fit occurred at the peak of the negative NAO (June 10–16) when the southeast had below normal temperatures. As the NAO moderated the following week, the pattern actually looked more like a canonical NAO teleconnection.
-
The West Pacific (WP) pattern
- Description: The WP teleconnection pattern is a primary mode of low-frequency variability over the North Pacific and reflects zonal and meridional variations in the location and intensity of the East Asian jet stream in the western Pacific.
- Status: The monthly WP index was negative, due primarily to the ridge over far the Bering Sea and the trough over the Sea of Okhotsk (daily index values are not available).
- Teleconnections (influence on weather): The negative WP in June was consistent with the warmer than normal temperatures over California. However, it would usually also be associated with warmer than normal temperatures over the Northeast which did not occur in June 2019.
-
The East Pacific-North Pacific (EP-NP) pattern
- Description: The EP-NP teleconnection pattern relates SST and upper-level circulation patterns (geopotential height anomalies) over the eastern and northern Pacific to temperature, precipitation, and circulation anomalies downstream over North America. Its influence during the winter is not as strong as during the other three seasons.
- Status: The monthly EP-NP index was strongly positive, due to the wave train consisting of the trough in the Central Pacific, the ridge in the northwest Pacific, and the trough over the Midwest. (daily index values are not available)
- Teleconnections (influence on weather): The primary impacts of a positive EP–NP are warmer than normal temperatures in the Pacific Northwest and cooler than average conditions across most of the U.S. east of the Rockies. Both of these transpired in June 2019, although the cool anomalies are typically strongest in the Northern Plains.
Global Linkages
- The weak El Niño and the MJO combined to delay and weaken the monsoon onset in India.
- The U.S.-Affiliated Pacific Islands were generally drier than normal during June 2019. Warm SSTs associated with El Niño enhanced rainfall along the equatorial Pacific, while the USAPI affected by the compensating subsidence. One marginal tropical storm, Four, lasted for just two days (June 29–30) in the Philippine Sea northwest of Palau. Tropical Storm Four was notably only in that it was the first tropical storm in the Western North Pacific since Super Typhoon Wutip in late February.
- The Atlantic had no tropical systems during June. On average, it has a named tropical storm about every other year. The last time the Atlantic had a June tropical storm was 2017, which featured two: Bret and Cindy.
- The eastern North Pacific finally became active during late June with the development of Hurricanes Alvin and Barbara. Alvin became a tropical storm on June 26, which marked the latest start to the eastern Pacific hurricane season since 1969 (July 2).
- Central and Eastern Europe experience warmer than normal temperatures. The associated ridge was part of the same wave train that produced the ridge over Greenland and the negative NAO. Much of central and western Europe had a cooler than normal June due to a persistent trough that was part of the negative NAO pattern. However, the European ridge is not a typical feature for the NAO.