Note: This Synoptic Discussion describes recent weather events and climate anomalies in relation to the phenomena that cause the weather. These phenomena include the jet stream, fronts and low pressure systems that bring precipitation, high pressure systems that bring dry weather, and the mechanisms which control these features — such as El Niño, La Niña, and other oceanic and atmospheric drivers (PNA, NAO, AO, and others). The report may contain more technical language than other components of the State of the Climate series.
Summary
| Time Period | Circulation | Temperature | Precipitation |
| Month | NAO, EP–NP |
ENSO, PNA, AO, NAO |
ENSO, AO |
| May 1–9 | NAO, EP–NP |
AO, PNA, EP–NP |
ENSO, AO |
| May 10–16 | AO | ENSO, EP–NP | ENSO |
| May 17–31 | NAO, PNA, EP–NP |
ENSO, PNA, AO, NAO |
AO |
The primary synoptic features during May 2019 were a trough over the western half of the US and a ridge over the east. The trough produced anomalously cold and wet conditions across the western US, including some late-season snow storms for the Northern Plains. The ridge brought record-setting heatwaves and developing drought to the Southeast. Meanwhile, the southerly flow between these two features tapped moisture from the Gulf of Mexico to fuel intense severe weather and flooding across the Plains. The pattern shifted briefly during the middle of the month as the Pacific–North American (PNA) pattern became positive. However, the PNA quickly switched sign and the final two weeks of May were remarkably consistent with the beginning of the month.
El Niño conditions continued through May, and many of the temperature and precipitation anomalies broadly resembled those for a typical El Niño. However, the most critical teleconnection was probably the East Pacific-North Pacific (EP-NP) pattern, since it provided the upstream wavetrain for the trough and ridge over the US. A negative Arctic Oscillation (AO) played a key role in producing a more meridional midlatitude wave pattern that allowed these features to be so persistent. The trough in the western US was also part of the negative North Atlantic Oscillation (NAO) in May.
Circulation Discussion
 Animation of daily upper-level circulation for the month.
|
 Animation of daily surface fronts and pressure systems for the month.
|
Monthly Mean
 500-mb mean circulation for North America for May 2019.
|
 500-mb circulation anomalies for North America for May 2019.
|
 Temperature anomalies (departure from normal) for the CONUS for May 2019.
|
 Precipitation anomalies (percent of normal) for the CONUS for May 2019.
|
Anomalous ridging around the North Pole was associated with a jet stream that was weaker and wavier than normal during May. This manifest in part as a long stationary wave train that extended across the Pacific and North America. It featured ridging over the Pacific Northwest, a trough extending from the Great Lakes southwestward to Southern California, and another ridge over the Southeast. These features aligned well with the surface anomalies with the expected warm and dry conditions under each ridge and cool and moist anomalies under the trough.
May 1-9
 500-mb mean circulation for North America for May 1-9, 2019.
|
 500-mb circulation anomalies for North America for May 1-9, 2019.
|
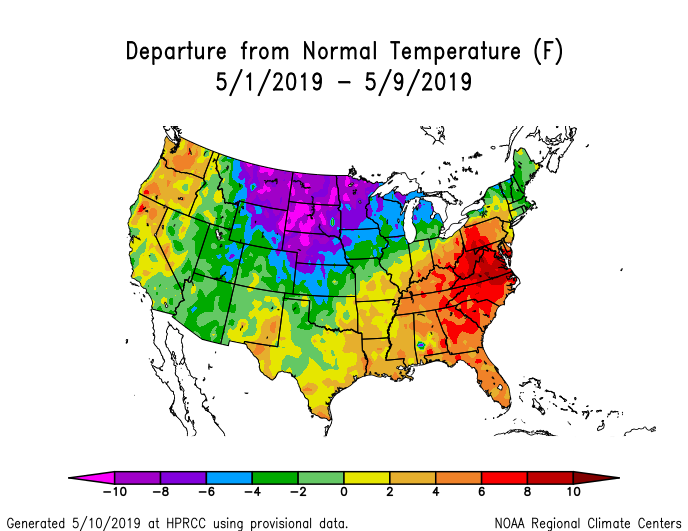 Temperature anomalies (departure from normal) for the CONUS for May 1-9, 2019.
|
 Precipitation anomalies (percent of normal) for the CONUS for May 1-9, 2019.
|
The dominant wavetrain during early May was a ridge over the Gulf of Alaska, a trough over Central Canada, and another ridge over the Northeast. The ridge over the Gulf of Alaska brought warm and dry conditions to the West Coast, particularly over the northern half. The trough extended southward to the Northern Plains bringing anomalously cool with it. Heavy precipitation also fell on the eastern side of the trough. Meanwhile, the ridge along the East Coast contributed to above normal temperatures for the Mid-Atlantic.
May 10-16
 500-mb mean circulation for North America for May 10-16, 2019.
|
 500-mb circulation anomalies for North America for May 10-16, 2019.
|
 Temperature anomalies (departure from normal) for the CONUS for May 10-16, 2019.
|
 Precipitation anomalies (percent of normal) for the CONUS for May 10-16, 2019.
|
The middle of May marked the only significant departure from the pattern that dominated the rest of the month. The wavetrain shifted eastward and weakened somewhat. The trough that had been over the Northern Plains moved towards the East Coast, bringing cooler temperatures and more precipitation to the region. At the same time, the ridge in the Gulf of Alaska weakened and moved eastward. It extended the warm conditions from the Pacific Northwest eastward into the Northern Rockies. Abnormally dry conditions also spread across most of the central part of the country. As the ridge moved eastward, a trough moved into the Southwest from the eastern Pacific, bringing substantial rainfall to the region.
May 17-30
 500-mb mean circulation for North America for May 17-30, 2019.
|
 500-mb circulation anomalies for North America for May 17-30, 2019.
|
 Temperature anomalies (departure from normal) for the CONUS for May 17-30, 2019.
|
 Precipitation anomalies (percent of normal) for the CONUS for May 17-30, 2019.
|
The pattern during the final two weeks of May returned to something more
akin to the beginning of the month. It featured a trough over the western
half of the country and a ridge to the east. This provided cool
temperatures and abundant rainfall for the Southwest, while the Southeast
experienced dry and hot conditions. A strong southeasterly jet in between
the trough and the ridge also provided the Central Plains with ample
energy and a steady stream of moisture from the Gulf of Mexico. This
combination fueled the prolonged string of tornado outbreaks in the region.
Weather Resulting from the Circulation
Temperature Extremes
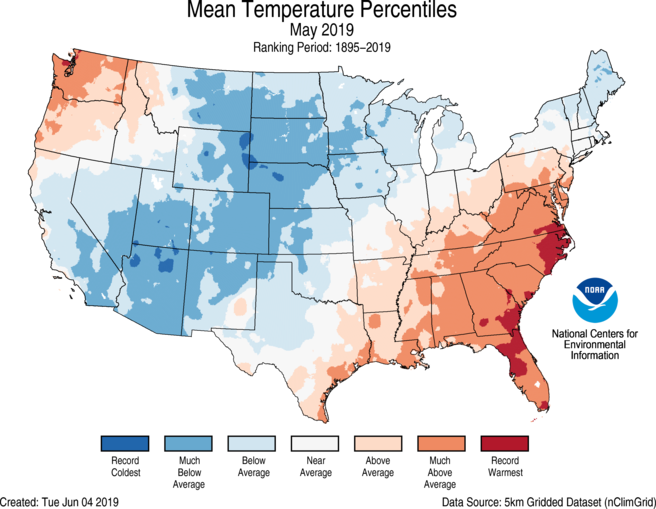
Map of monthly temperature anomalies.
Beneath the high pressure ridges, May 2019 was warmer than normal from the Lower Mississippi Valley and Southeast to the Mid-Atlantic region, and across Oregon and Washington. Record warm monthly temperatures occurred along the coastal Southeast. The month was cooler than normal beneath upper-level troughing from the Southwest to Great Lakes, and in New England. Predominant ridging left Alaska warmer than normal.
Ten states (Washington and nine in the Southeast and along the Mid-Atlantic Coast) ranked in the top ten warmest category for May, including Florida which had the warmest May in the 1895-2019 record. Five states, from the Southwest to northern Plains, had a top ten coldest May.
When daily temperature records are examined, the extreme cold outweighed the extreme warmth. Integrated across the month, there were 4,166 record cold daily high (3,334) and low (832) temperature records. This was about 1.4 times the 2,935 record warm daily high (1,079) and low (1,856) temperature records.
Temperatures averaged across the country gave the CONUS the 37th coldest May in the 1895-2019 record. The coldest air (temperature anomalies) stretched from the Southwest to northern Plains, and some in New England; these include mostly rural but some urban areas. The warmest air (temperature anomalies) was located in the Southeast to Mid-Atlantic (both heavily urban areas). With a significant portion of the population experiencing warmer-than-normal maximum temperatures, increasing cooling demand during this transitional time of year, and some experiencing cooler-than-normal minimum temperatures, increasing heating demand, the national REDTI (Residential Energy Demand Temperature Index) value for May 2019 ranked as the 18th highest May REDTI in the 125-year record.
Precipitation Extremes
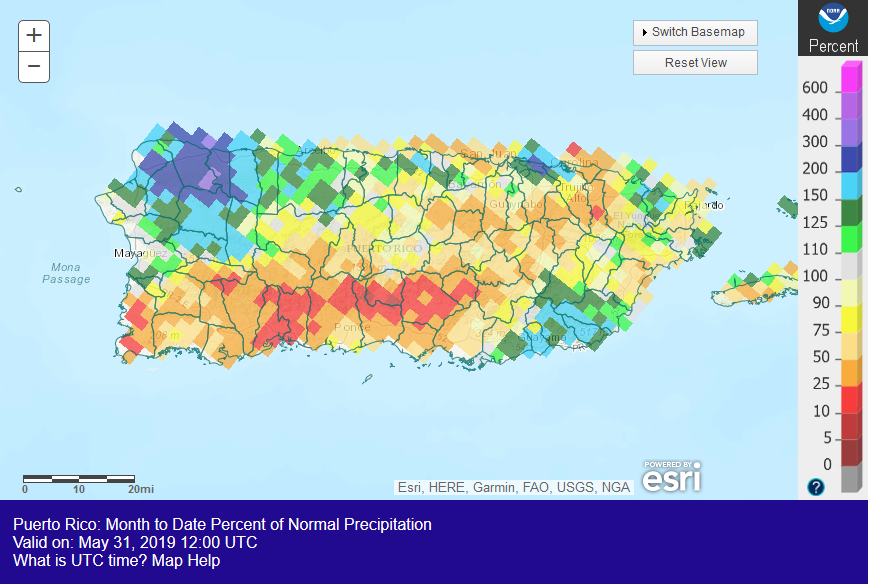
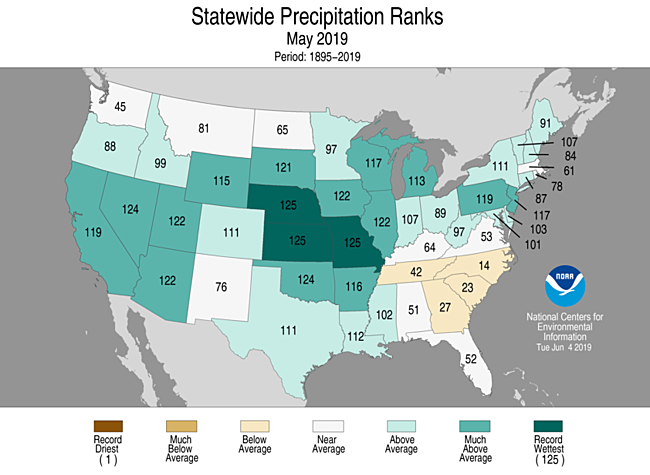
Map of monthly precipitation anomalies.
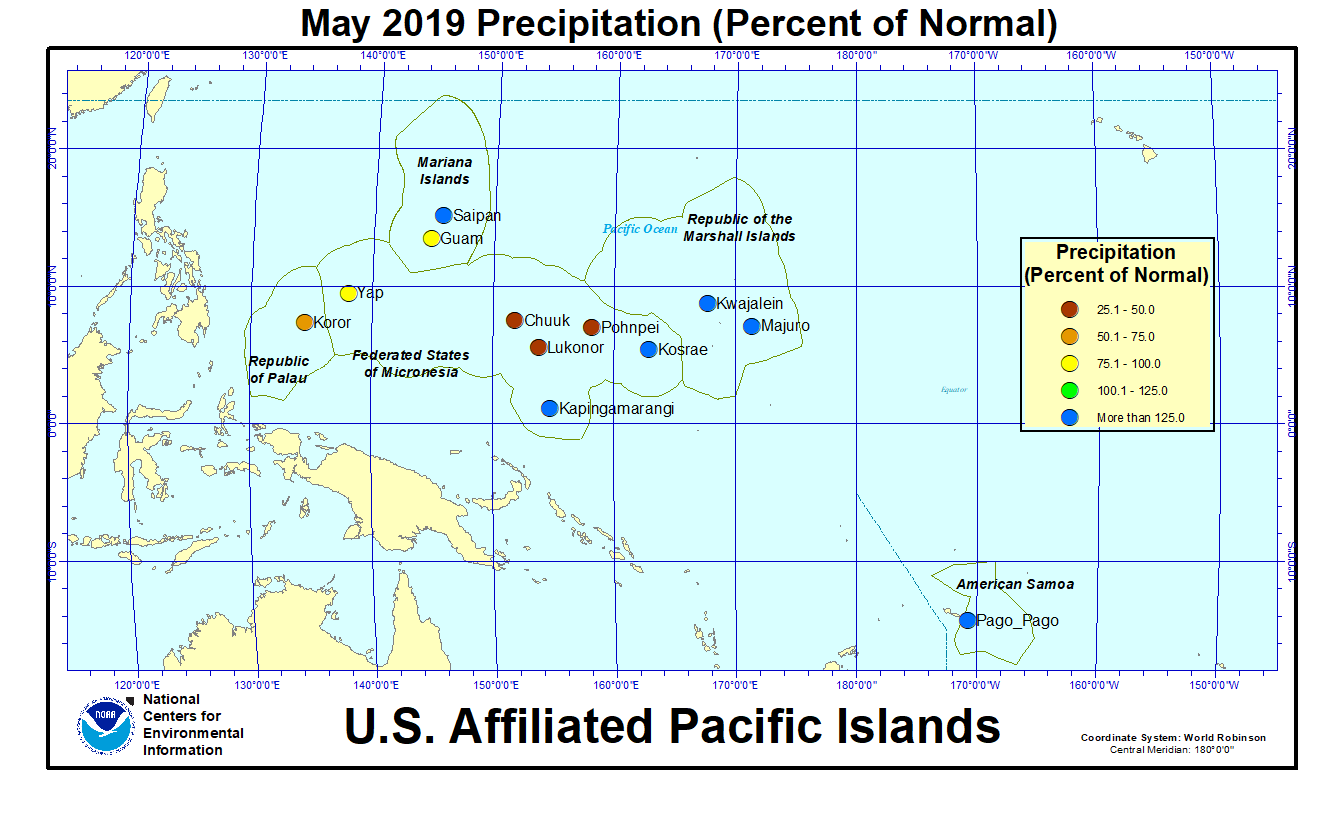
The ridging made May 2019 drier than normal across coastal Oregon and Washington, the Tennessee Valley, and much of the Southeast. The month was also drier than normal across the portion of the northern Plains bordering Canada, southeastern New Mexico, eastern Alaska and the Alaska panhandle, southern to north central Puerto Rico, parts of Hawaii and the U.S. Virgin Islands, and much of the western and northern U.S.-Affiliated Pacific Islands (USAPI). Persistent troughing, lows, and fronts resulted in wetter-than-normal weather across much of the West, Plains, and Midwest, with a record wet month occurring in many of these areas. May was also wetter than normal in the Northeast, southern and western Alaska, northwestern and southeastern Puerto Rico, parts of Hawaii and the U.S. Virgin Islands, and parts of the southern and eastern USAPI.
Fifteen states (Pennsylvania and New Jersey plus 13 in the West, Plains, and Midwest) ranked in the top ten wettest category for May, including Kansas, Missouri, and Nebraska which had the wettest May in the 1895-2019 record.
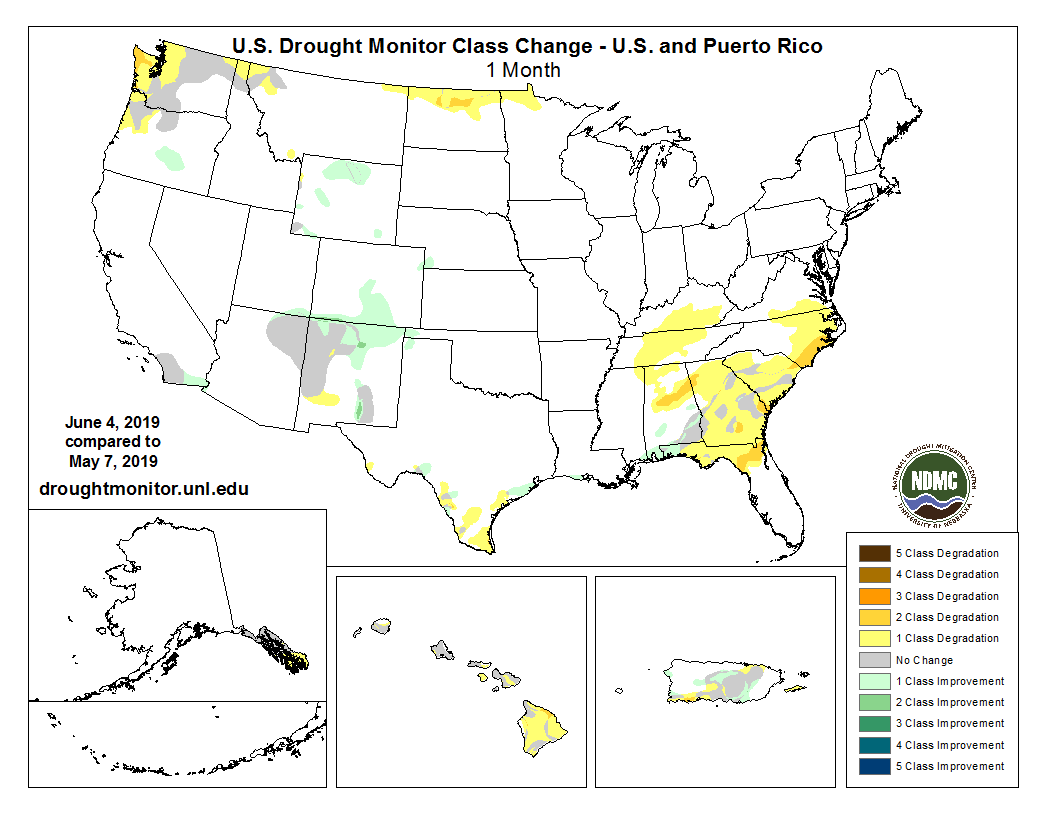
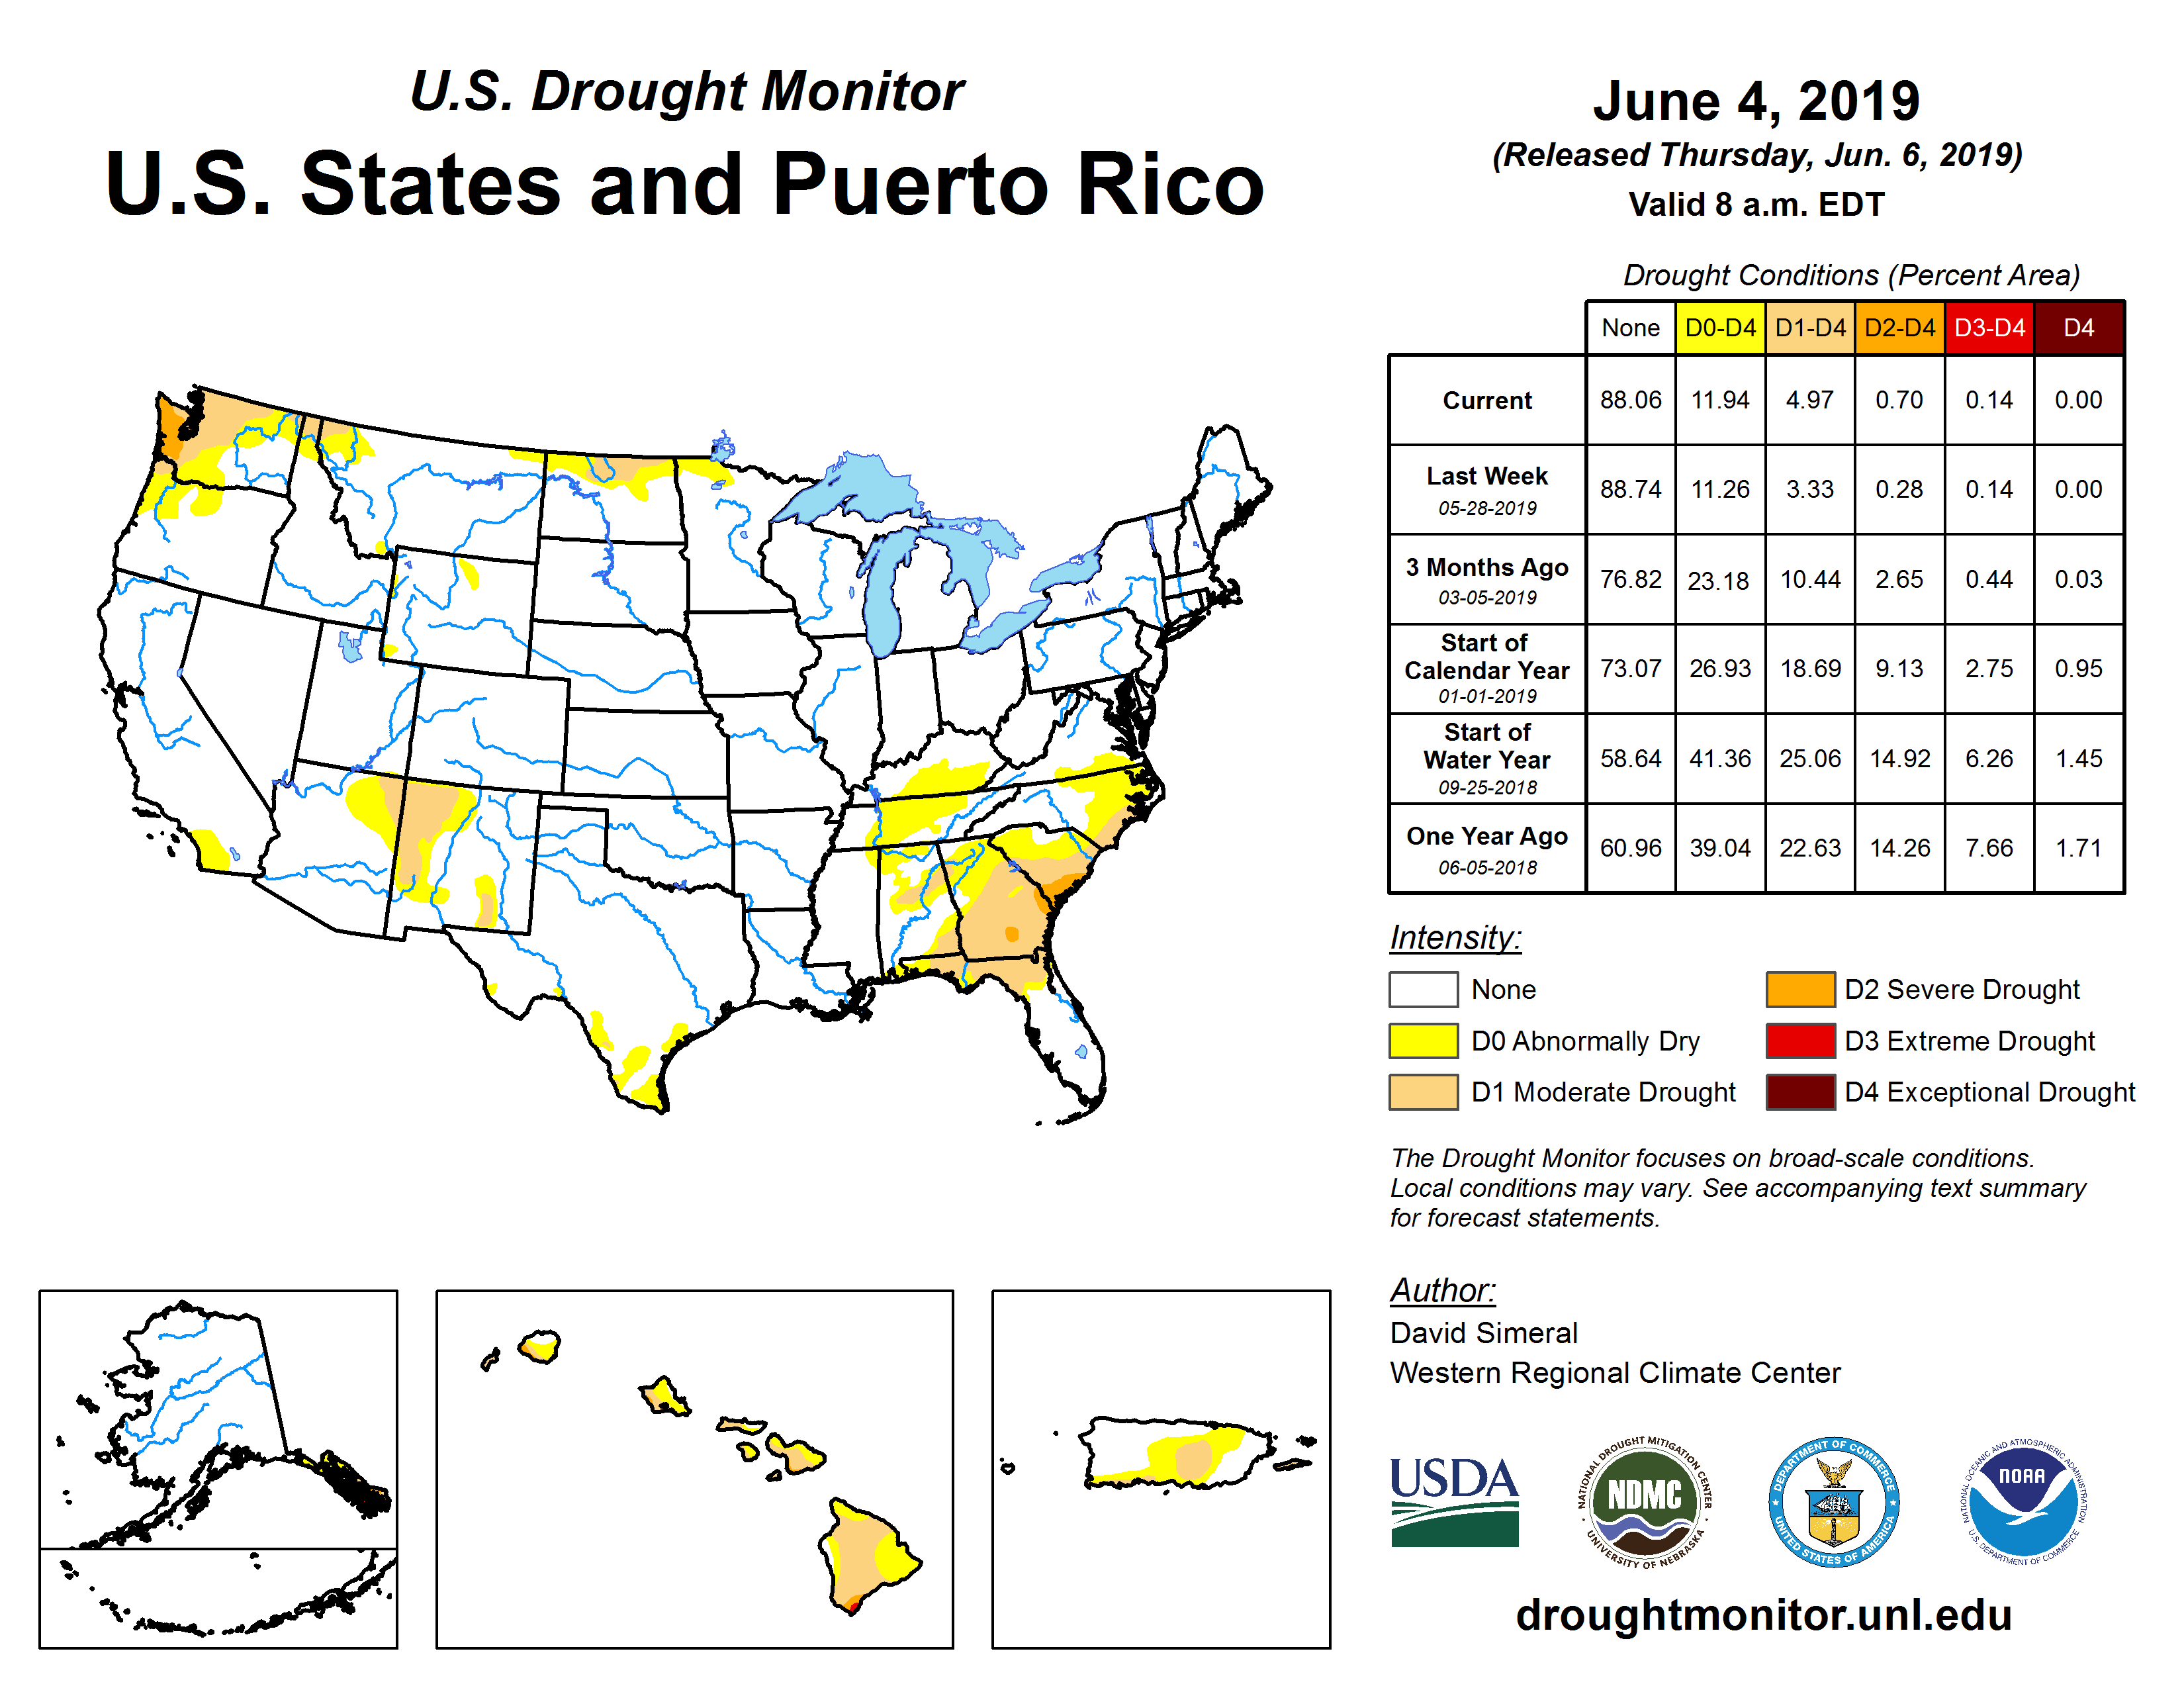
The intense heat in the Southeast increased evapotranspiration (ET), which dried soils. The combination of high ET and low precipitation resulted in expansion of drought in the region. Other areas having persistent dryness and expansion of drought or abnormally dry conditions included the Pacific Northwest, northern Plains, southern Texas, Hawaii, and the USAPI. With expansion exceeding contraction this month, the national level drought area increased from 2.3 percent of the CONUS at the end of April to 5.3 percent of the CONUS at the end of May (from 2.6 percent to 5.0 percent for all of the U.S.).
Severe Weather
There were 555 tornadoes in May 2019 which is roughly twice the long-term average for May of 276. As noted earlier, the persistent trough over the West and ridge over the Southeast set up a southerly flow across the Plains, especially during the last half of the month. This pattern funneled moist air from the Gulf of Mexico, which fueled the severe weather. Fronts and surface lows provided a trigger for storms, with the spreading of the air at upper levels (divergence) enhancing the rising motion. The different directions of the wind flow with height added spin to the rising air, resulting in numerous outbreaks of tornadoes across the Plains and Midwest. These weather features were created and re-created day after day, from May 17 to May 29, as upper-level lows and short-wave troughs, with their surface lows and fronts, plunged into the western long-wave trough and migrated northeastward across the Plains to Great Lakes. Notable tornado outbreaks also occurred during the first week of the month when a similar circulation pattern dominated.
Tropical Systems
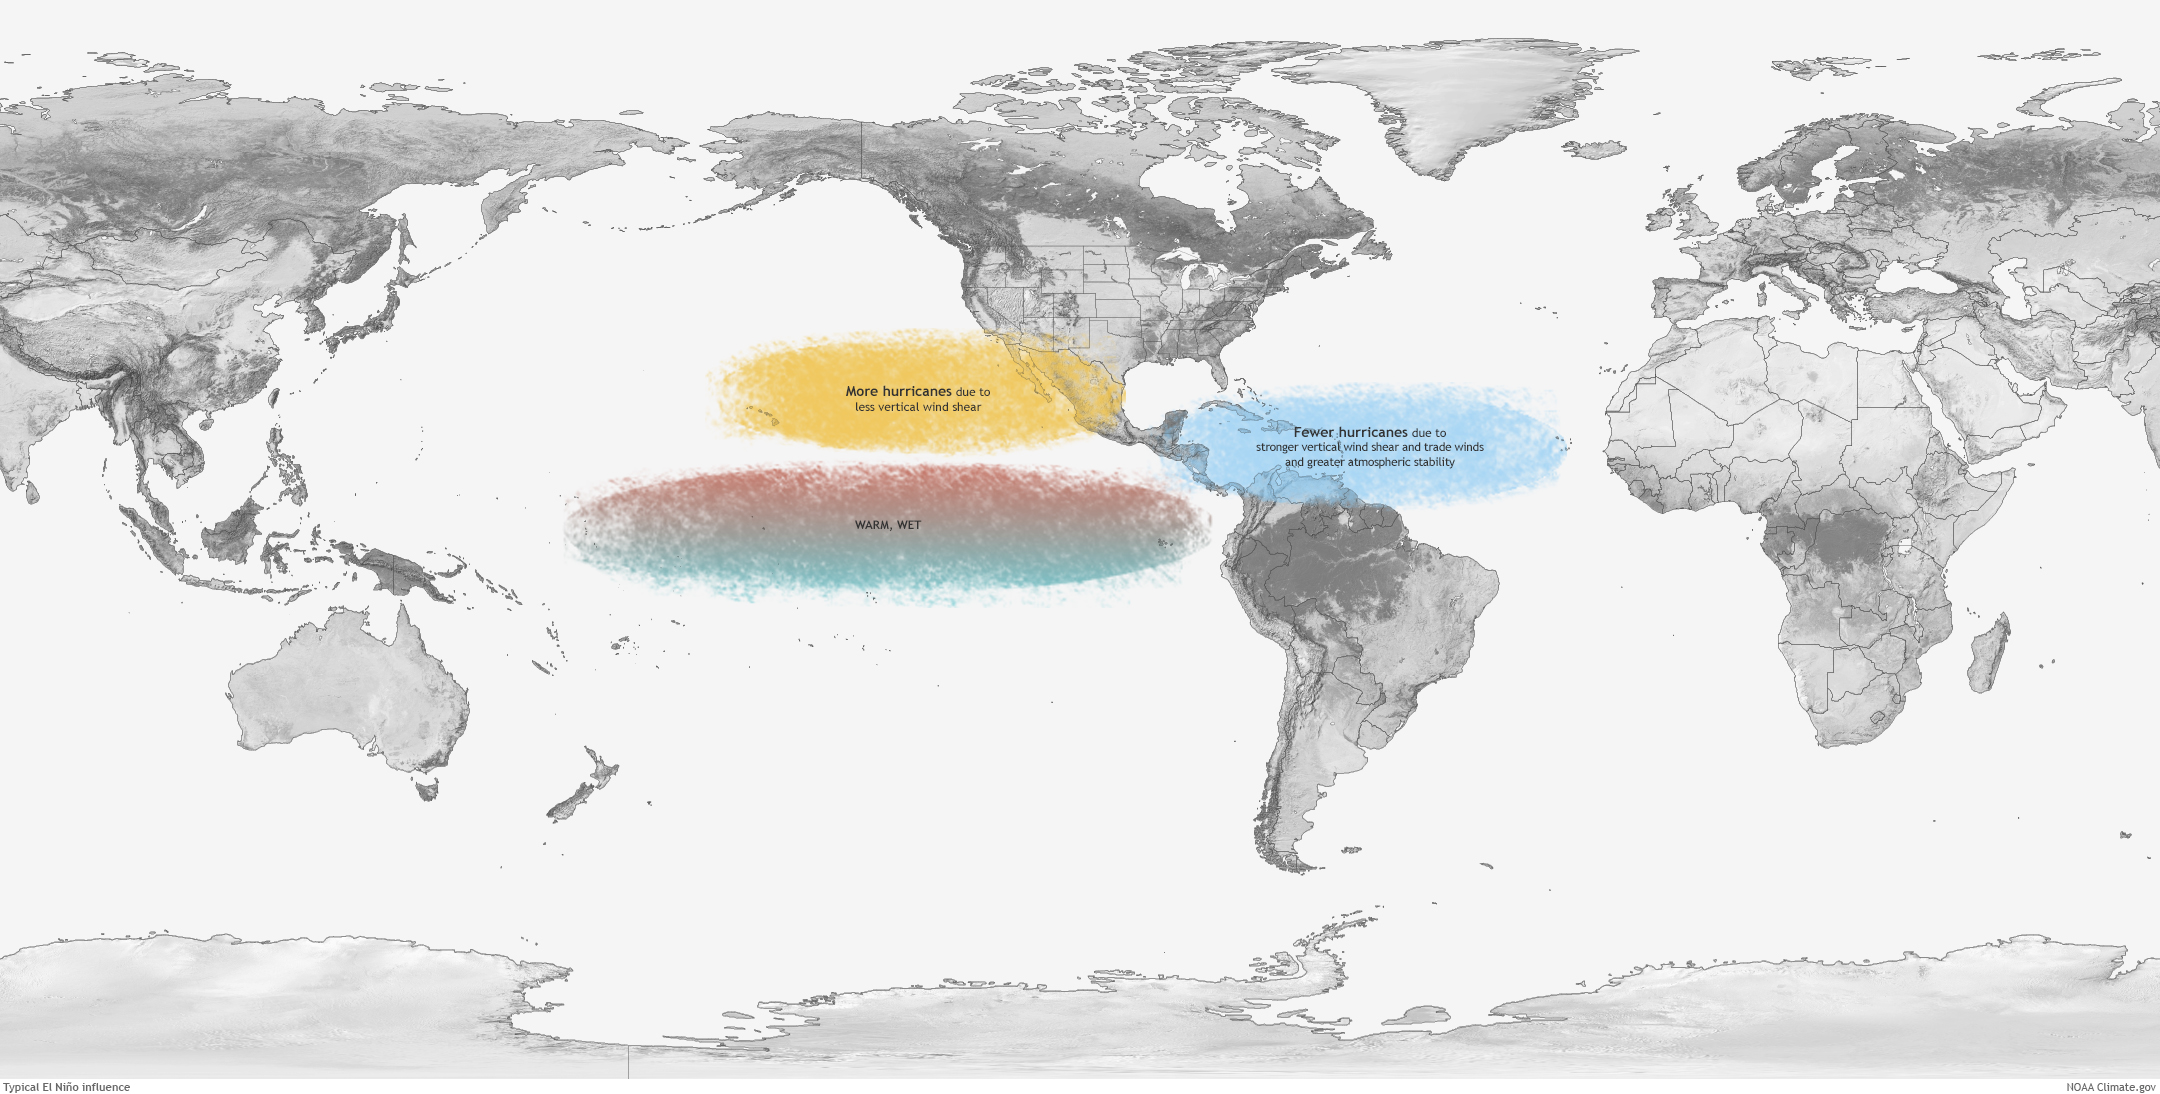
Typically tropical cyclone activity is enhanced in the Eastern North Pacific and inhibited in the North Atlantic during El Niños, and inhibited in the Eastern North Pacific and enhanced in the North Atlantic during La Niñas, due mostly to changes in vertical wind shear during the two extreme events. The relationship is unclear during ENSO-neutral events. Warm sea surface temperatures (SSTs) fuel tropical cyclones while vertical wind shear tears them apart.
- The Atlantic hurricane season runs from June 1st through November 30th and the Eastern North Pacific (ENP) hurricane season runs from May 15th through November 30th.
- No tropical systems developed in the Eastern North Pacific or Central North Pacific during May 2019, although an area of disturbed weather persisted in the Eastern North Pacific just off the Mexican/Central America coast the last half of the month.
- A couple tropical disturbances and one subtropical storm developed in the North Atlantic during May 2019. A trough of low pressure developed over the northwestern Bahamas at the beginning of the month, lasting only a couple days. It moved north, bringing rain to parts of Florida before being absorbed into a cold front. The other tropical disturbance developed at the end of the month. The area of convection (low pressure) that had persisted over the Eastern North Pacific moved inland on the 30th, with an area of low pressure and disturbed weather developing over the western Gulf of Mexico/Yucatan peninsula on the 31st. In between these disturbances, during the middle of the month, a tropical disturbance formed southwest of Bermuda on May 19th. It intensified into Subtropical Storm Andrea on the 20th and lasted only a couple days before being drawn northward by an upper-level low and becoming absorbed into the mid-latitude westerly flow.
- In the U.S.-Affiliated Pacific Islands (USAPI) (Micronesia) portion of the Western North Pacific, a few areas of convection developed, but no tropical systems organized themselves during May. Instead, post El Nino-like weather dominated this region of the Pacific, with dry trade winds blowing from the North Pacific subtropical ridge (North Pacific High) keeping northern portions of the USAPI in drought. When these faster-moving trade winds encountered slower winds near the equator, the resulting convergence generated rainfall throughout the month in the southern portions of Micronesia. This convergence, along with surface troughs and areas of convection, comprised the Inter-Tropical Convergence Zone (ITCZ).
Atmospheric Drivers
- El
Niño Southern Oscillation (ENSO)
- Description: Oceanic and atmospheric conditions in the tropical Pacific Ocean can influence weather across the globe. ENSO is characterized by two extreme modes: El Niño (warmer-than-normal sea surface temperature [SST] anomalies in the tropical Pacific) and La Niña (cooler-than-normal SST anomalies), with the absence of either of these modes termed "ENSO-neutral" conditions. These variations in SST change the locations of the Pacific's largest thunderstorms, which can in turn change circulation patterns around the globe.
- Status: The ocean and atmosphere system reflected a weak El Niño state during May 2019. SSTs were generally 0.5°C–1.0°C warmer than average across most of the equatorial Pacific Ocean, consistent with weak El Niño conditions. Subsurface temperatures cooled under the influence of a upwelling Kelvin wave that was spurred by a trade-wind surge during April. However, the MJO produced a significant westerly wind burst during May, which has begun to force a downwelling wave.
- Teleconnections (influence on weather): The temperature patterns in May 2019 were generally consistent with typical El Niño impacts for May, including the above normal temperatures in the Pacific Northwest and the below normal temperatures to their south and east. However, those cold anomalies generally extend all the way to New England, while in May 2019 they were mostly confined west of the Great Lakes. The wetter than normal conditions across the Southwest and Southern Plains were also broadly consistent with El Niño expectations. However, El Niño generally enhances the May rainfall primarily in Texas and Louisiana, with drier conditions over the upper Mississippi River. In 2019, the largest precipitation anomalies were actually in the Southwest, and the wet anomalies over the Southern Plains were shifted northward from most El Niño events. The largest departures from the El Niño expectations occurred over the Southeast. El Niño usually produces above normal precipitation and near-normal temperatures there, but instead hot and dry anomalies were observed during May 2019.
- Madden-Julian
Oscillation (MJO)
- Description: The MJO is the biggest source of subseasonal (30–60 day) tropical variability. It typically develops as a large envelope of tropical thunderstorms that develops over the Indian Ocean that then moves eastward. Like ENSO, the MJO's effects on tropical rainfall is so strong that it can alter the atmospheric circulation around the globe. The thunderstorms decay when they cross the Pacific, but the associated winds can often continue across the Western Hemisphere to initiate the next MJO in the Indian Ocean. The MJO is episodic, meaning that is not always active. Most indices for tracking the MJO identify both the MJO's amplitude and the longitude of its strongest rainfall, usually described as one of eight phases.
- Status: The MJO was active throughout May. It started the month
over the Maritime Continent (phase 5). It slowed significantly as it crossed
the Pacific, which is typical during El Niño events when the MJO's
thunderstorms couple to the warmer SSTs. The MJO finished the month
redeveloping over the Indian Ocean (phase 2) (MJO updates for May 6, 13, 20, 27, and June 3).
- Teleconnections (influence on weather): The MJO's impacts on the US are typically smaller during May than other months. The primary impacts would be on temperatures in the Mississippi Valley with above normal temperatures when the MJO is over the Western Pacific and below normal as it traverses the Western Hemisphere. However, neither of these materialized during May 2019.
- The Pacific/North
American (PNA) pattern
- Description: The PNA teleconnection pattern is associated with strong fluctuations in the strength and location of the East Asian jet stream. PNA-related blocking of the jet stream flow in the Pacific can affect weather downstream over North America, especially the West and especially in the winter half of the year.
- Status: The daily PNA index oscillated around zero for most of the month, reaching its most positive values around May 8–9 and its most negative values May 23–26, resulting in a slightly negative average for the month as a whole.
- Teleconnections (influence on weather): The positive PNA around May 9 may have contributed to the trough and cooler than normal temperatures over Texas and the central portion of the country. Similarly, the negative PNA is typically associated with a ridge and warmer than normal temperatures over the Southeast, which was consistent with what occurred during the latter half of the month.
- The Arctic
Oscillation (AO) pattern
- Description: The AO teleconnection pattern generally measures the pressure difference between the low pressure over the North Pole and the higher pressures in the subtropical ridges. This pressure difference is larger during a positive AO, resulting in a stronger midlatitude jet. When the AO is negative, the jet is weaker and will have larger troughs and ridges.
- Status: The AO was negative during almost the entire month with just a brief period near-zero late in the month, and averaged negative for the month. The negative AO was primarily due to the ridge over the North Pole and Greenland, as well as the troughs over the North Atlantic and North Pacific.
- Teleconnections (influence on weather): To the extent teleconnections are known, a negative AO in May is typically associated with cooler than average temperatures over the Northern Plains, as was observed during 2019. The negative AO may have also contributed to the drier than normal conditions in the Southeast.
- The North
Atlantic Oscillation (NAO) pattern
- Description: The NAO teleconnection pattern relates the pressure over the sub-polar low near Greenland and Iceland with the subtropical high over the Central Atlantic. It significantly affects the weather on both sides of the Atlantic.
- Status: The NAO was negative throughout May 2019 due to the ridge over Greenland and the troughs over the North Atlantic and Central Europe, and averaged negative for the month.
- Teleconnections (influence on weather): A negative NAO during May generally brings colder than normal conditions across most of the US, except in the Southeast. During May 2019, most of the West and Plains were colder than normal, which agrees with the teleconnection for a negative NAO. The strongest warmth was observed over the Southeast, which is usually closer to normal during a negative NAO. The negative NAO is inconsistent with the abnormally dry conditions over the Southeast.
- The West
Pacific (WP) pattern
- Description: The WP teleconnection pattern is a primary mode of low-frequency variability over the North Pacific and reflects zonal and meridional variations in the location and intensity of the East Asian jet stream in the western Pacific.
- Status: The monthly WP index was negative, due primarily to the ridge over far eastern Russia. (daily index values are not available)
- Teleconnections (influence on weather): The negative WP in May was consistent with cooler-than-normal temperatures over the northern Plains. However, it would usually also be associated with warmer-than-normal temperatures over the Southwest, which did not occur in 2019.
- The East
Pacific-North Pacific (EP-NP) pattern
- Description: The EP-NP teleconnection pattern relates SST and upper-level circulation patterns (geopotential height anomalies) over the eastern and northern Pacific to temperature, precipitation, and circulation anomalies downstream over North America. Its influence during the winter is not as strong as during the other three seasons.
- Status: The monthly EP-NP index was positive, due primarily to the trough in the Central Pacific and the ridge in the Gulf of Alaska. (daily index values are not available)
- Teleconnections (influence on weather): The primary impact of a positive EP–NP is cooler than average conditions across most of the U.S. east of the Rockies. The strongest of these are typically in the Northern Plains, consistent with May 2019.
Global Linkages
- The weak El Niño and the MJO crossing the Pacific combined to create an exceptionally hot and dry premonsoon across India.
- The U.S.-Affiliated Pacific Islands received some rainfall early in May enhanced by the MJO, but then they had below-normal precipitation as the wet phase of the MJO moved eastward across the Pacific.
- Much of central and western Europe had a cooler-than-normal May due to a persistent trough that was part of the negative NAO pattern. Above- normal temperatures occurred over western Russia in association with the downstream ridge in this wavetrain.