Note: This Synoptic Discussion describes recent weather events and climate anomalies in relation to the phenomena that cause the weather. These phenomena include the jet stream, fronts and low pressure systems that bring precipitation, high pressure systems that bring dry weather, and the mechanisms which control these features — such as El Niño, La Niña, and other oceanic and atmospheric drivers (PNA, NAO, AO, and others). The report may contain more technical language than other components of the State of the Climate series.
Summary
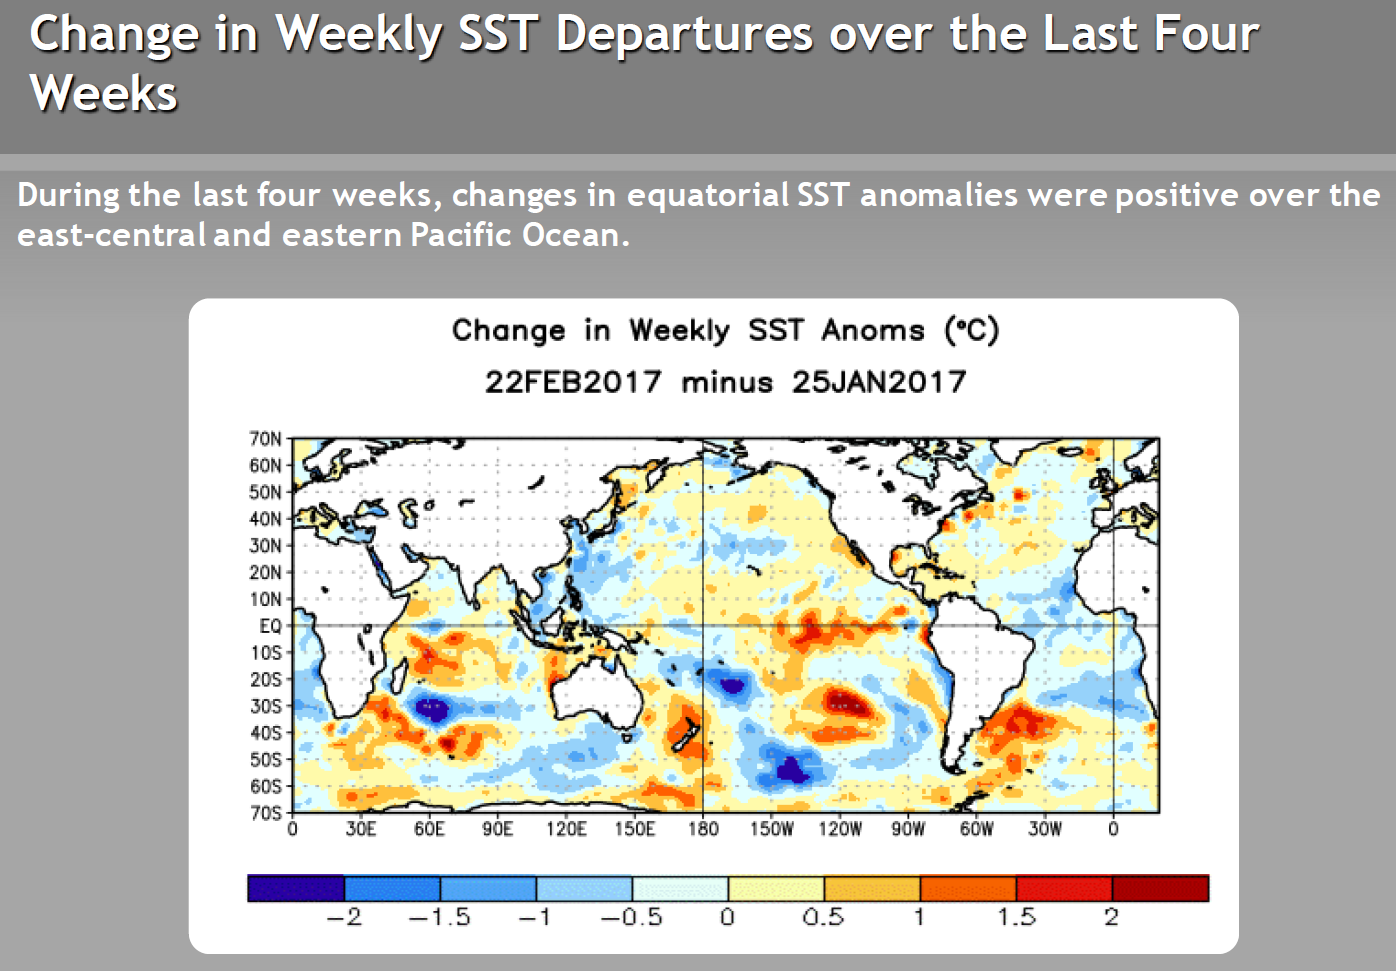
The Earth's ocean-atmosphere system was in an ENSO-neutral state during February 2017. The weather over the contiguous United States (CONUS) this month was dominated by a strong westerly circulation which sent many fronts and low pressure systems across the country. The weather systems dropped above-normal precipitation across much of the West and parts of the Southern Plains and northern tier states. Upper-level ridging reduced the effectiveness of the troughs and fronts east of the Rockies and kept precipitation below normal in many areas in the central and eastern CONUS, but the weather systems were still strong enough to trigger severe weather and an above-normal number of tornadoes. The upper-level ridging also gave most of the country much warmer-than-normal temperatures. The rain and snow contracted drought in the West and Northeast; but, with below-normal precipitation and enhanced evapotranspiration associated with the above-normal temperatures, drought and abnormal dryness expanded from the Mid-Mississippi Valley to Mid-Atlantic Coast. The upper-level circulation, temperature, and precipitation anomaly patterns suggested the atmospheric drivers originating in the mid-latitudes had the greatest influence on the month's weather. See below for details.
Synoptic Discussion
 Animation of daily upper-level circulation for the month.
|
 Animation of daily surface fronts and pressure systems for the month.
|
In the Northern Hemisphere, February marks the end of climatological winter which is the time of year when net solar heating is at its minimum due to the low sun angle, and an expanded circumpolar vortex results in the furthest southern extent of the jet stream. Polar air masses normally dominate the weather over the contiguous U.S. (CONUS), and the warm, dry subtropical high pressure belts have their least influence.
During February 2017, however, it seems climatology was turned on its head. A strong westerly flow dominated the upper-level circulation across the CONUS, with troughs and cutoff lows moving in the jet stream flow. These upper-level systems drove numerous Pacific storm systems and their associated fronts into the western CONUS which gave much of the West above-normal precipitation for the month. Many of these surface low pressure systems would track northeast into the Great Lakes as they traversed the CONUS. Strong troughs and cutoff lows developed in the upper-level flow during the last half of the month and moved across the southern tier states. They brought above-normal precipitation to parts of the Southern Plains, but their effectiveness at producing rain over the Midwest and Southeast to Mid-Atlantic States was reduced by frequent upper-level ridging over the eastern CONUS. Missouri and Illinois in the Midwest, and South Carolina to Delaware along the East Coast, all had the tenth driest, or drier, February in the 1895-2017 record.
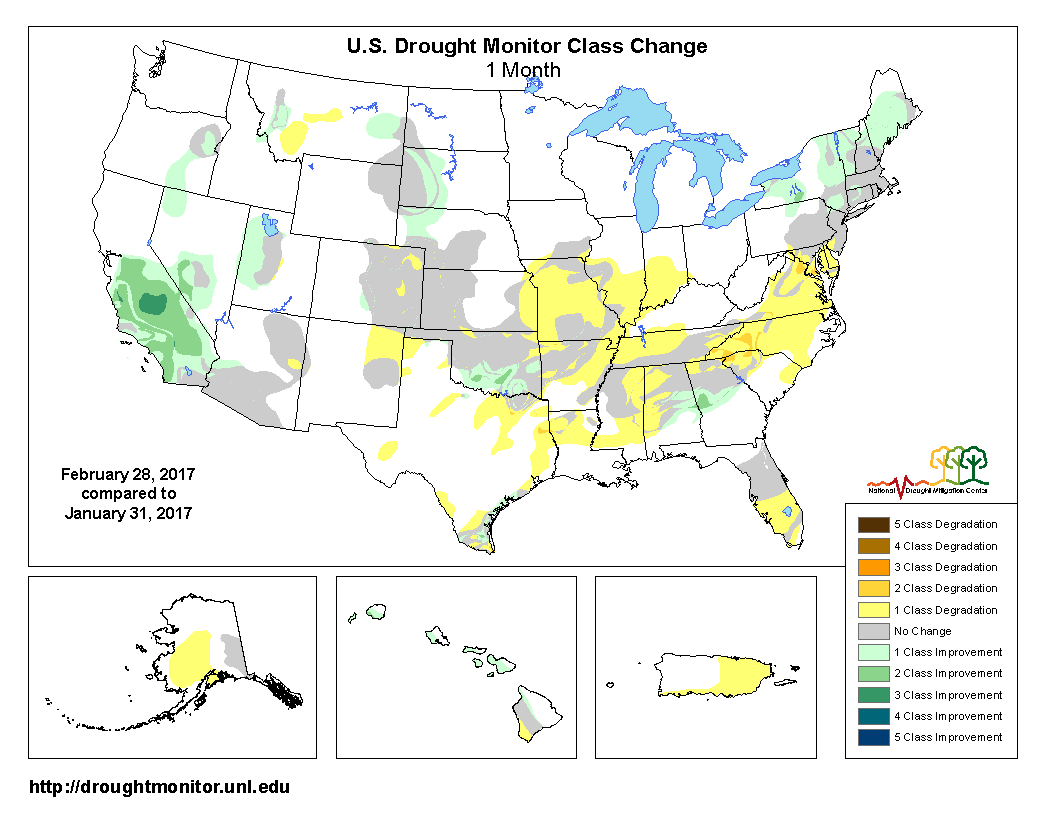
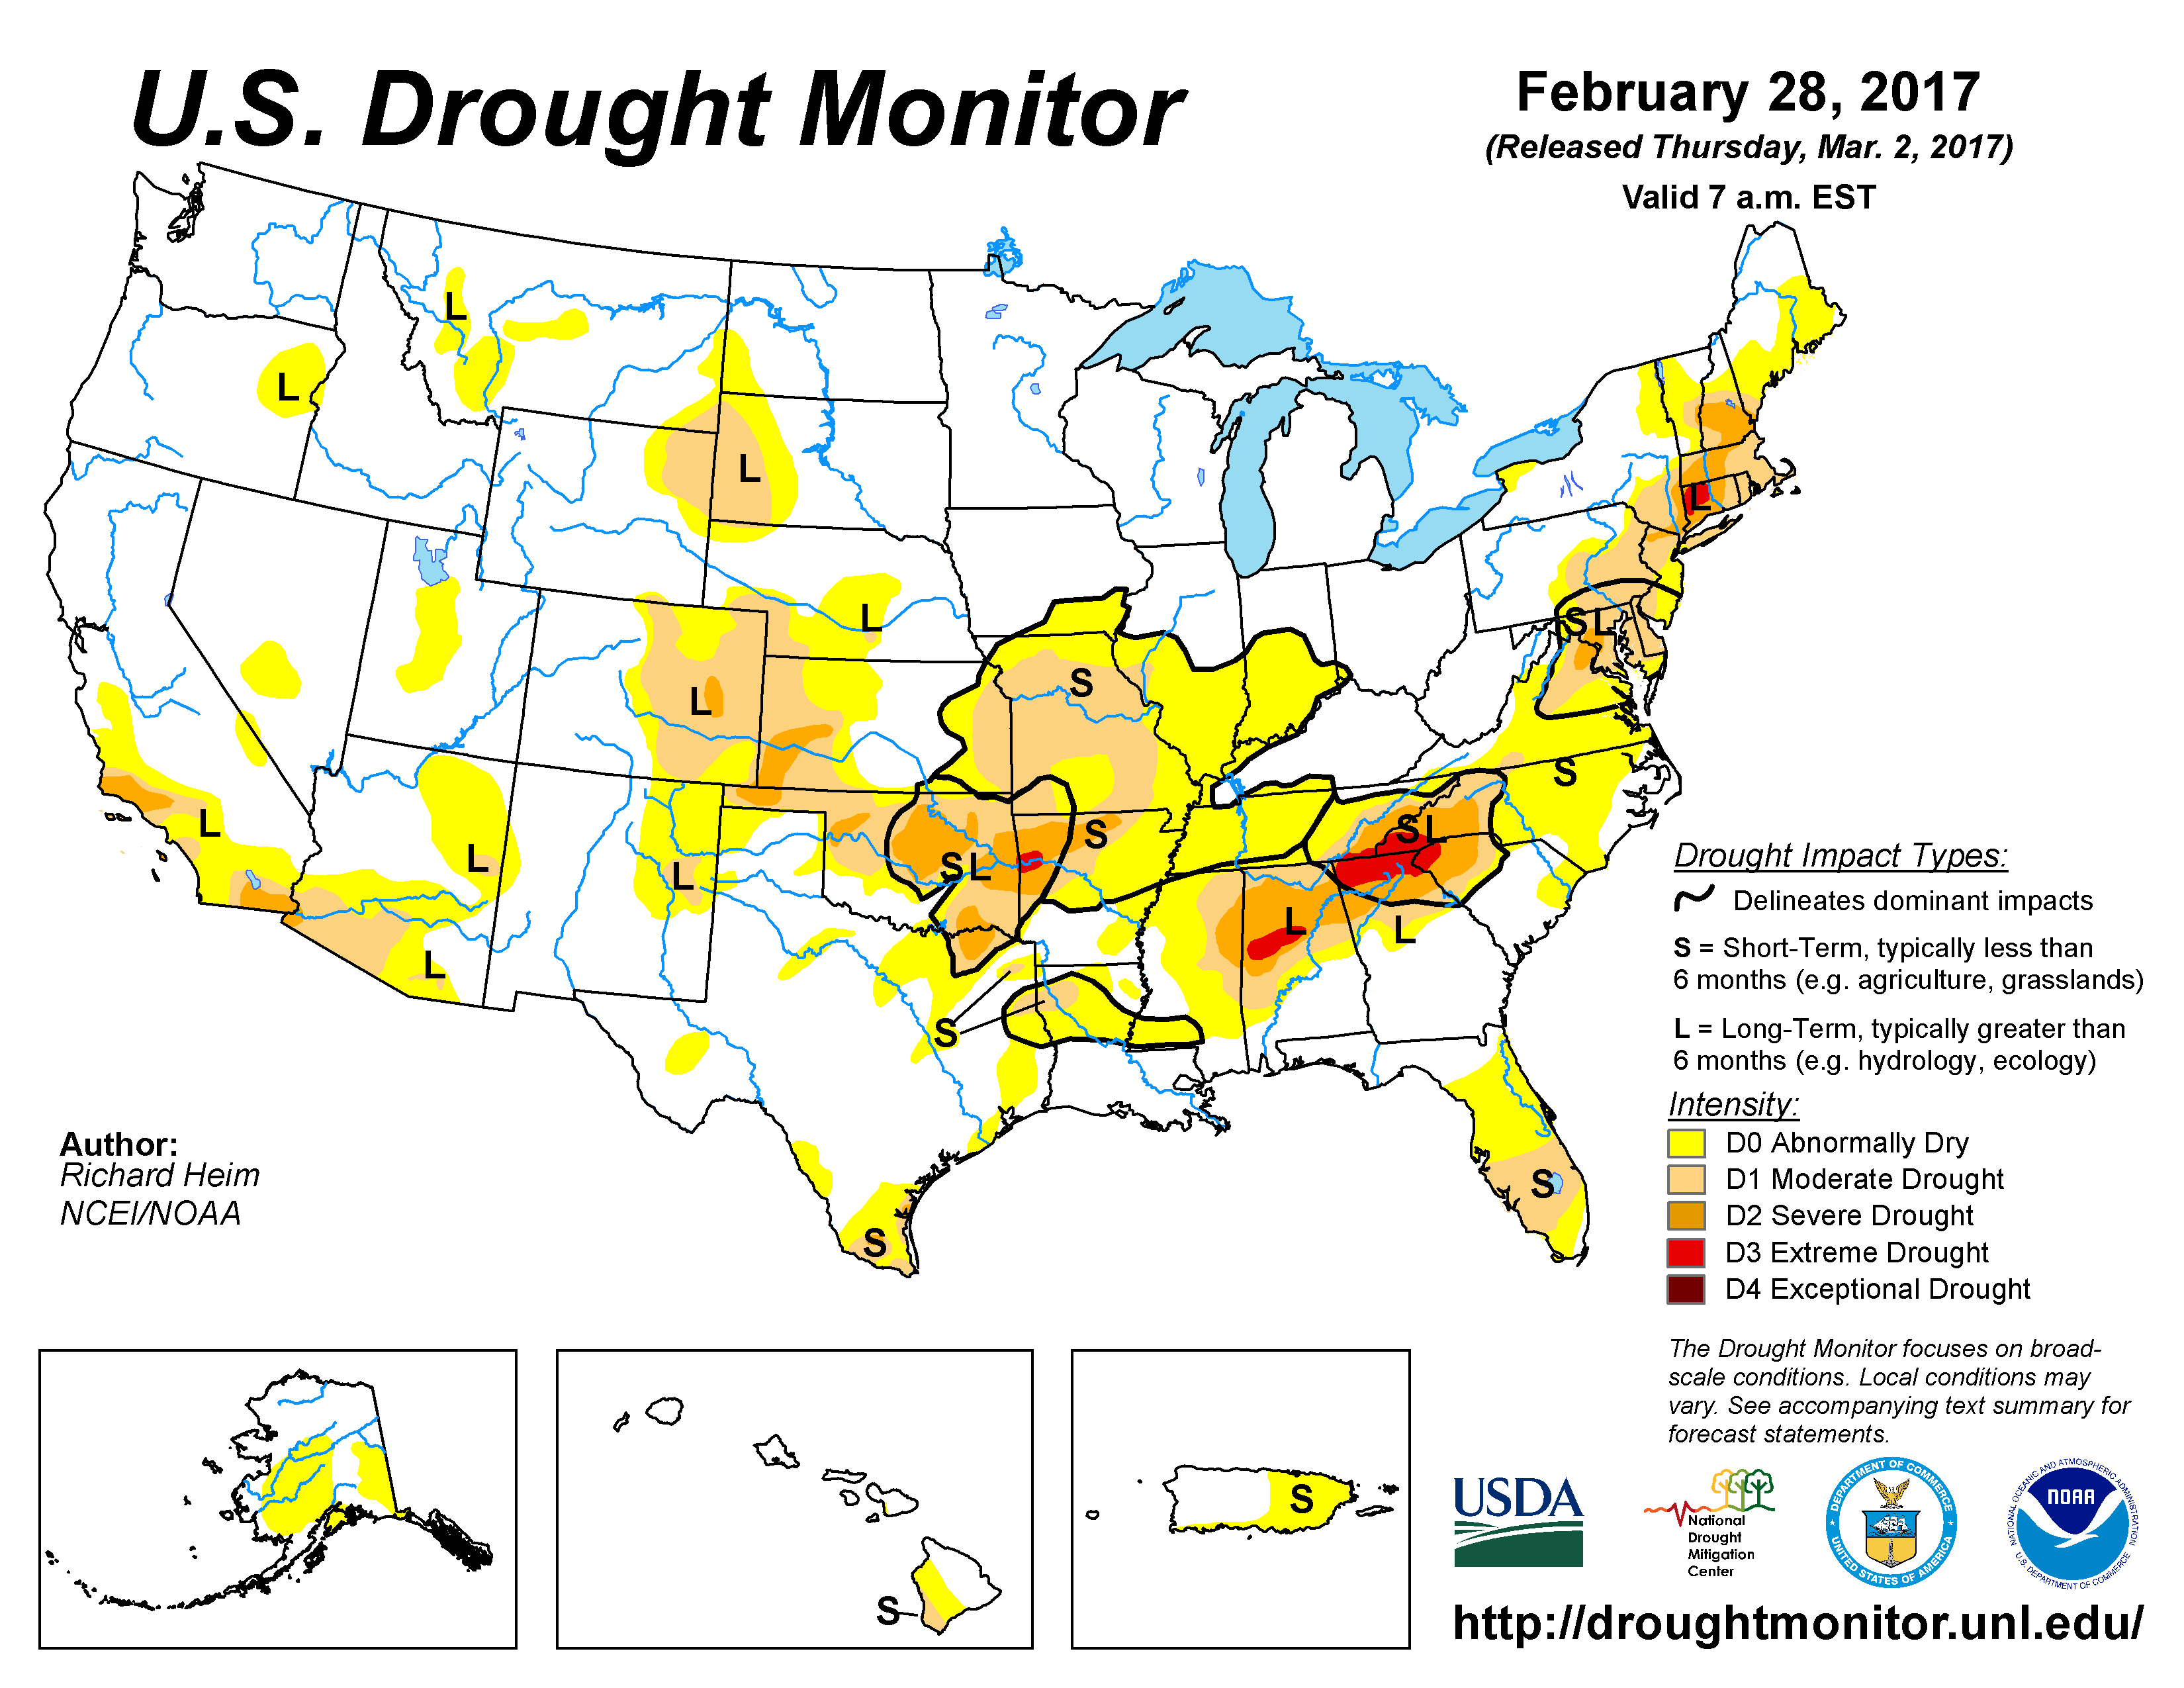
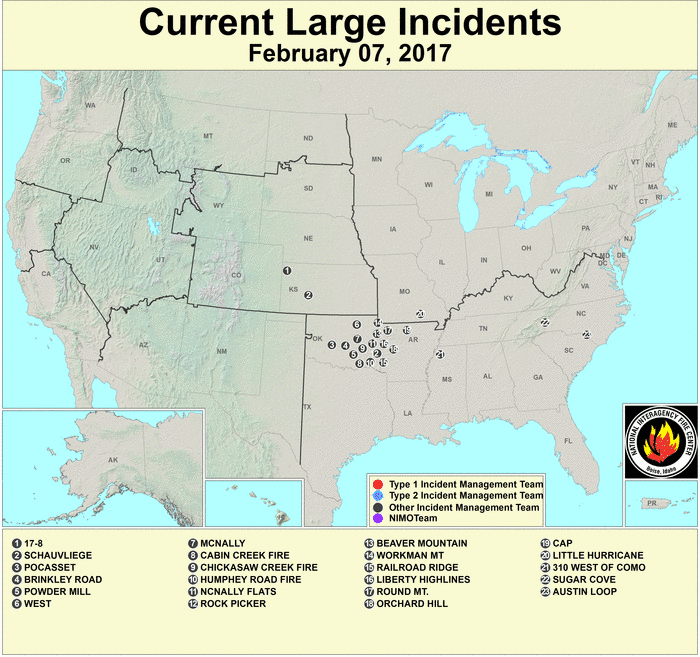
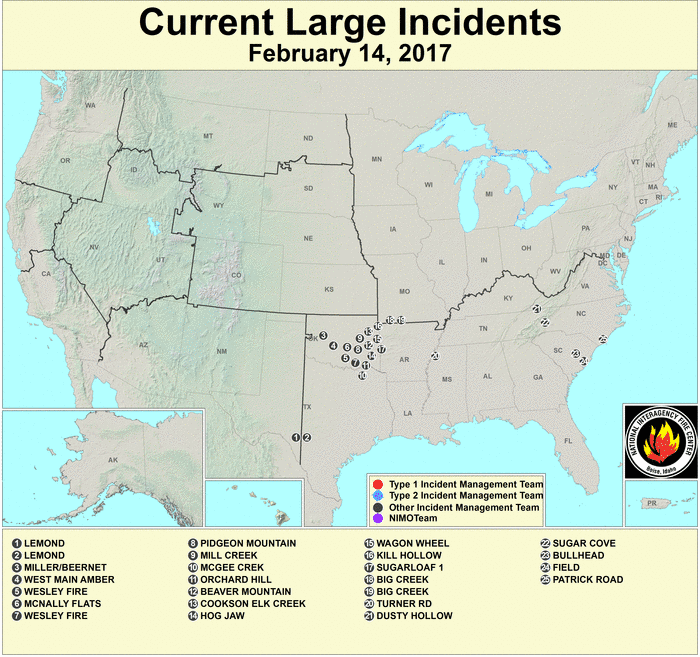
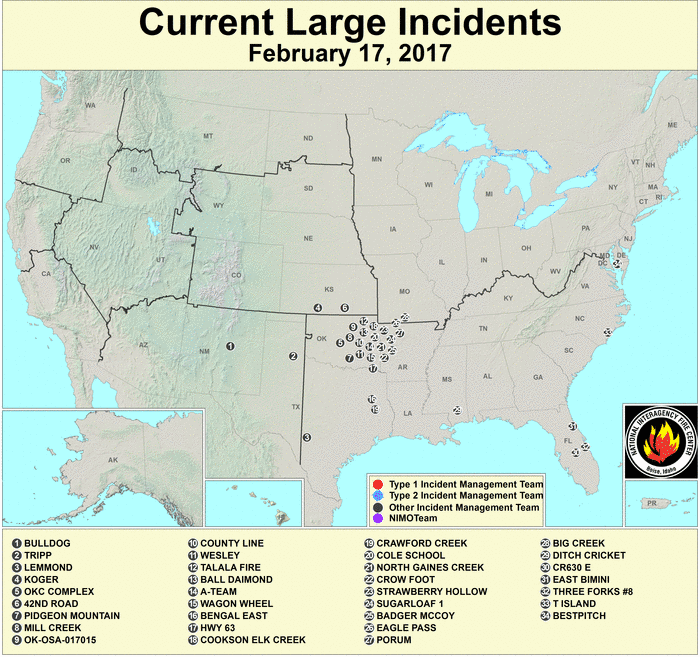
The precipitation contracted drought and abnormally dry areas in parts of the West, Plains, Southeast, and Northeast, but drought and abnormal dryness expanded from the Lower to Mid-Mississippi Valley to Mid-Atlantic States where it was drier than normal. Abnormal dryness also expanded in parts of Alaska and Puerto Rico. The net effect was a slight decrease in the national moderate-to-exceptional drought footprint from 14.6 percent at the end of January to 14.1 percent at the end of February (from 12.2 percent to 11.8 percent for all of the U.S.). Several large wildfires were burning in the Southern Plains, mostly Oklahoma and adjoining Arkansas, when the month began. These continued throughout the month, with additional large wildfires developing in Florida and eastern Kentucky by the end of February (wildfire maps for February 7, 14, 17, 24, 28). Recurrent dryness during most weeks contributed to the persistence of these fires (precipitation anomaly maps for weeks 1, 2, 3, 4, 5).
Like last month, the upper-level troughs and lows tended to favor the northwestern CONUS and western Canada. Their associated cold fronts and moist Pacific air masses kept temperatures cooler than normal for most of the month (temperature anomaly maps for weeks 1, 2, 3, 4, 5). For the month as a whole, temperatures were cooler than normal in the Pacific Northwest (mostly just Washington). But the upper-level ridging which dominated the central and eastern portions of the CONUS brought much above-normal to record-warm temperatures. Sixteen states from Texas to New York had the warmest February in the 1895-2017 record. The REDTI (Residential Energy Demand Temperature Index) for February 2017 ranked lowest in the 123-year record for the month. This was due to above-normal temperatures across most of the CONUS which reduced heating demand in the high population centers. There were 11,743 record warm daily high (6,309) and low (5,434) temperature records. This was about 28 times the 418 record cold daily high (290) and low (128) temperature records that were associated with the air masses behind the cold fronts. Of these daily records, 1,151 (709 warm highs and 442 warm lows) were records for the month. The combination of warm and cold extremes resulted in the second warmest February, nationally, in the 1895-2017 record.
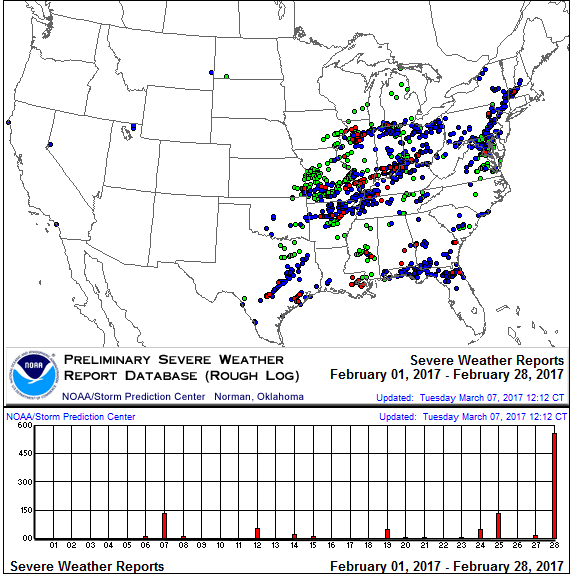
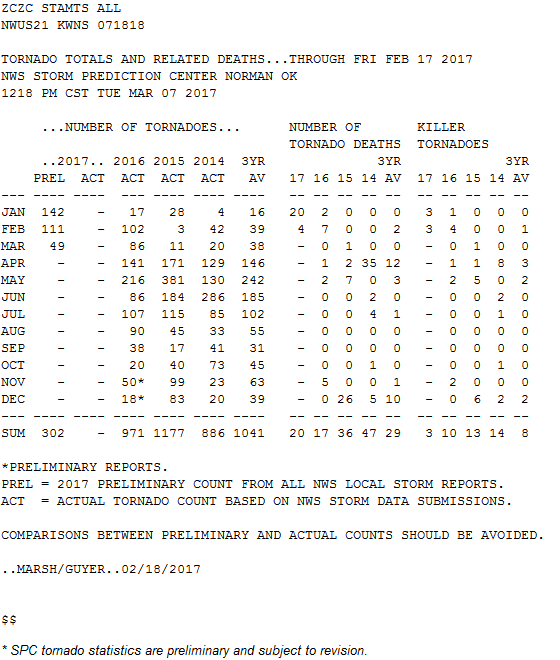
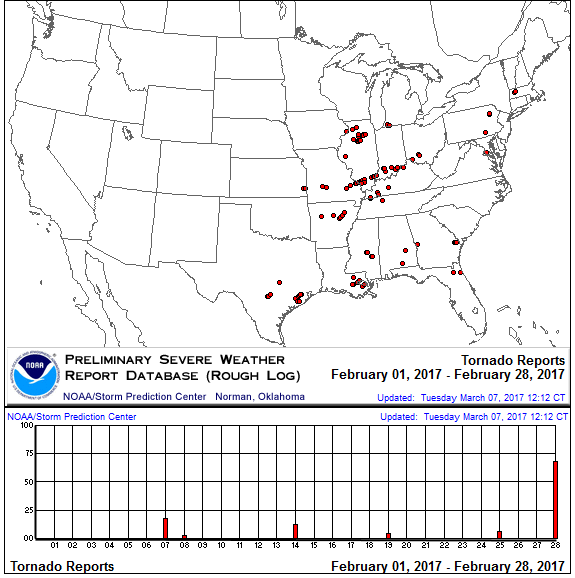
In spite of the downstream ridging in the jet stream, cold fronts and low pressure systems still moved across the eastern CONUS. Some of the fronts and surface lows were very strong and combined with upper-level lows to create unstable air and dynamics favorable for severe weather. Based on preliminary data, there were 111 tornadoes in February 2017, which is nearly four times the February average of 29. Most occurred in the Southern Plains, Southeast, and Midwest where Gulf of Mexico moisture was drawn in to the powerful upper-level troughs and surface fronts and low pressure systems.
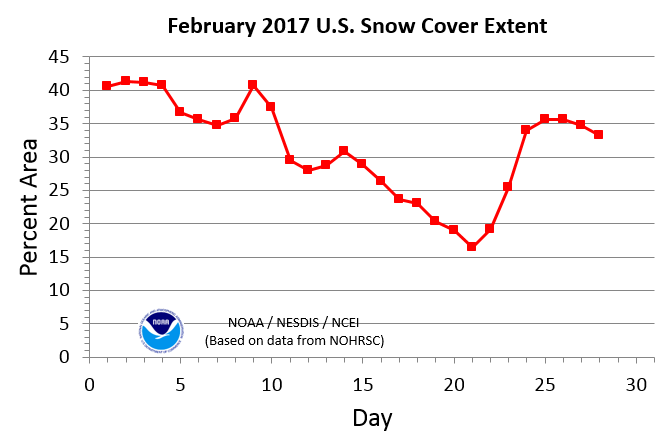
Below-freezing air behind the cold fronts and surface lows caused precipitation to fall as snow instead of rain. The month began with about 41 percent of the CONUS snowcovered. The warmer-than-normal (above-freezing) temperatures melted more and more snow as the month progressed, with the snow cover area reaching a low point of about 16 percent on February 21. A storm system near the end of the month brought the snow cover area back up to about 35 percent. Based on the 1966-2017 satellite record, February 2017 had the 12th smallest February snow cover area for the CONUS and 15th smallest for North America, based on the 1966-2017 satellite record, with the storm track keeping snow cover above-normal for the month across parts of the West, Northern Plains, and New England.
The tropical Pacific ocean-atmosphere system was in an ENSO-neutral state during February. With the North Atlantic and eastern tropical Pacific oceans out of season for tropical cyclones, no tropical systems developed in these two basins during February. But several tropical disturbances developed in the South Pacific, including Tropical Cyclone Bart which developed near American Samoa.
The Climate Extremes Index (CEI) aggregates temperature and precipitation extremes across space and time. Temperature and precipitation extremes occurred during the month in many areas with several regions having a top ten integrated regional CEI. The East North Central region had the second most extreme wet spell component, and third most extreme warm minimum and sixth most extreme warm maximum temperature components, contributing to the third most extreme regional CEI in the 1910-2017 record. The South region had the most extreme warm minimum and warm maximum temperature components, contributing to the third most extreme regional CEI. The Southeast region had the most extreme warm maximum and sixth most extreme warm minimum temperature components, contributing to the fourth most extreme regional CEI. The Northeast region had the fourth most extreme warm minimum and third most extreme warm maximum temperature components, contributing to the sixth most extreme regional CEI. The Central region had the most extreme warm minimum and warm maximum temperature components, contributing to the seventh most extreme regional CEI. The West region had the most extreme one-day heavy precipitation component, ninth most extreme wet spell component, and tenth most extreme warm minimum temperature component, contributing to the tenth most extreme regional CEI. When aggregated across the nation, February 2017 had the most extreme warm minimum and second most extreme warm maximum temperature components, which contributed to the second most extreme national February CEI in the 108-year record.
 North America monthly upper-level circulation pattern and anomalies. The upper-level circulation pattern, averaged for the month, consisted of below-normal upper-level (500-mb) height anomalies over the northwestern CONUS, resulting from troughs frequently moving across the area, and above-normal height anomalies over the southwest, central, and eastern CONUS. Of the circulation indices usually discussed on this page, the teleconnections for a negative TNH come closest to the February 2017 500-mb circulation anomalies. |
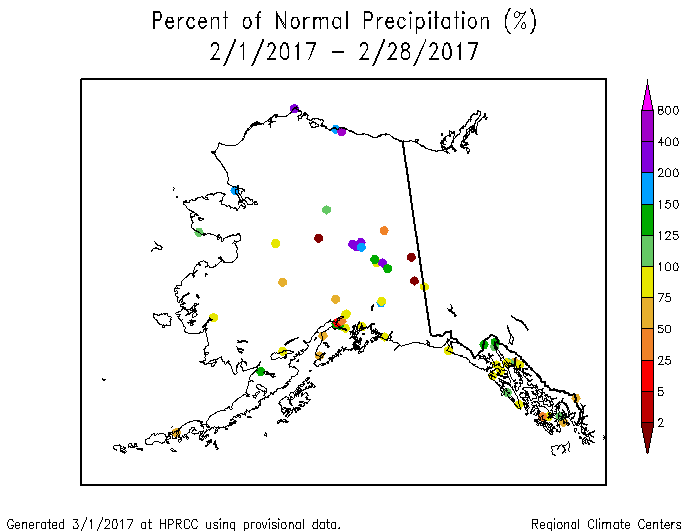
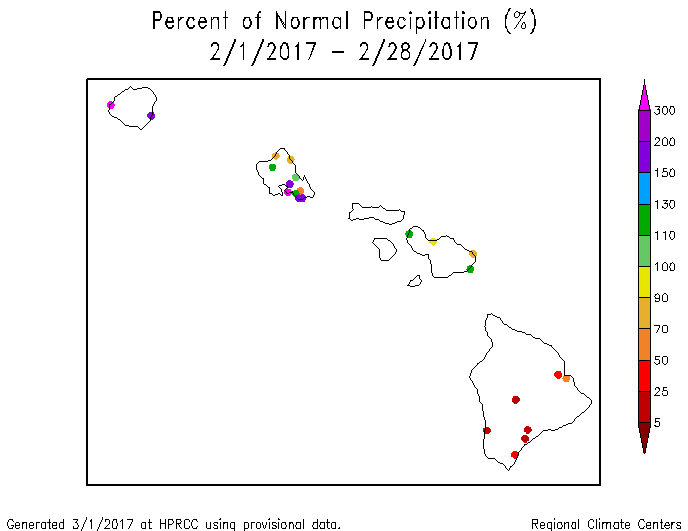
 Map of monthly precipitation anomalies. Precipitation was above normal across much of the West and parts of the Plains, Great Lakes, and Northeast. Below-normal precipitation could be found across most of the Lower Mississippi Valley and Southeast to Southern New England, parts of the Northern Plains, and the Central Plains to Ohio and Tennessee Valleys. Alaska was drier than normal in the west and south, and wetter than normal in the northeast. In Hawaii, February was drier than normal in the southern islands to wetter than normal in the northern islands. Puerto Rico was drier than normal except in the northwest where it was wetter than normal for the month. |
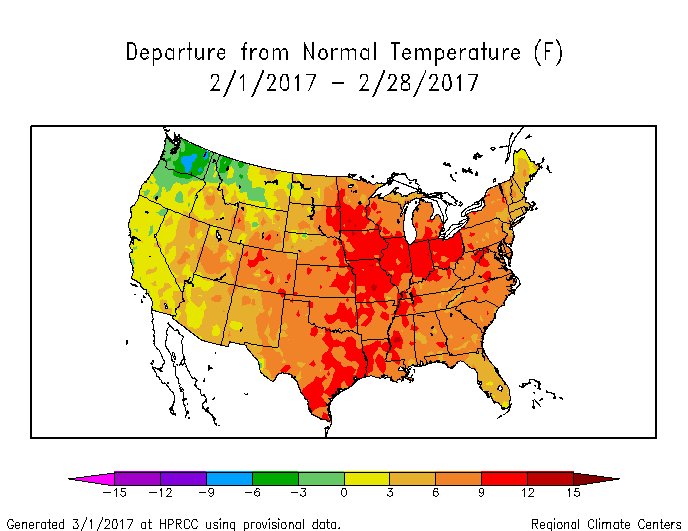 Map of monthly temperature anomalies. February 2017 was cooler than normal across parts of the Pacific Northwest, mainly Washington, and warmer than normal across the rest of the CONUS. Alaska was warmer than normal in the north and east, and cooler than normal in the south and west. |
 Northern Hemisphere monthly upper-level circulation pattern and anomalies. Global Linkages: The upper-level (500-mb) circulation anomaly pattern over North America was part of a complex long-wave pattern that stretched across the Northern Hemisphere. East-west trough/ridge couplets could be seen (trough or below-normal heights over the western CONUS, North Atlantic, and western Russia coupled with ridge or above-normal heights over eastern North America, North Atlantic, eastern Europe, and eastern Asia). These couplets illustrate the wave nature of the atmosphere. The above-normal 500-mb heights were associated with upper-level ridging at the mid-latitudes, below-normal precipitation (in Turkey and the eastern CONUS), below-normal snow cover (over parts of Europe and the eastern CONUS), and above-normal surface temperatures over much of Eurasia and eastern North America, and in parts of the North Atlantic. The areas of below-normal 500-mb heights were associated with upper-level troughing; near- to below-normal surface temperatures over the northwestern CONUS, western Russia, and the northeastern North Pacific; above-normal precipitation over the western CONUS and western Russia; and above-normal snow cover over parts of the northwestern CONUS and southwestern Asia. With most of the continents having warmer-than-normal temperatures, and large portions of the Atlantic and Pacific Oceans having warmer-than-normal sea surface temperatures, the February 2017 global temperature was above normal. |
Atmospheric Drivers
Subtropical highs, and fronts and low pressure systems moving in the mid-latitude storm track flow, are influenced by the broadscale atmospheric circulation. The circulation of the atmosphere can be analyzed and categorized into specific patterns. The Tropics, especially the equatorial Pacific Ocean, provides abundant heat energy which largely drives the world's atmospheric and oceanic circulation. The following describes several of these modes or patterns of the atmospheric circulation, their drivers, the temperature and precipitation patterns (or teleconnections) associated with them, and their index values this month:
-
El Niño Southern Oscillation (ENSO)
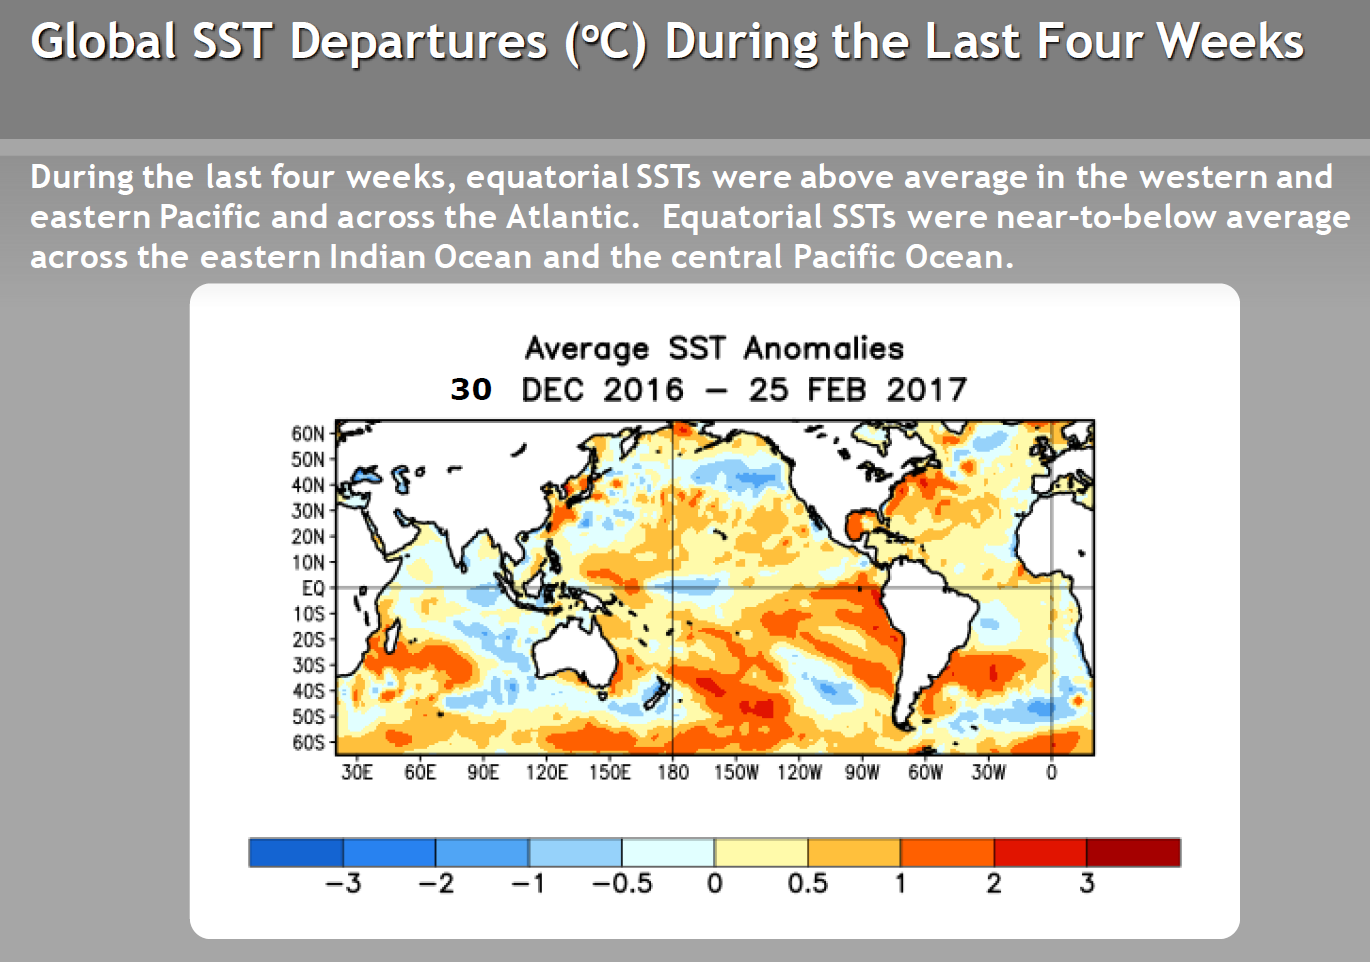
- Description: Oceanic and atmospheric conditions in the tropical Pacific Ocean can influence weather across the globe. ENSO is characterized by two extreme modes: El Niño (warmer-than-normal sea surface temperature [SST] anomalies in the tropical Pacific) and La Niña (cooler-than-normal SST anomalies), with the absence of either of these modes termed "ENSO-neutral" conditions.
- Status: ENSO-neutral conditions were present during February 2017 with near-average SSTs in the central and east-central equatorial Pacific and above-average SSTs increasing in the eastern equatorial Pacific .
- Teleconnections (influence on weather): The NWS CPC has no teleconnections for ENSO-neutral conditions.
-
Madden-Julian Oscillation (MJO)
- Description: The MJO is a tropical disturbance or "wave" that propagates eastward around the global tropics with a cycle on the order of 30-60 days. It is characterized by regions of enhanced and suppressed tropical rainfall. One of its indices is a phase diagram which illustrates the phase (1-8) and amplitude of the MJO on a daily basis. The MJO is categorized into eight "phases" depending on the pattern of the location and intensity of the regions of enhanced and suppressed tropical rainfall. The MJO can enter periods of little or no activity, when it becomes neutral or incoherent and has little influence on the weather. Overall, the MJO tends to be most active during ENSO-neutral years, and is often absent during moderate-to-strong El Niño and La Niña episodes.
- Status: The MJO index transitioned quickly through phases 5 through 8, then 1 and 2 during the month. The MJO competed with other aspects of the tropical ocean-atmosphere system (referred to in the CPC reports as the background state, and the often destructive interference frequently obscured MJO's influence (MJO updates for February 6, 13, 20, and 27).
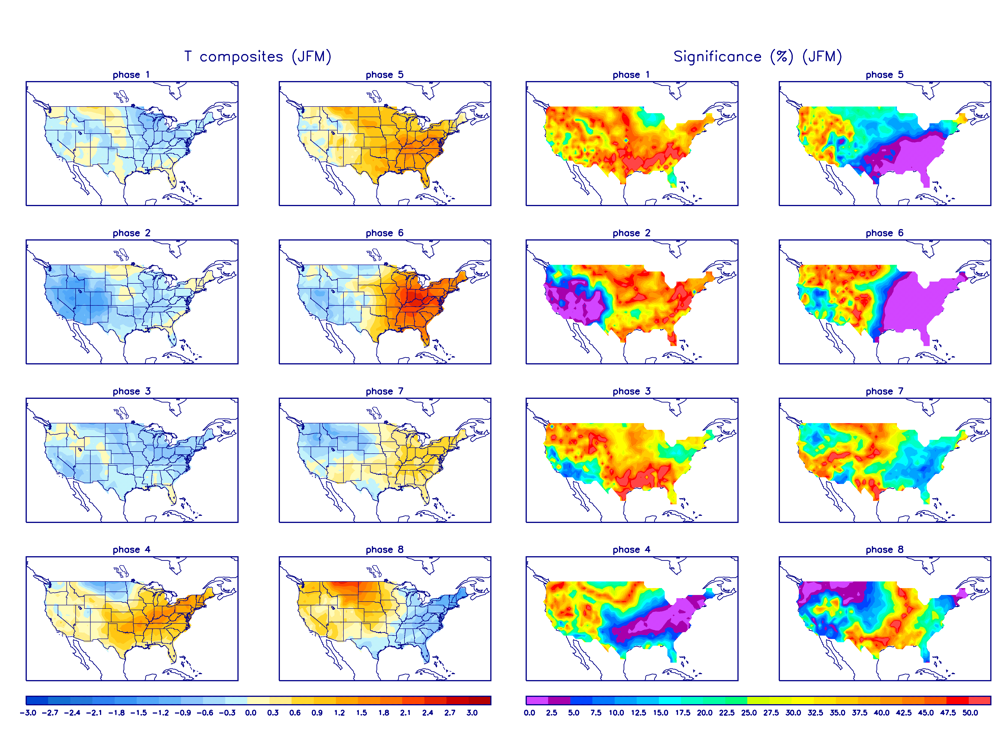
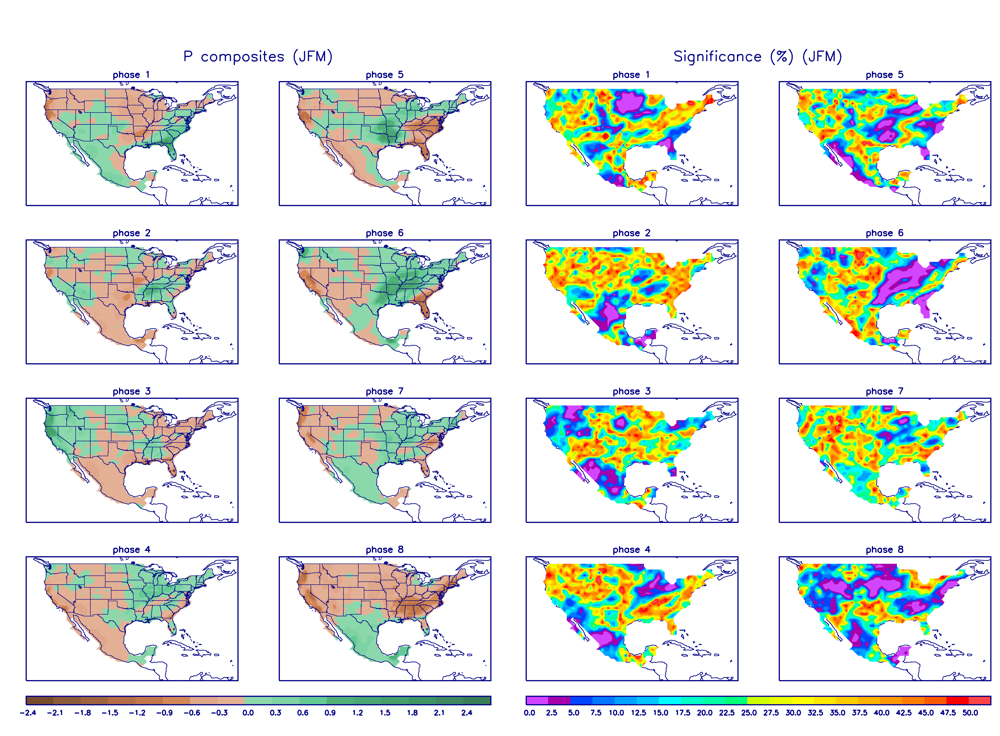
- Teleconnections (influence on weather): The MJO's temperature and precipitation teleconnections to U.S. weather depend on time of year and MJO phase. To the extent teleconnections are known, the February (January-March) teleconnections for temperature are shown here and for precipitation are shown here.
- Comparison to Observed: The MJO is transitory and can change phases (modes) within a month, so it is more closely related to weekly weather patterns than monthly. In the case of February 2017, the MJO index transitioned through several phases (5-8, then 1-2) during the month. The monthly temperature anomaly pattern suggests an integration of the patterns expected with phases 5-8, and the weekly temperature anomaly patterns (weeks 1, 2, 3, 4, 5) are fairly consistent with the teleconnections expected with the corresponding phases, except for week 4 whose warm temperature anomalies aren't consistent with the cold anomalies expected with phases 1-2. The monthly precipitation anomaly pattern, and the weekly precipitation anomaly patterns, generally do not match the precipitation anomaly patterns expected with this month's MJO.
- The Pacific/North American (PNA) pattern
- Description: The PNA teleconnection pattern is associated with strong fluctuations in the strength and location of the East Asian jet stream. PNA-related blocking of the jet stream flow in the Pacific can affect weather downstream over North America, especially the West and especially in the winter half of the year.
- Status: The daily PNA index started the month positive then transitioned to negative, averaging near zero for the month as a whole. The 3-month-averaged index was slightly negative.
- Teleconnections (influence on weather): No teleconnections are provided for a neutral (zero) PNA.
- Comparison to Observed: However, the February 2017 temperature and upper-level circulation anomaly patterns are a reasonable match for a negative PNA.
- The Arctic Oscillation (AO) pattern
- Description: The AO teleconnection pattern relates upper-level circulation over the Arctic to circulation features over the Northern Hemisphere mid-latitudes and is most active during the cold season.
- Status: The daily AO index was generally negative the first half of the month and positive the second half, averaging positive for the month. The 3-month-averaged index was also positive.
- Teleconnections (influence on weather): To the extent teleconnections are known, a positive AO in February (January-March in the AO Composites table) is typically associated with a few areas of dryness in the Southeast, Northeast, and California; scattered wet conditions along the Pacific Northwest coast and in the Tennessee to Mid-Mississippi Valley; above-normal temperatures for most of the CONUS east of the Rockies; and upper-level circulation anomalies which are below normal across the Arctic into northern Canada, and above normal across the North Pacific and from the eastern CONUS to North Atlantic and Western Europe.
- Comparison to Observed: The February 2017 monthly temperature anomaly pattern is a good match for that expected with a positive AO. The precipitation and upper-level circulation anomaly patterns have little agreement.
- The North Atlantic Oscillation (NAO) pattern
- Description: The NAO teleconnection pattern relates upper-level circulation over the North Atlantic Ocean to circulation features over the Northern Hemisphere mid-latitudes.
- Status: The daily NAO index was positive for most of the month, averaging positive for the month. The 3-month-averaged index was also positive.
- Teleconnections (influence on weather): To the extent teleconnections are known, a positive NAO during this time of year (January on the quarterly teleconnection maps) is associated with above-normal upper-level circulation anomalies over all of the CONUS except the West Coast; below-normal circulation anomalies over northern Canada to Greenland and Iceland; and above-normal temperature anomalies across most of the CONUS east of the Rockies. The precipitation teleconnections are very weak, with only drier-than-normal anomalies from California to Nevada.
- Comparison to Observed: The February 2017 temperature anomaly pattern agrees with that expected with a positive NAO over the CONUS east of the Rockies. The upper-level circulation anomaly pattern agrees over the CONUS, but not over Canada to Iceland. The precipitation anomaly pattern disagrees in the West but there are very few teleconnections.
- The West Pacific (WP) pattern
- Description: The WP teleconnection pattern is a primary mode of low-frequency variability over the North Pacific and reflects zonal and meridional variations in the location and intensity of the (East Asian) jet stream in the western Pacific.
- Status: The monthly WP index and three-month average WP index were both positive.
- Teleconnections (influence on weather): To the extent teleconnections are known, a negative WP during this time of year (January on the quarterly teleconnection maps) is typically associated with below-normal temperatures across the Upper Midwest to Northeast; above-normal temperatures over much of the West; below-normal precipitation in the Mid-Mississippi to Ohio Valleys; below-normal circulation anomalies over eastern North America; and above-normal circulation anomalies over the western CONUS.
- Comparison to Observed: The February 2017 monthly upper-level circulation and temperature anomaly patterns show little agreement or are opposite those patterns expected with a negative WP. The precipitation anomaly pattern, however, does agree where teleconnections exist.
- The Tropical/Northern Hemisphere (TNH) pattern
- Description: The TNH teleconnection pattern reflects large-scale changes in both the location and eastward extent of the Pacific jet stream, and also in the strength and position of the climatological mean Hudson Bay Low, and is dominant in the winter months. The pattern significantly modulates the flow of marine air into North America, as well as the southward transport of cold Canadian air into the north-central United States.
- Status: The TNH index was slightly negative during February.
- Teleconnections (influence on weather): To the extent teleconnections are known, a negative TNH is typically associated with warmer-than-normal temperatures for much of the country as well as eastern Canada, wetter-than-normal conditions in the West, and slightly drier-than-normal conditions in the Tennessee Valley. The upper-level circulation anomalies for a negative TNH are above-normal 500-mb geopotential heights over the eastern two-thirds of Canada and the north central U.S., and below-normal heights over the northeastern Pacific and Gulf of Mexico into the western North Atlantic.
- Observed: Even though the TNH index is only slightly negative, the February 2017 monthly temperature and precipitation anomaly patterns show good agreement with the teleconnections, and the upper-level circulation anomaly pattern has strong similarities but appears slightly shifted in latitude. The temperature anomaly pattern matches well across North America.
- The East Pacific-North Pacific (EP-NP) pattern
- Description: The EP-NP teleconnection pattern relates SST and upper-level circulation patterns (geopotential height anomalies) over the eastern and northern Pacific to temperature, precipitation, and circulation anomalies downstream over North America. Its influence during the winter is not as strong as during the other three seasons.
- Status: The North Pacific SSTs had a patchwork pattern of warming and cooling compared to the previous month, with the net result being a continuation of an SST anomaly pattern consisting of cooler-than-normal SST anomalies between 40 and 50 degrees North latitude that stretched from the International Date Line to the North American coast, and warmer-than-normal SSTs north and south of this cool area. The SST anomalies next to the North American coast were cooler than normal in the north and warmer than normal in the south. The average sea level pressure field and its anomaly field for February suggest that the Aleutian Low over the North Pacific was stronger than normal and shifted a little to the west, and the Icelandic Low over the North Atlantic was a little stronger than normal. These atmospheric pressure centers of action serve to both generate or intensify low pressure storm systems as well as reflect the migratory path of low pressure systems. Changes in these centers of action, especially the Aleutian Low, can affect downstream weather systems. During February 2017, the upper-level circulation field consisted of below-normal heights, or enhanced troughing, over the northeastern North Pacific and Pacific Northwest which funneled low pressure systems into the CONUS, resulting in below-average sea level pressure across the CONUS. The February 2017 monthly EP-NP index and 3-month running mean were both slightly positive.
- Teleconnections (influence on weather): To the extent teleconnections are known, a positive EP-NP index during February (April on the quarterly teleconnection maps) is typically associated with cooler-than-normal temperatures across the CONUS from the Great Plains to East Coast; warmer-than-normal temperatures along the West Coast and over western Alaska; above-normal upper-level circulation anomalies (stronger upper-level ridge) over Alaska, western Canada, and the western CONUS; and below-normal upper-level circulation anomalies across eastern North America (stronger upper-level trough) and over the central North Pacific. The precipitation teleconnections are weak but suggest wetter-than-normal conditions over Wyoming and the Ohio Valley.
- Comparison to Observed: The February 2017 temperature and upper-level circulation anomaly patterns are opposite those expected with a positive EP-NP over the CONUS. The precipitation anomaly pattern has few teleconnections to compare to, but disagrees in the Ohio Valley.
Examination of the available circulation indices and their teleconnection patterns, and comparison to observed February 2017 temperature, precipitation, and circulation anomaly patterns, suggest that the weather over the CONUS in February was traced mostly to atmospheric drivers originating in the mid-latitudes, specifically the TNH. As noted by the Climate Prediction Center, "The TNH pattern reflects large-scale changes in both the location and eastward extent of the Pacific jet stream, and also in the strength and position of the climatological mean Hudson Bay Low." These changes were reflected quite well in the sea level pressure anomalies, upper-level circulation anomalies, and temperature anomalies. There was good agreement between the observed temperature anomaly pattern and the teleconnections for the MJO, AO, and NAO, which might suggest that their drivers also had some influence on the month's weather, but the circulation patterns don't match, which suggests that the temperature agreement might be a coincidence. The precipitation teleconnections for all of the circulation indices were either weak or not strongly correlated with the observed precipitation anomaly pattern, except for the WP. Again, since the circulation and temperature patterns don't show agreement with those expected for the WP, the precipitation match may be a coincidence. The PNA and ENSO were both neutral (zero), and the EP-NP teleconnections did not match the observed anomaly patterns, so those drivers did not appear to significantly affect February's weather over the CONUS.
This month illustrates how the weather and climate anomaly patterns can be influenced by atmospheric drivers (or modes of atmospheric variability) originating in the mid-latitudes. It also illustrates how competing drivers can make the relationships difficult to discern.