Note: This Synoptic Discussion describes recent weather events and climate anomalies in relation to the phenomena that cause the weather. These phenomena include the jet stream, fronts and low pressure systems that bring precipitation, high pressure systems that bring dry weather, and the mechanisms which control these features — such as El Niño, La Niña, and other oceanic and atmospheric drivers (PNA, NAO, AO, and others). The report may contain more technical language than other components of the State of the Climate series.
Summary
The Earth's ocean-atmosphere system was in an ENSO-neutral state during April 2017. The weather over the contiguous United States (CONUS) this month was dominated by a highly variable jet stream circulation which sent many closed lows, fronts and low pressure systems across the country. The weather systems dropped above-normal precipitation across much of the country, especially in the West, Plains, Midwest, and parts of the Southeast, which significantly reduced areas of drought and abnormal dryness. They also triggered bouts of severe weather. Upper-level ridging during the middle of the month, and a stronger than normal Bermuda High off the East Coast, helped keep temperatures warmer than normal in many areas, especially east of the Mississippi River. The upper-level circulation, temperature, and precipitation anomaly patterns suggested the atmospheric drivers originating in the mid-latitudes had the greatest influence on the month's weather. See below for details.
Synoptic Discussion
 Animation of daily upper-level circulation for the month.
|
 Animation of daily surface fronts and pressure systems for the month.
|
In the Northern Hemisphere, April marks the middle of climatological spring which is the time of year when solar heating increases with the rising sun angle, arctic air masses are not as cold, and a contracting circumpolar vortex forces the jet stream northward. Polar air masses influence the weather over the contiguous U.S. (CONUS) less, and the warm, dry subtropical high pressure belts influence the weather more.
April 2017, however, did not follow the usual climatological script. A highly variable upper-level circulation sent many troughs and slow-moving closed lows across the CONUS which left bouts of cooler weather, heavy precipitation, and severe storms in their wake, especially at the beginning and end of the month.
- Above-normal precipitation in the Pacific Northwest gave three states the tenth wettest, or wetter, April in the 1895-2017 record. The slow-moving nature of the closed lows and their southerly flow funneled Gulf of Mexico moisture into the southern Plains to Ohio Valley, and parts of the Southeast, with heavy rains causing extensive flooding along the Mid-Mississippi Valley. Six states from Oklahoma to Michigan had an April rank of tenth wettest, or wetter, with North Carolina having the wettest April on record. This overall circulation pattern and its widespread above-normal precipitation gave the CONUS the second wettest April on record.
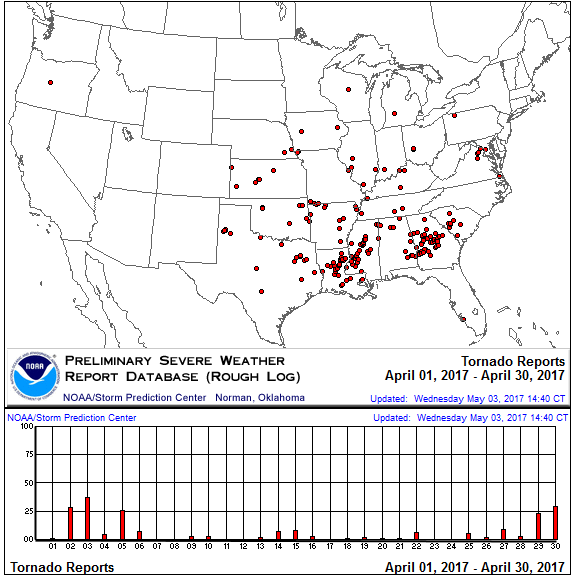
- Cold fronts and low pressure systems combined with the upper-level lows to create unstable air and dynamics favorable for severe weather. Based on preliminary data, there were 211 tornadoes in April 2017, which is more than the April average of 155. Most occurred in the southern and central Plains to Southeast where Gulf of Mexico moisture was drawn in to the powerful upper-level troughs and surface fronts and low pressure systems.
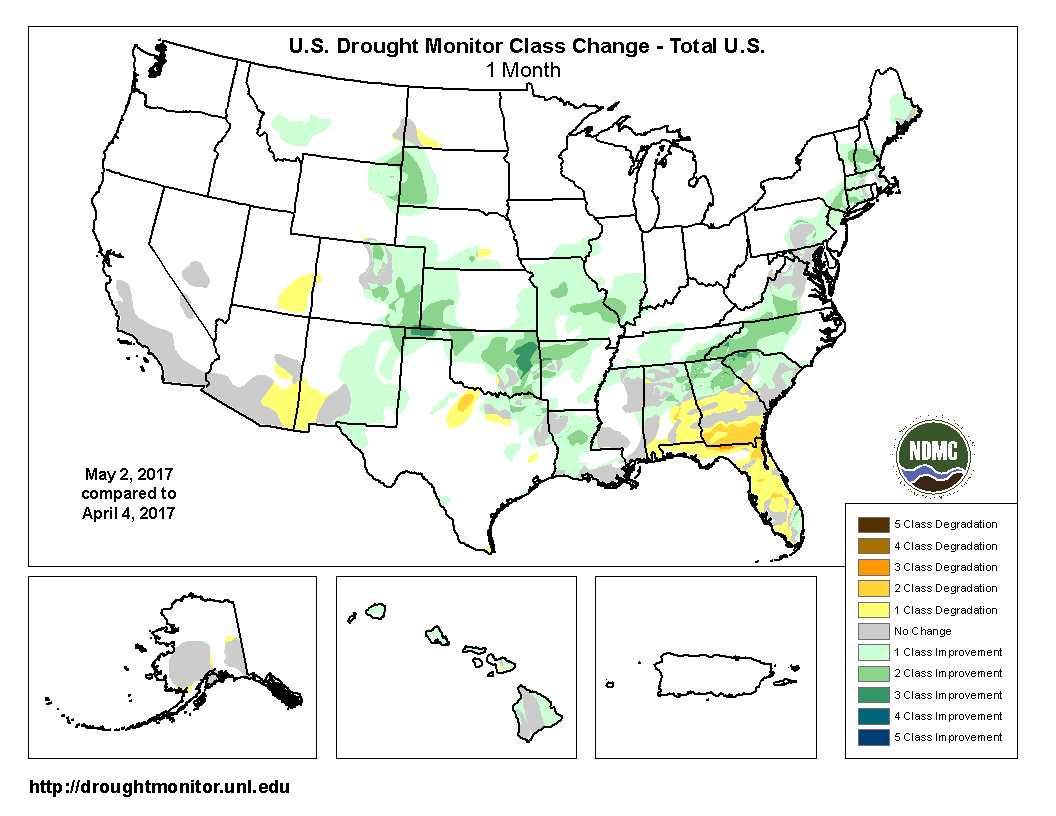
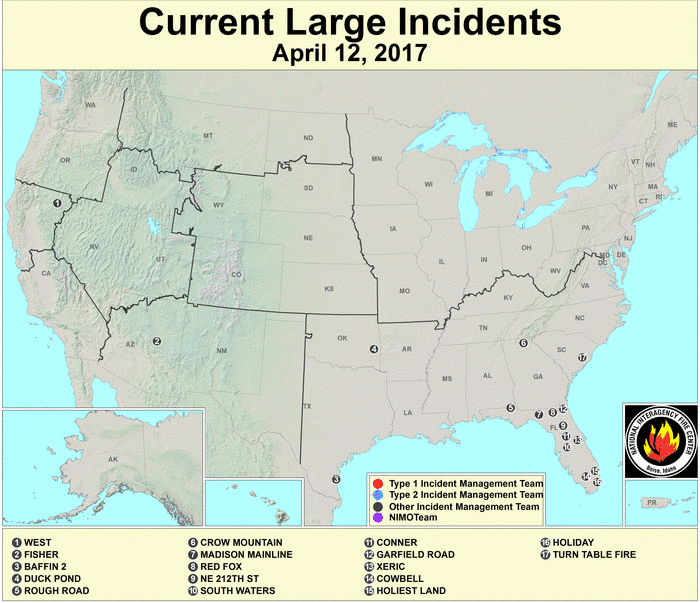
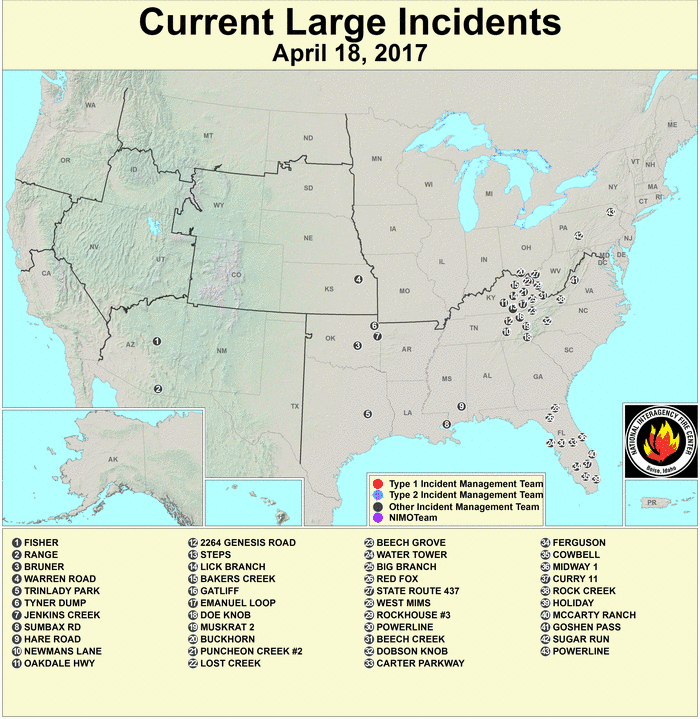
- The above-normal precipitation helped shrink drought areas from the Central Rockies to Plains and from the southern Appalachians to New England. As a result, the national moderate-to-exceptional drought footprint fell from 9.8 percent of the CONUS at the end of March (April 4th) to 5.0 percent at the end of April (from 8.3 percent to 4.2 percent for all of the U.S.). Unfortunately, the rain-producing systems mostly missed parts of the Southwest, northern Plains, and Southeast, where drought and abnormal dryness expanded. The drought was especially severe in southern Georgia and Florida, where numerous large wildfires burned throughout the month (wildfire maps for April 12, 18, 20, 24, 27, 30).
- The CONUS was not affected by any tropical cyclones during April 2017. This is not surprising, since the Atlantic hurricane season runs from June 1st through November 30th. It was surprising that a tropical storm (Tropical Storm Arlene) developed during the month in the Atlantic; however, it was short-lived, lasting only from April 19-21 and staying well out to sea. The Eastern North Pacific hurricane season runs from May 15th through November 30th, and no tropical storms or hurricanes developed in April. Two tropical systems developed in the western Tropical Pacific: a tropical depression (02W) which never intensified to tropical storm status, and Tropical Storm Muifa, both of which brought rain to parts of the U.S.-Affiliated Pacific Islands in western Micronesia.
Even though deep closed lows affected the southern states at the beginning and end of the month, the upper-level circulation was dominated by ridging during the middle of the month. The ridging drew warmer-than-normal air far to the north (temperature anomaly maps for weeks 1, 2, 3, 4). Averaged over the month, this upper-level ridging combined with a stronger than normal Bermuda High off the East Coast to give much of the CONUS, especially east of the Mississippi River, a warmer than normal April. Eight states, from the Ohio Valley to mid-Atlantic coast, had the warmest April in the 1895-2017 record, with the CONUS ranking eleventh warmest. Cooler-than-normal monthly temperatures in the northwestern CONUS were associated with persistent troughing and below-normal heights in the upper-level circulation across the North Pacific and into the Pacific Northwest.
- Some of the potent cold fronts brought much cooler-than-normal air behind them (temperature anomaly map for week 4). That, and cloudiness and rain associated with the closed lows, kept daily temperatures low, while the clear skies and southerly flow associated with the upper-level ridging brought warm daily temperatures. When integrated across the month, there were 3,126 record warm daily high (989) and low (2,137) temperature records. This was over three times the 962 record cold daily high (749) and low (213) temperature records.
- The REDTI (Residential Energy Demand Temperature Index) for April 2017 ranked lowest in the 123-year record for the month. This was due to above-normal temperatures across much of the CONUS which reduced heating demand in the high population centers.
- Some of the upper-level lows and their associated cold fronts had air that was cold enough for snow to form. The month began with about 15 percent of the CONUS snow-covered, thanks to a large low pressure trough in the jet stream flow. Upper-level ridging brought warmer temperatures which inhibited snow formation and melted existing snow cover, with snow coverage decreasing to a minimum of about 5.6 percent on the 17th. Another upper-level low near the end of the month brought colder temperatures and new snow, with the CONUS snow cover ending the month at about 14 percent.
The occurrence of slow-moving deep closed lows results in extremes of precipitation and temperature, while persistent ridging in the upper atmosphere frequently causes warm temperature extremes. The Climate Extremes Index (CEI) aggregates temperature and precipitation extremes across space and time. The temperature and precipitation extremes that occurred during the month, especially in the eastern CONUS, gave several regions a top ten integrated regional CEI for April 2017. The Northeast region had the most extreme warm minimum and fifth most extreme warm maximum temperature components, and most extreme 1-day precipitation component, which contributed to the most extreme regional CEI in the 1910-2017 April record. The Southeast region had the second most extreme warm maximum and fifth most extreme warm minimum temperature components, second most extreme 1-day precipitation component, and tenth most extreme long-term drought component, contributing to the second most extreme regional CEI. The Central region had the most extreme warm minimum and tenth most extreme warm maximum temperature components, and eighth most extreme 1-day precipitation component, contributing to the ninth most extreme regional CEI. When aggregated across the nation, April 2017 had the second most extreme 1-day precipitation component, seventh most extreme days with precipitation component, and tenth most extreme warm minimum temperature component. But this combination was not enough to push the national CEI rank into the top ten category — the CONUS had only the 20th most extreme national April CEI in the 108-year record.
 North America monthly upper-level circulation pattern and anomalies. The upper-level circulation pattern, averaged for the month, consisted of below-normal upper-level (500-mb) height anomalies over the northwestern CONUS, resulting from troughs frequently moving across the area, and above-normal height anomalies over the southwest and eastern CONUS. |
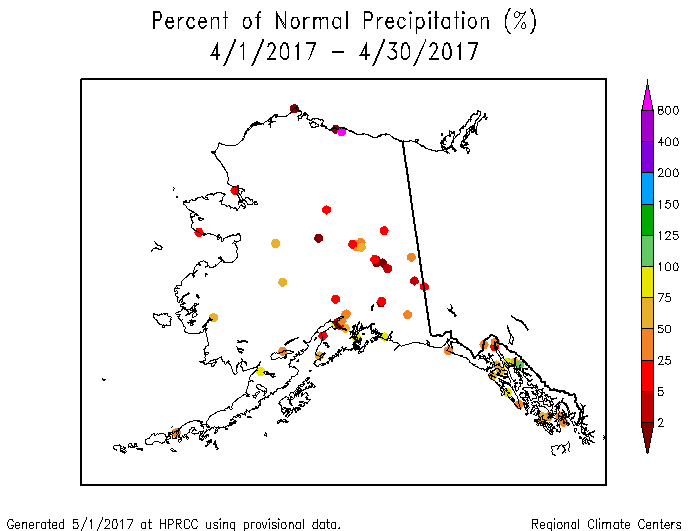
 Map of monthly precipitation anomalies. April 2017 was wetter than normal across much of the West, central to southern Plains, Mississippi Valley, Northeast, and Mid-Atlantic region; most of Puerto Rico; and parts of Hawaii. Drier-than-normal weather occurred across parts of the Southwest, northern Plains, and Southeast; parts of Hawaii; and most of Alaska. |
 Map of monthly temperature anomalies. April 2017 was warmer than normal in most of Alaska and across the CONUS along and east of the Mississippi River, cooler than normal to near normal in the Pacific Northwest to Great Basin, and near to warmer than normal in the Plains to Southwest. |
 Northern Hemisphere monthly upper-level circulation pattern and anomalies. Global Linkages: The upper-level (500-mb) circulation anomaly pattern over North America was part of a complex long-wave pattern that stretched across the Northern Hemisphere. The usual east-west trough/ridge pairs (or couplets) and anomaly couplets were mostly absent this month. Instead, a band of negative 500-mb height anomalies could be seen across the Pacific and positive anomalies stretched across the Atlantic. Also, north-south anomaly couplets were more evident than east-west couplets. The above-normal 500-mb heights were associated with upper-level ridging at the mid-latitudes, below-normal precipitation (in western Europe), below-normal snow cover (over northern China), and above-normal surface temperatures over the eastern CONUS and southwestern Europe, and in parts of the North Atlantic and North Pacific. The areas of below-normal 500-mb heights were associated with upper-level troughing; near- to below-normal surface temperatures over the northern Europe and parts of the North Pacific and North Atlantic; above-normal precipitation over western North America and north central Asia; and above-normal snow cover over northwestern Russia. With large parts of the continents having warmer-than-normal temperatures, and large portions of the Atlantic and Pacific Oceans having warmer-than-normal sea surface temperatures, the April 2017 global temperature was above normal. |
Atmospheric Drivers
Subtropical highs, and fronts and low pressure systems moving in the mid-latitude storm track flow, are influenced by the broadscale atmospheric circulation. The circulation of the atmosphere can be analyzed and categorized into specific patterns. The Tropics, especially the equatorial Pacific Ocean, provides abundant heat energy which largely drives the world's atmospheric and oceanic circulation. The following describes several of these modes or patterns of the atmospheric circulation, their drivers, the temperature and precipitation patterns (or teleconnections) associated with them, and their index values this month:
-
El Niño Southern Oscillation (ENSO)
- Description: Oceanic and atmospheric conditions in the tropical Pacific Ocean can influence weather across the globe. ENSO is characterized by two extreme modes: El Niño (warmer-than-normal sea surface temperature [SST] anomalies in the tropical Pacific) and La Niña (cooler-than-normal SST anomalies), with the absence of either of these modes termed "ENSO-neutral" conditions.
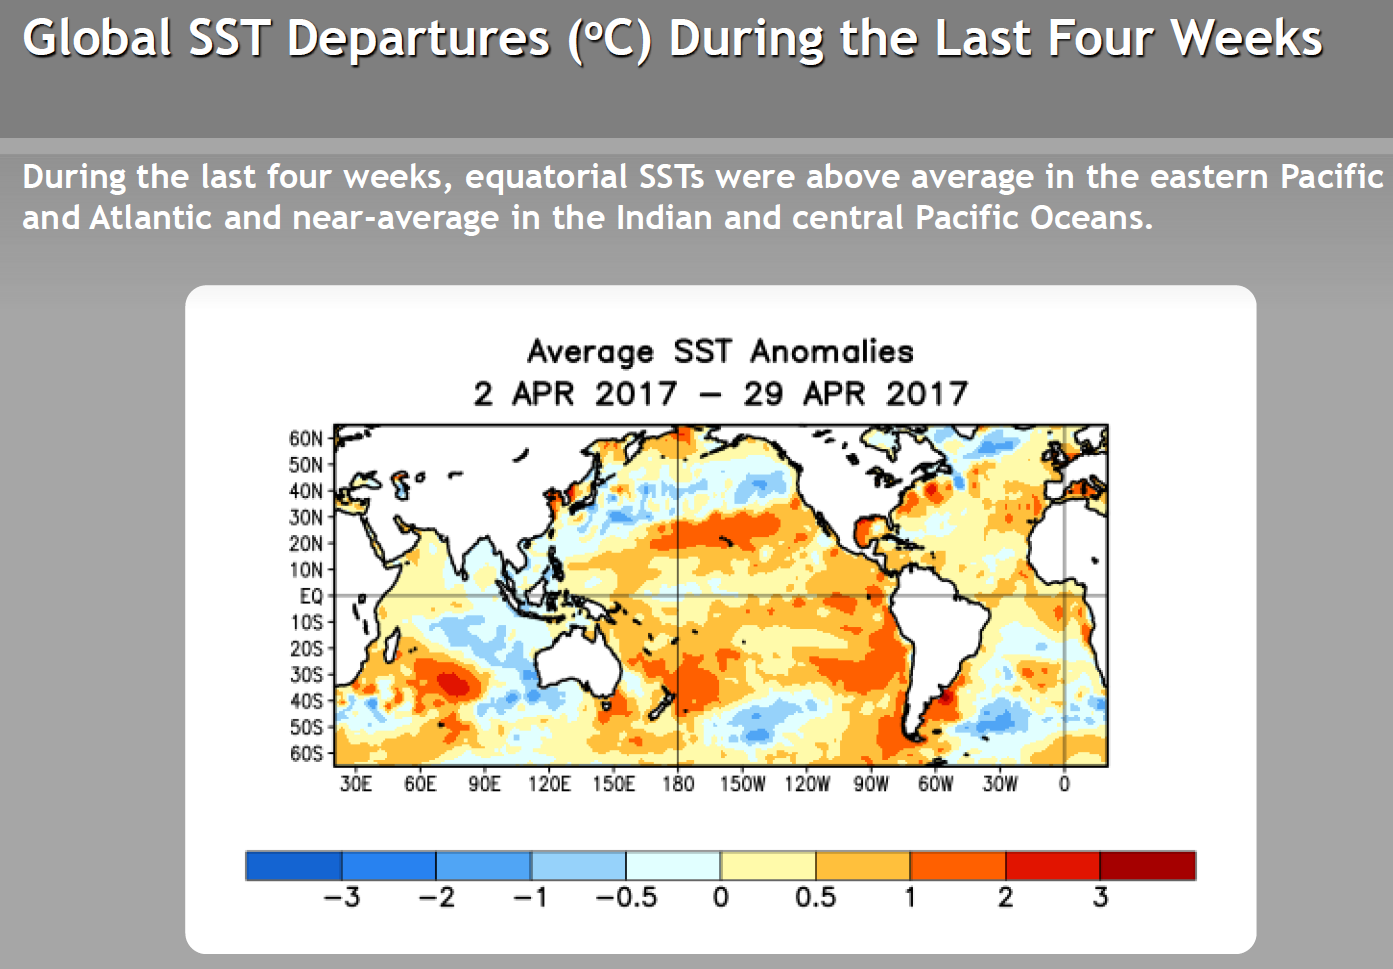
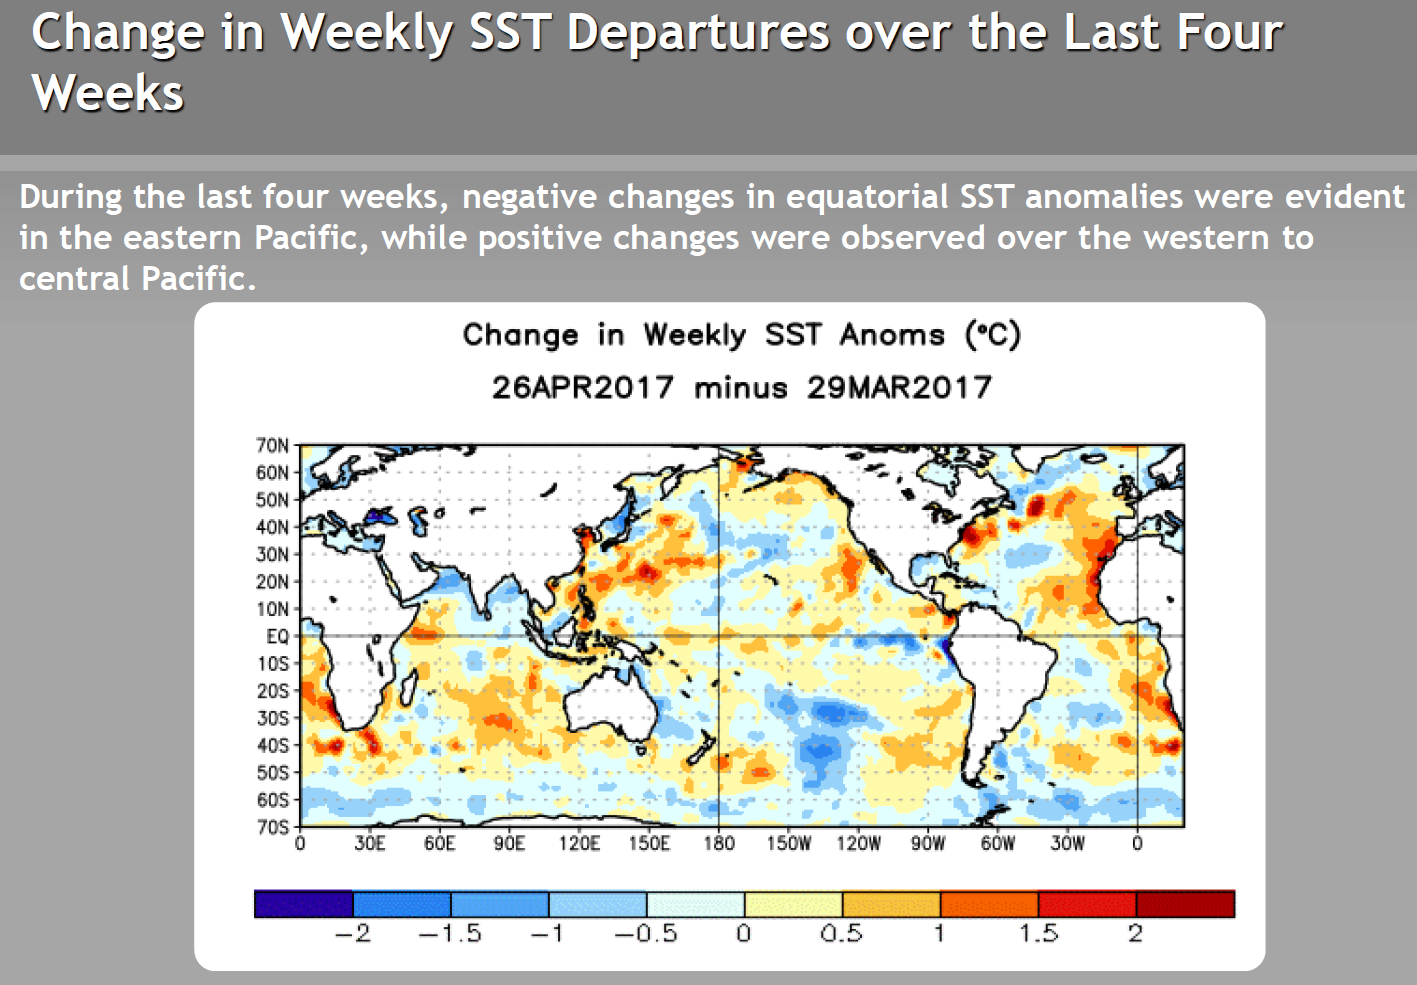
- Status: ENSO-neutral conditions were present during April 2017 with above-average SSTs in the eastern equatorial Pacific and near-average (but recently increasing) SSTs in the central equatorial Pacific .
- Teleconnections (influence on weather): The NWS CPC has no teleconnections for ENSO-neutral conditions.
-
Madden-Julian Oscillation (MJO)
- Description: The MJO is a tropical disturbance or "wave" that propagates eastward around the global tropics with a cycle on the order of 30-60 days. It is characterized by regions of enhanced and suppressed tropical rainfall. One of its indices is a phase diagram which illustrates the phase (1-8) and amplitude of the MJO on a daily basis. The MJO is categorized into eight "phases" depending on the pattern of the location and intensity of the regions of enhanced and suppressed tropical rainfall. The MJO can enter periods of little or no activity, when it becomes neutral or incoherent and has little influence on the weather. Overall, the MJO tends to be most active during ENSO-neutral years, and is often absent during moderate-to-strong El Niño and La Niña episodes.
- Status: The MJO Wheeler-Hendon index was incoherent (inside the unit circle) for most of the month, toying briefly with phase 8. Other aspects of the tropical ocean-atmosphere system (referred to in the CPC reports as the background or low frequency state, Kelvin and Rossby waves, and tropical cyclone activity) appeared to dominate (MJO updates for April 3, 10, 17, 24, and May 1).
- Teleconnections (influence on weather): The MJO's temperature and precipitation teleconnections to U.S. weather depend on time of year and MJO phase. But there are no teleconnections for an incoherent MJO.
- Comparison to Observed: The MJO is transitory and can change phases (modes) within a month, so it is more closely related to weekly weather patterns than monthly. In the case of April 2017, the MJO index was in phase 8 briefly for only a few days during the month, but it was mostly incoherent. The monthly temperature and precipitation anomaly patterns show little resemblance to the teleconnections associated with a phase 8 MJO, nor do the weekly temperature (weeks 1, 2, 3, 4) or precipitation (weeks 1, 2, 3, 4) anomaly patterns.
- The Pacific/North American (PNA) pattern
- Description: The PNA teleconnection pattern is associated with strong fluctuations in the strength and location of the East Asian jet stream. PNA-related blocking of the jet stream flow in the Pacific can affect weather downstream over North America, especially the West and especially in the winter half of the year.
- Status: The daily PNA index was positive to zero, averaging near zero (only slightly positive) for the month as a whole. The 3-month-averaged index was near zero.
- Teleconnections (influence on weather): No temperature, precipitation, or upper-level circulation teleconnections are provided for a neutral (zero) PNA.
- Comparison to Observed: Notwithstanding that, the April 2017 temperature, precipitation, and upper-level circulation anomaly patterns do not match those for a positive PNA.
- The Arctic Oscillation (AO) pattern
- Description: The AO teleconnection pattern relates upper-level circulation over the Arctic to circulation features over the Northern Hemisphere mid-latitudes and is most active during the cold season.
- Status: The daily AO index started the month positive, then gradually became negative, then went above zero briefly again near the end of the month, averaging near zero for the month. The 3-month-averaged index was positive.
- Teleconnections (influence on weather): To the extent teleconnections are known, a neutral AO in April (March-May in the AO Composites table) is typically associated with dry conditions in the central to southern Plains; wet conditions in the Southeast, and Great Lakes; below-normal temperatures in the Pacific Northwest and Montana; above-normal temperatures for a small area in the central Appalachians; and no upper-level circulation anomalies over North America.
- Comparison to Observed: The April 2017 monthly temperature anomaly pattern agrees with the teleconnections associated with a neutral AO in the Pacific Northwest but not elsewhere. The precipitation and upper-level circulation anomaly patterns do not agree.
- The North Atlantic Oscillation (NAO) pattern
- Description: The NAO teleconnection pattern relates upper-level circulation over the North Atlantic Ocean to circulation features over the Northern Hemisphere mid-latitudes.
- Status: The daily NAO index was positive for most of the month, averaging positive for the month. The 3-month-averaged index was also positive.
- Teleconnections (influence on weather): To the extent teleconnections are known, a positive NAO during this time of year (April on the quarterly teleconnection maps) is associated with above-normal upper-level circulation anomalies over all of the CONUS except the Southeast Coast; below-normal circulation anomalies over northern Canada to Greenland and Iceland; above-normal temperature anomalies across most of the CONUS except Texas and the Southeast; and drier-than-normal precipitation anomalies in the Southeast, central Plains, and northern California.
- Comparison to Observed: The April 2017 upper-level circulation anomaly pattern agrees over the eastern CONUS but not in the West. The temperature anomaly pattern has some agreement (central CONUS), but disagrees along the east and west coasts. The precipitation anomaly pattern disagrees with the existing teleconnections.
- The West Pacific (WP) pattern
- Description: The WP teleconnection pattern is a primary mode of low-frequency variability over the North Pacific and reflects zonal and meridional variations in the location and intensity of the (East Asian) jet stream in the western Pacific.
- Status: The monthly WP index was slightly negative, while the three-month average WP index was very negative.
- Teleconnections (influence on weather): To the extent teleconnections are known, a negative WP during this time of year (April on the quarterly teleconnection maps) is typically associated with below-normal temperatures from the Canadian Prairies to the Ohio Valley; above-normal temperatures over the southwestern CONUS; above-normal circulation anomalies over the southwestern CONUS and northeast Asia; and below-normal circulation anomalies over parts of the Pacific. Few precipitation teleconnections exist, but above-normal precipitation occurs over parts of the Pacific Northwest.
- Comparison to Observed: The April 2017 monthly upper-level circulation anomaly pattern shows good agreement over the western CONUS, northeast Asia, and Pacific Ocean, although the patterns are slightly shifted. The precipitation anomaly pattern agrees in Washington state, but there are no other teleconnections. The temperature anomaly pattern shows agrees in the southwest CONUS, but not elsewhere.
- The East Pacific-North Pacific (EP-NP) pattern
- Description: The EP-NP teleconnection pattern relates SST and upper-level circulation patterns (geopotential height anomalies) over the eastern and northern Pacific to temperature, precipitation, and circulation anomalies downstream over North America. Its influence during the winter is not as strong as during the other three seasons.
- Status: Compared to the previous month, the April North Pacific SSTs warmed along the North American coast and across much of the Pacific west of the International Dateline, and cooled along and near the Dateline, with the net result being a continuation of an SST anomaly pattern consisting of cooler-than-normal SST anomalies between 30 and 50 degrees North latitude that stretched from near Japan to the North American coast, and warmer-than-normal SSTs north and south of this cool area. The SST anomalies next to the North American coast were cooler than normal in the north and warmer than normal in the south. The average sea level pressure field and its anomaly field for April suggest that the Aleutian Low over the North Pacific was stronger and a little further south than normal, and the Icelandic Low over the North Atlantic was a little weaker than normal. These atmospheric pressure centers of action serve to both generate or intensify low pressure storm systems as well as reflect the migratory path of low pressure systems. The North Pacific High was weaker than normal while the North Atlantic High (Bermuda High) was shifted west closer to the CONUS. Changes in these centers of action, especially the Aleutian Low, can affect downstream weather systems. During April 2017, the upper-level circulation field consisted of below-normal heights, or enhanced troughing, over the northeastern North Pacific and Pacific Northwest and above-normal heights, or enhanced ridging, over the eastern CONUS. The April 2017 monthly EP-NP index was positive while the 3-month running mean was near zero.
- Teleconnections (influence on weather): To the extent teleconnections are known, a positive EP-NP index this time of year (April on the quarterly teleconnection maps) is typically associated with cooler-than-normal temperatures across the CONUS from the Great Plains to East Coast; warmer-than-normal temperatures along the West Coast and over western Alaska; above-normal upper-level circulation anomalies (stronger upper-level ridge) over Alaska, western Canada, and the western CONUS; and below-normal upper-level circulation anomalies across eastern North America (stronger upper-level trough) and over the central North Pacific. The precipitation teleconnections are weak but suggest wetter-than-normal conditions over Wyoming and the Ohio Valley.
- Comparison to Observed: The April 2017 upper-level circulation anomaly pattern agrees with the teleconnections associated with a positive EP-NP in most areas except the western CONUS. The temperature anomaly pattern does not agree. The precipitation anomaly pattern generally agrees where the few teleconnections exist.
Examination of the available circulation indices and their teleconnection patterns, and comparison to observed April 2017 temperature, precipitation, and circulation anomaly patterns, suggest that the weather over the CONUS in April was traced mostly to atmospheric drivers originating in the mid-latitudes, specifically the North Pacific and North Atlantic Oceans. But none of the indices were a perfect match. The tropical Pacific was in an ENSO-neutral state and the MJO was mostly incoherent. The PNA and AO teleconnections did not match the observed anomaly patterns. There were areas of agreement between the observed circulation anomaly pattern and the teleconnections for the NAO, WP, and EP-NP. None of them matched perfectly by themselves, but taken together they agreed across most of North America and the North Pacific. The observed temperature anomaly pattern might be a good match for the NAO teleconnection if it were shifted laterally a bit. The movement of large closed lows in the upper-level circulation, and the cooler-than-normal temperatures associated with their cloudiness and precipitation, could affect the monthly temperature anomaly pattern to disrupt a teleconnection match. The precipitation teleconnections for all of the circulation indices were either weak or not strongly correlated with the observed precipitation anomaly pattern.
This month illustrates how the weather and climate anomaly patterns can be influenced by atmospheric drivers (or modes of atmospheric variability) originating in the mid-latitudes. It also illustrates how high amplitude circulation anomalies (slow-moving closed lows) can add a random element which disrupts the influence of the main atmospheric drivers.