Note: This Synoptic Discussion describes recent weather events and climate anomalies in relation to the phenomena that cause the weather. These phenomena include the jet stream, fronts and low pressure systems that bring precipitation, high pressure systems that bring dry weather, and the mechanisms which control these features — such as El Niño, La Niña, and other oceanic and atmospheric drivers (PNA, NAO, AO, and others). The report may contain more technical language than other components of the State of the Climate series.
Summary
The atmosphere was in an ENSO-neutral state during October 2016, but trending toward La Niña. Like the previous two months, the weather over the contiguous United States (CONUS) this month was dominated by a complex interplay between subtropical high pressure systems, jet stream weather systems, and tropical cyclone rainfall. Troughs and lows in the jet stream flow funneled cold fronts and surface lows into the western U.S., giving parts of the West a colder-than-normal month, while the Bermuda (North Atlantic) High and upper-level ridges kept much of the rest of the U.S. warmer than normal. The fronts and lows brought above-normal precipitation to the Far West, Pacific Northwest, Northern Rockies, and parts of the Great Lakes, while Hurricane Matthew drenched parts of the East Coast, but the Bermuda High and jet stream ridges kept much of the rest of the country drier than normal. The fronts and upper-level troughs provided the dynamics that triggered severe weather, but, again, the Bermuda High and upper-level ridging helped keep the number of tornadoes below average for the month. Drought expanded in the South, Central Rockies to adjacent Plains, and parts of the Northeast, and contracted in the Northwest and parts of the Northeast, with the overall national drought footprint expanding to about 26.8 percent of the CONUS. The upper-level circulation, temperature, and precipitation anomaly patterns suggested the atmospheric drivers originating in the Pacific and North Atlantic had the greatest influence on the month's weather. See below for details.
Synoptic Discussion
 Animation of daily upper-level circulation for the month.
|
 Animation of daily surface fronts and pressure systems for the month.
|
In the Northern Hemisphere, October is in the middle of climatological fall (autumn) which is the time of year when solar heating decreases as the sun angle decreases, and an expanding circumpolar vortex forces the jet stream to migrate southward. Polar air masses begin to influence the weather over the contiguous U.S. (CONUS) more, and the warm, dry subtropical high pressure belts influence the weather less.
The mid-latitude circulation was very active during October 2016, with numerous troughs and ridges moving in the jet stream flow. But the storm track stayed mostly along the U.S.-Canadian border, with the Bermuda High largely dominating the weather across the southern CONUS. Deep troughs and cutoff lows occasionally plunged southward, dragging cooler Canadian air behind cold fronts, but they quickly migrated to the east. The one exception was over the Pacific Northwest and adjacent Pacific Ocean, where troughs tended to settle for several days at a time. These troughs funneled Pacific weather systems and moisture into the Pacific Northwest, central to northern California, and the Northern Rockies, giving the region a wetter-than-normal month. The fronts and surface lows dried out as they crossed the Rockies. This drying effect, plus the frequent occurrence of ridges in the upper-level flow, resulted in a drier-than-normal month across much of the Plains. The fronts and lows were rejuvenated as they crossed over the Great Lakes, where near- to above-normal precipitation fell. Rains from Hurricane Matthew inundated parts of the coastal Southeast, but descending air from the North Atlantic High and ridges in the jet stream flow kept precipitation below normal across the Southwest to much of the Southeast. The subtropical highs and jet stream ridges also kept temperatures above normal across most of the CONUS, in spite of the occasional cold air outbreak, and inhibited the development of severe weather.
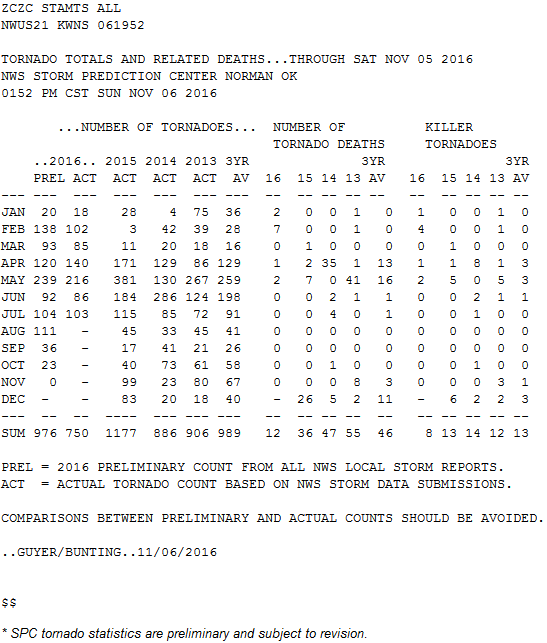
The combination of lifting along the frontal boundaries and dynamical support from the transient upper-level troughs and lows triggered severe weather, mostly east of the Rockies, but the overall dominance of the Bermuda High and frequent upper-level ridges in the jet stream flow kept the tornado count below average. According to preliminary data, 23 tornadoes occurred during October 2016, which is less than half of the October average of 61. Most occurred in the Central Plains in association with fronts and low pressure systems along the storm track.
Normally, on the southern side of the North Pacific and North Atlantic Highs, the winds blow out of the east to northeast and toward the equator to produce the northeasterly Trade Winds. The Trade Winds steer tropical weather systems that are close to the equator, thus making the subtropical highs important drivers of tropical cyclone motion. As tropical cyclones migrate slowly north, they can get caught up in the southerly flow along the west end of the subtropical highs. ENSO conditions along the equatorial Pacific Ocean (El Niño or La Niña) can influence the development of tropical cyclones in both the Pacific and Atlantic. The tropical Pacific continued in an ENSO-neutral state during October, so it's influence on tropical cyclones was muted this month.
Two named tropical cyclones (Hurricanes Matthew and Nicole) were active in the Atlantic Basin in October. Matthew, which formed in September, dropped heavy rain in Haiti, Cuba, and the Bahamas before it grazed the Florida to Carolina coasts. Matthew then got caught up in a jet stream trough and was rapidly pulled northeast then out to sea. Hurricane Nicole was steered north on the western edge of the North Atlantic High into Bermuda, then was directed out to sea by another jet stream trough before it could affect the CONUS.
In the central and eastern equatorial Pacific Basin, one named tropical cyclone (Hurricane Seymour) formed in October, off the Mexican coast. Seymour was steered west, away from Mexico, by the easterly Trade Winds until a trough in the jet stream pulled it north where its moisture was drawn into the southwestern CONUS.
The Intertropical Convergence Zone was active across the U.S.-Affiliated Pacific Islands in the western equatorial Pacific with many tropical disturbances developing in the monsoon trough. Several of the disturbances moved westward across Micronesia in the easterly trade winds and developed into named storms as they moved west of the Mariana Islands and into the Philippine Sea. These included Typhoons Chaba (which formed in September but was active in October), Songda, Sarika, and Haima, and Tropical Storm Aere. Songda stayed primarily north of Micronesia, while Haima developed while still over western Micronesia.
The Bermuda High and upper-level ridges allowed warmer tropical-type air masses to cover the CONUS more often than cooler polar air masses. As a result, October ended up with 7,025 record warm daily high (3,147) and low (3,878) temperature records. This was more than ten times the 508 record cold daily high (316) and low (192) temperature records that were associated with the air masses behind the cold fronts. Nationally, October 2016 ranked as the third warmest October in the 1895-2016 record. The last three Octobers are among the six warmest of the 122-year record. The REDTI (Residential Energy Demand Temperature Index) for October 2016 ranked ninth lowest in the 122-year record for October, due to much-warmer-than-normal temperatures across most of the country which decreased heating demand.
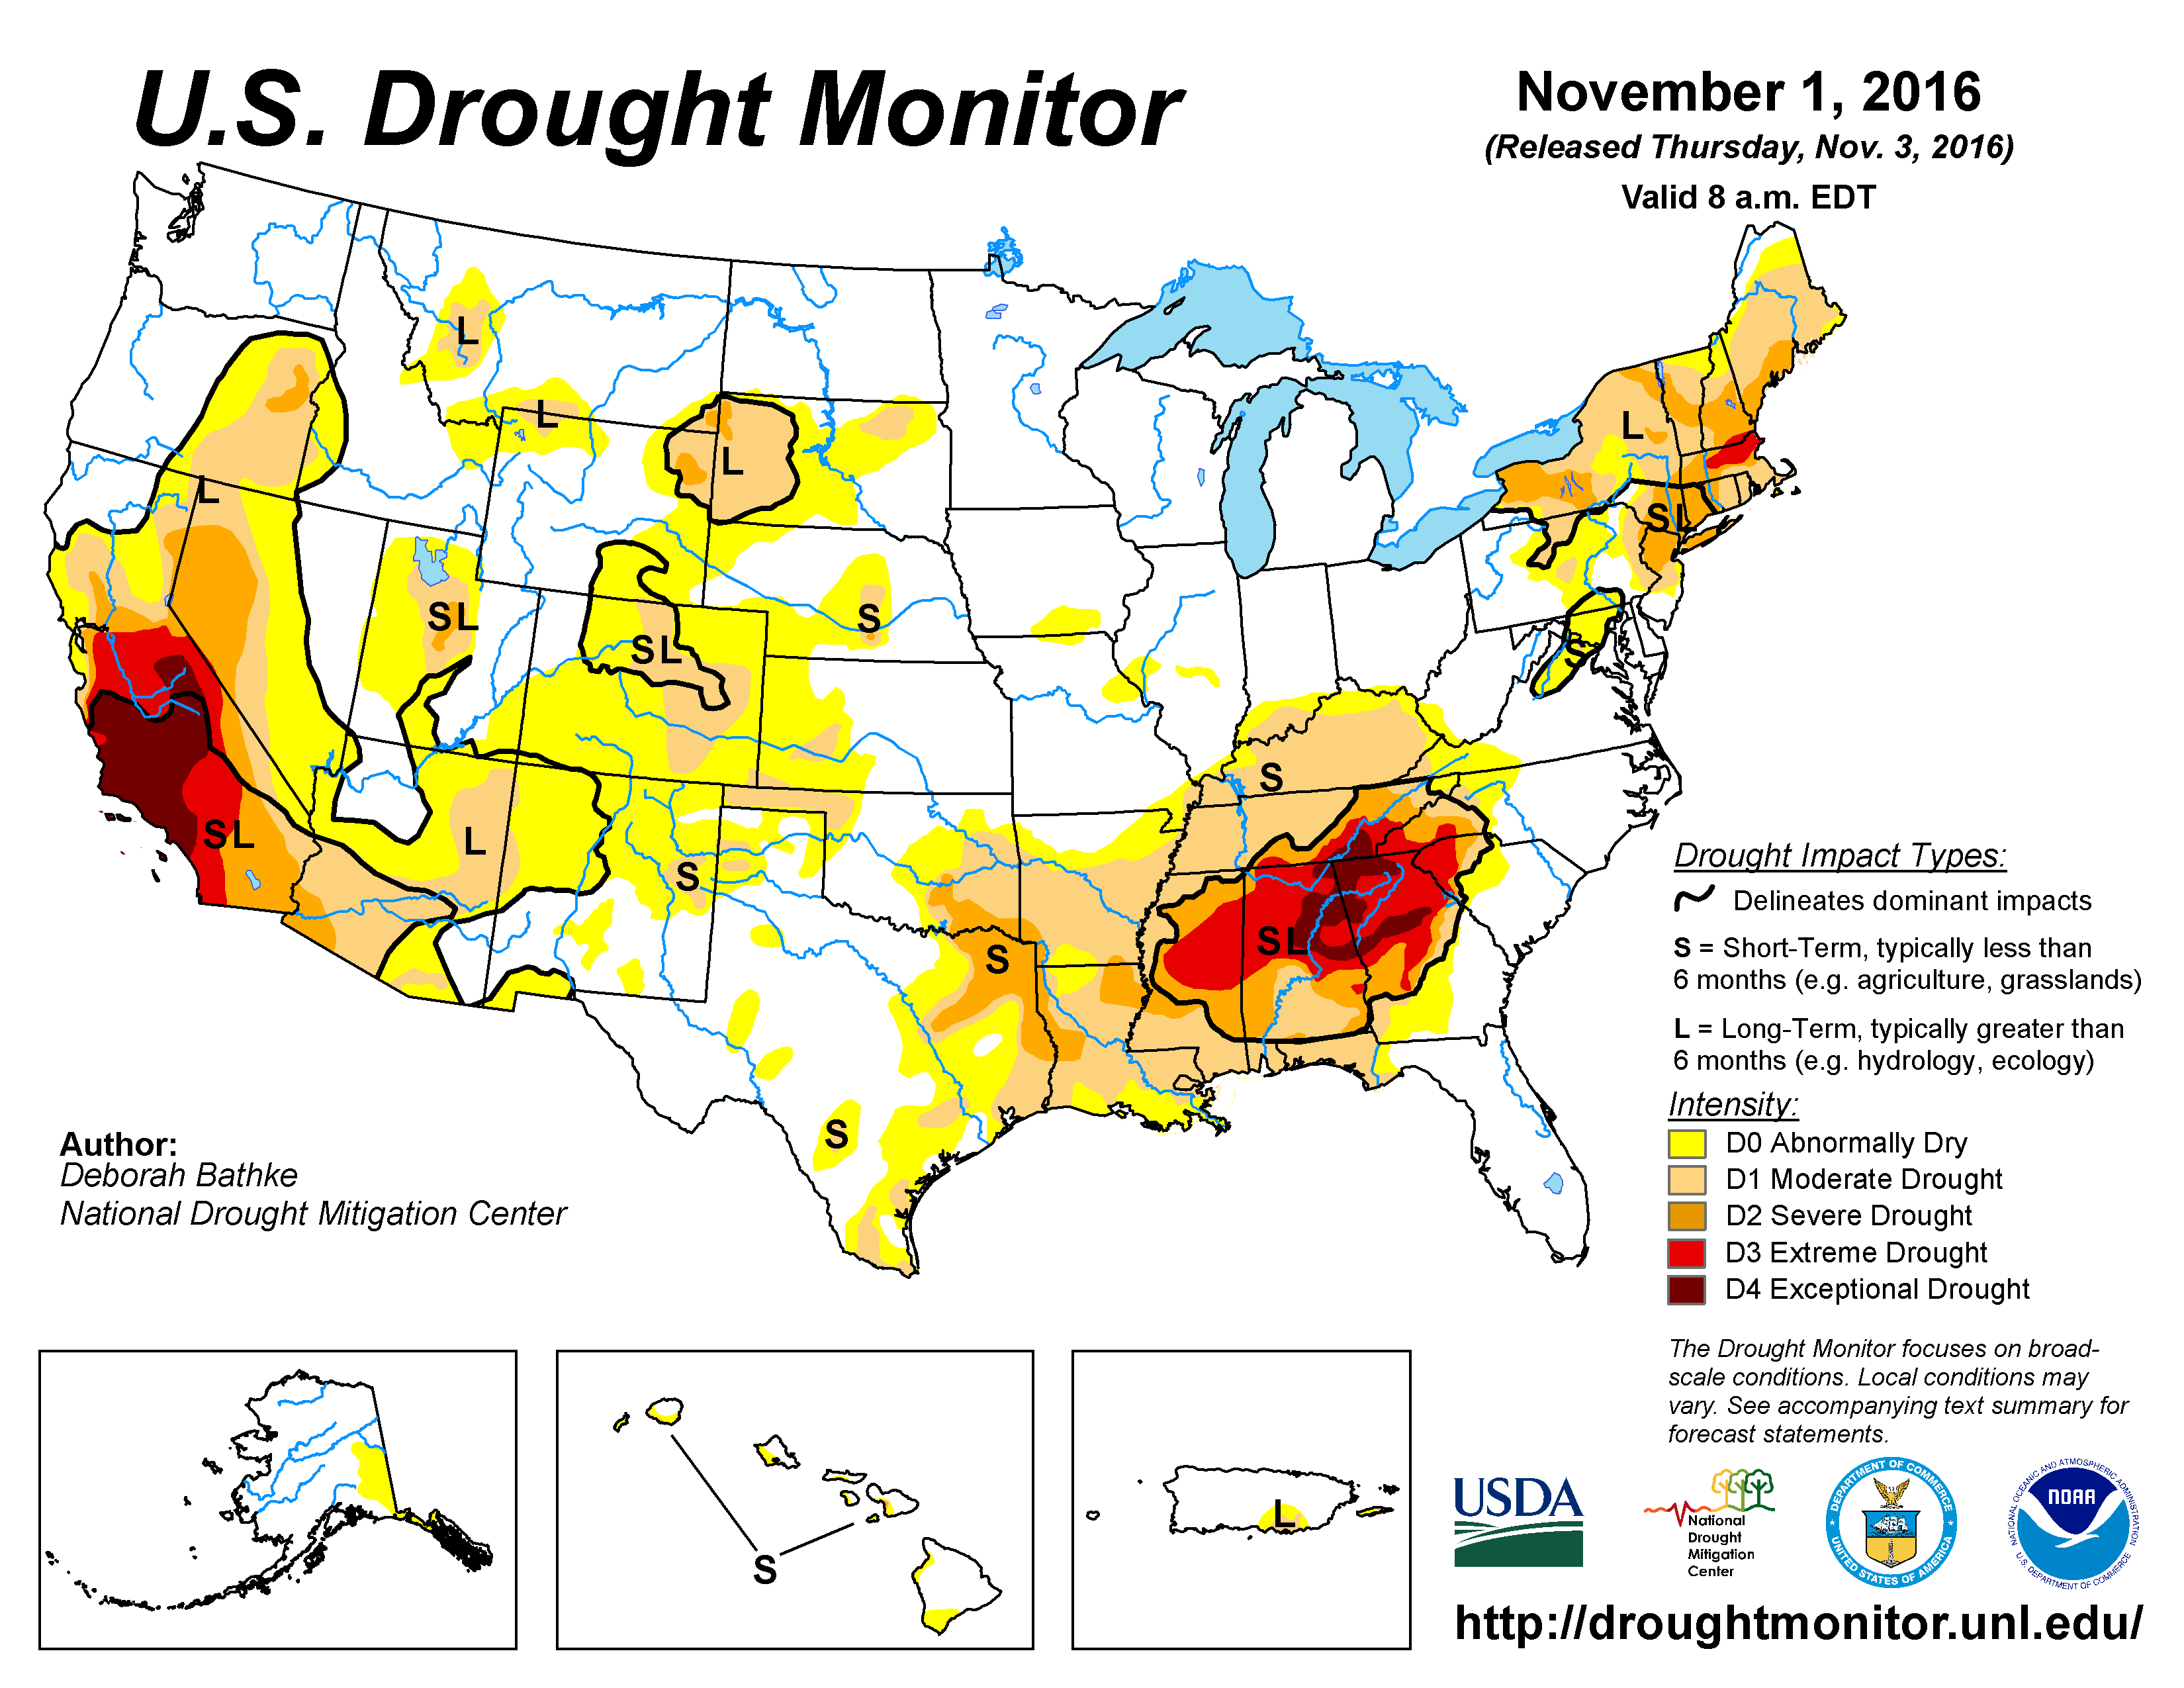
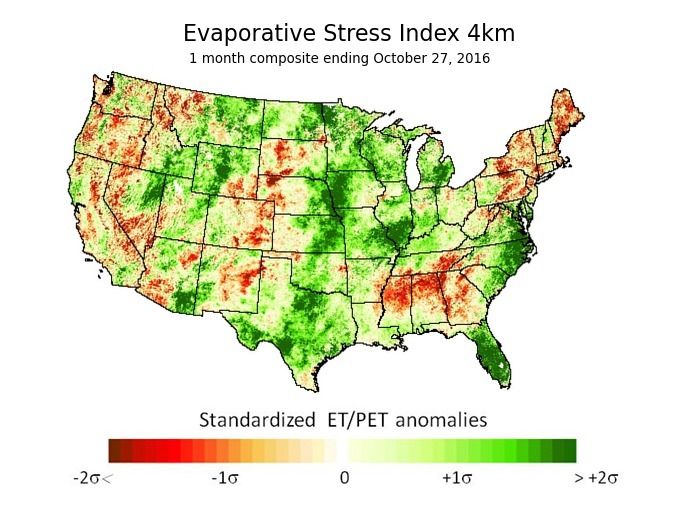
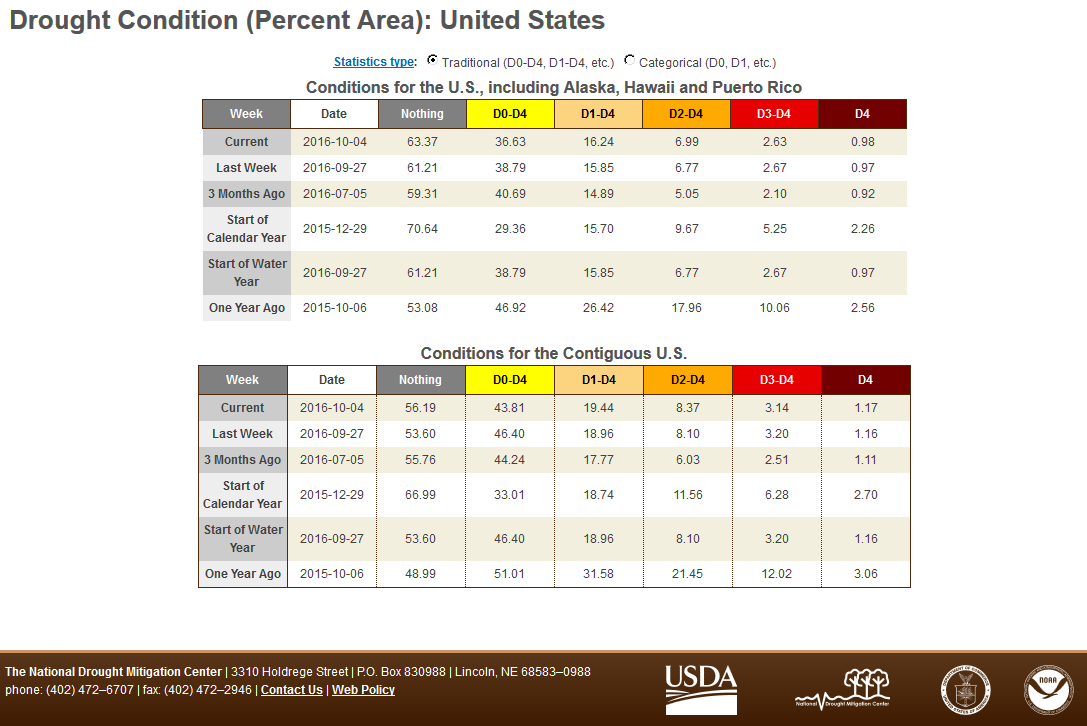
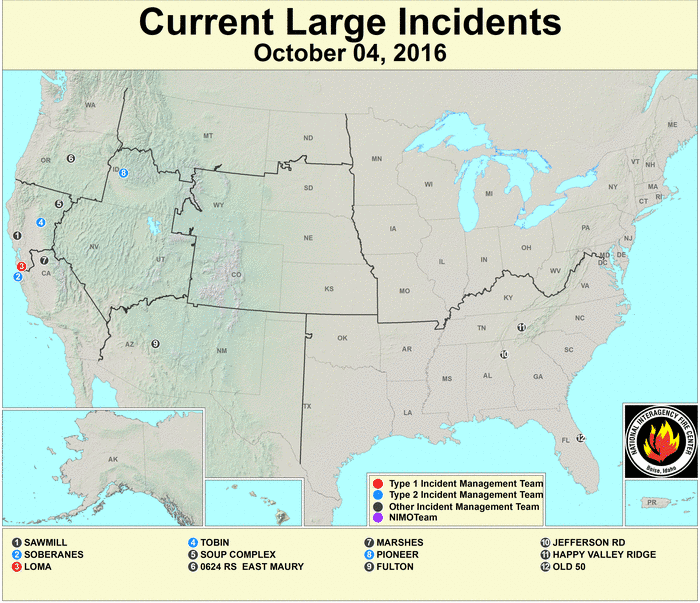
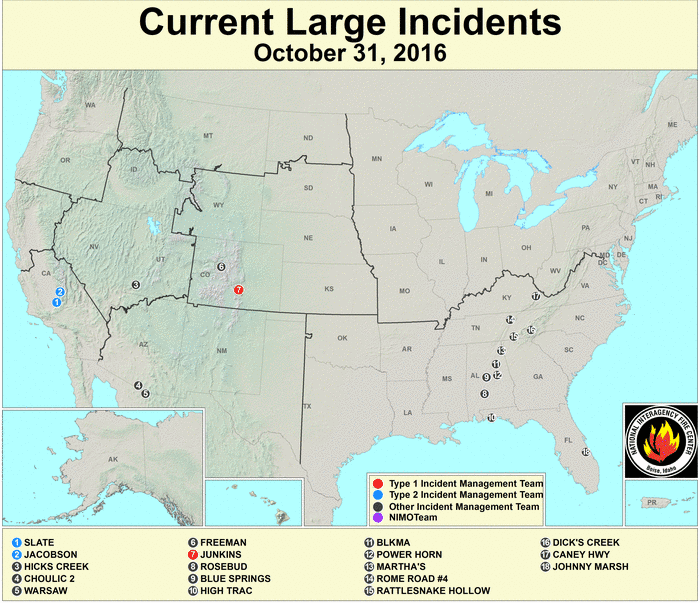
Above-normal precipitation from Pacific weather systems contracted drought in the Pacific Northwest, Northern California, and Northern Rockies. But the continued dry weather, coupled with abnormally high temperatures which enhanced evapotranspiration, expanded and intensified drought and abnormal dryness in the Central Rockies to adjacent Plains, parts of the Northeast, and especially in the Southern Plains to Southeast. The net effect was an increase in the national moderate-to-exceptional drought footprint from 19.4 percent at the end of September to 26.8 percent at the end of October (from 16.2 percent to 22.4 percent for all of the U.S.). The precipitation reduced the occurrence of wildfires in the West while the dryness in the Southeast set the stage for the development of several large wildfires in that region by the end of the month (wildfire maps for October 4, 24, 31).
The Climate Extremes Index (CEI) aggregates temperature and precipitation extremes across space and time. Temperature and precipitation extremes occurred during the month in many areas, but only two regions had a CEI that ranked in the top ten category, although several others were close (ranking in the top 20 category). The Northwest region had the tenth most extreme October CEI in the 1910-2016 record due to the most extreme days with precipitation component, tenth most extreme warm minimum and 18th most extreme cool maximum temperature components, and 22nd most extreme 1-day precipitation component. The Southwest region had the tenth most extreme October CEI in the 1910-2016 record due to the second most extreme warm minimum and fourth most extreme warm maximum temperature components. When aggregated across the nation, October 2016 had the second most extreme warm minimum and sixth most extreme warm maximum temperature components, and seventh most extreme days with precipitation component, resulting in the eighth most extreme October CEI in the 107-year record.
 North America monthly upper-level circulation pattern and anomalies. The upper-level circulation pattern, averaged for the month, consisted of below-normal upper-level (500-mb) height anomalies over the northwestern CONUS extending into the adjacent North Pacific, resulting from troughs frequently moving across the area and deepening. Above-normal heights dominated over Alaska and the southern and eastern CONUS and extending into eastern Canada. The combination of upper-level ridging, transient Canadian high pressure systems, and the North Atlantic High resulted in above-normal sea level pressure anomalies over the eastern CONUS. Of the circulation indices usually discussed on this page, the teleconnections aggregated for a negative EP-NP, positive WP, and positive NAO most closely match the October 2016 500-mb circulation anomalies. |
 Map of monthly precipitation anomalies. October was wetter than normal across most of the Far West, Pacific Northwest, and Northern Rockies; parts of the Coastal Southeast; and most of Puerto Rico. The month was near to wetter than normal across the Great Lakes. It was drier than normal across Alaska, parts of eastern Puerto Rico, most of Hawaii, and much of the CONUS from the Southwest to Southeast, Great Plains, and parts of the Northeast. |
 Map of monthly temperature anomalies. October temperatures averaged near to below normal in parts of the Far West and Northern Rockies, and interior southeast Alaska, and above normal for the rest of the CONUS and most of Alaska, with New Mexico having a record-warm October. |
 Northern Hemisphere monthly upper-level circulation pattern and anomalies. Global Linkages: The upper-level (500-mb) circulation anomaly pattern over North America was part of a complex long-wave pattern that stretched across the Northern Hemisphere. It was difficult to discern trough/ridge couplets. An east-west couplet could be seen over North America (trough or below-normal heights over the Pacific Northwest and adjacent North Pacific, ridge or above-normal heights over eastern North America). One might also conjecture that the below-normal heights over southern Siberia are coupled to the above-normal heights over northern Siberia/Arctic Ocean in a north-south couplet. But one could also link the anomalies over North America, Siberia, and the central and eastern North Pacific. A more-discernible three-wave anomaly couplet is evident in the Southern Hemisphere westerlies. The above-normal 500-mb heights were associated with upper-level ridging at the mid-latitudes, below-normal precipitation, below-normal snow cover (over Alaska and the CONUS), and above-normal surface temperatures over the continents and oceans. The areas of below-normal 500-mb heights were associated with upper-level troughing, near- to below-normal surface temperatures over the continents, a cooling trend in sea surface temperatures over the oceans, and above-normal precipitation and snow cover. With many of the continents having warmer-than-normal temperatures, and large portions of the Atlantic and Pacific Oceans having warmer-than-normal sea surface temperatures, the October 2016 global temperature was well above normal, but the cooler-than-normal temperatures over much of Asia had a moderating effect. |
Atmospheric Drivers
Subtropical highs, and fronts and low pressure systems moving in the mid-latitude storm track flow, are influenced by the broadscale atmospheric circulation. The circulation of the atmosphere can be analyzed and categorized into specific patterns. The Tropics, especially the equatorial Pacific Ocean, provides abundant heat energy which largely drives the world's atmospheric and oceanic circulation. The following describes several of these modes or patterns of the atmospheric circulation, their drivers, the temperature and precipitation patterns (or teleconnections) associated with them, and their index values this month:
-
El Niño Southern Oscillation (ENSO)
- Description: Oceanic and atmospheric conditions in the tropical Pacific Ocean can influence weather across the globe. ENSO is characterized by two extreme modes: El Niño (warmer-than-normal sea surface temperature [SST] anomalies in the tropical Pacific) and La Niña (cooler-than-normal SST anomalies), with the absence of either of these modes termed "ENSO-neutral" conditions.
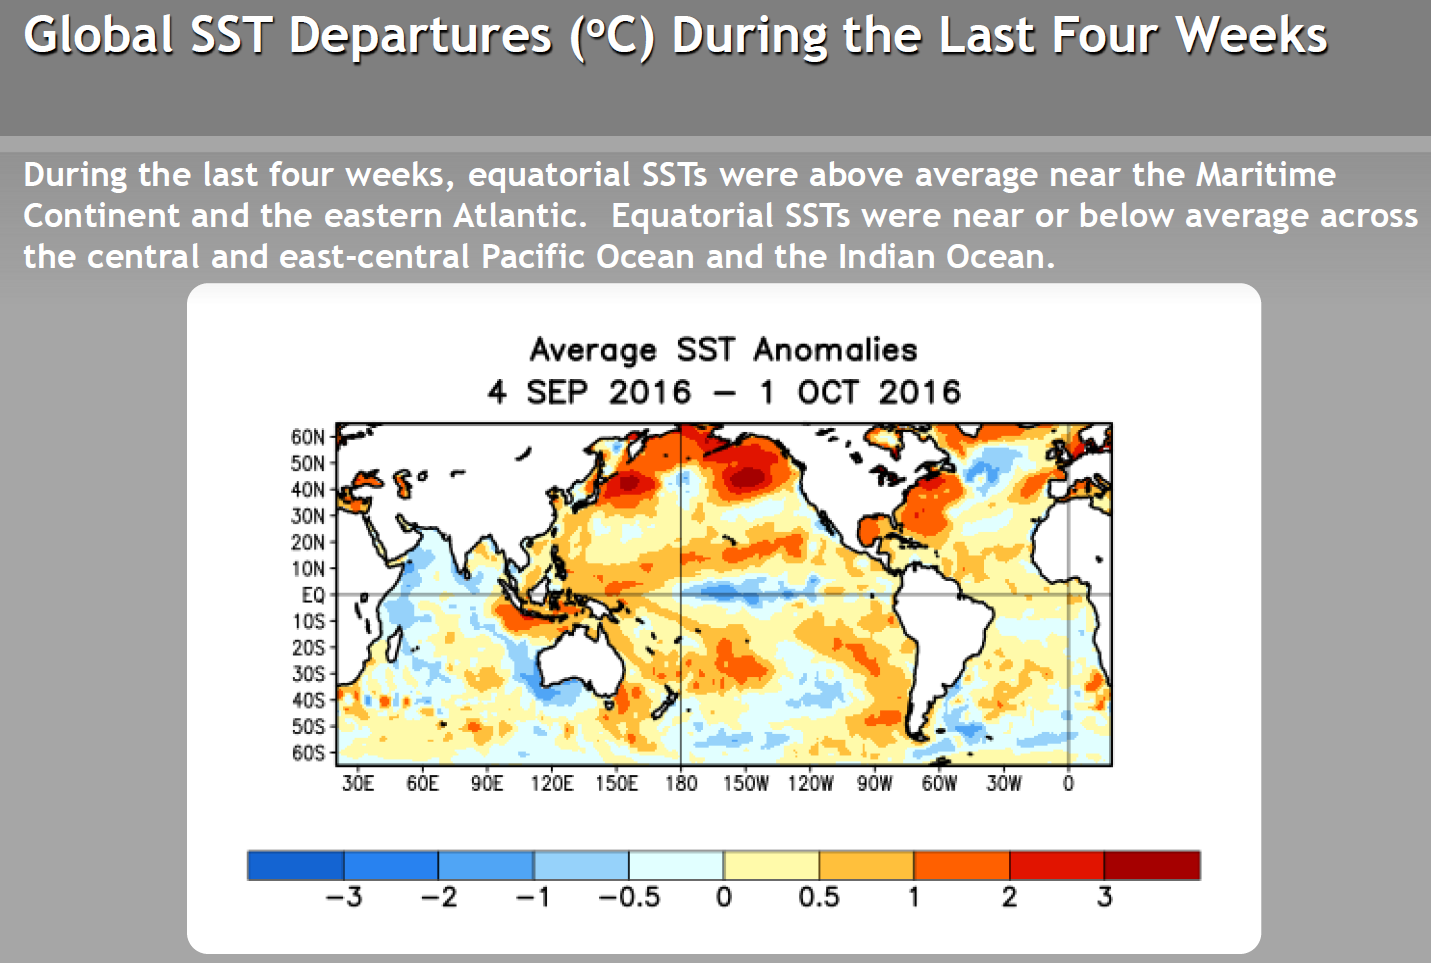
- Status: During October 2016, ENSO-neutral conditions continued but equatorial SSTs were below average in the central and east-central equatorial Pacific, suggesting conditions were trending toward a La Niña (a La Niña Watch was in effect).
- Teleconnections (influence on weather): The NWS CPC has no teleconnections for ENSO-neutral conditions.
- Comparison to Observed: But there is some similarity of the October 2016 precipitation anomaly pattern to the teleconnections expected with La Niña.
-
Madden-Julian Oscillation (MJO)
- Description: The MJO is a tropical disturbance or "wave" that propagates eastward around the global tropics with a cycle on the order of 30-60 days. It is characterized by regions of enhanced and suppressed tropical rainfall. One of its indices is a phase diagram which illustrates the phase (1-8) and amplitude of the MJO on a daily basis. The MJO is categorized into eight "phases" depending on the pattern of the location and intensity of the regions of enhanced and suppressed tropical rainfall. The MJO can enter periods of little or no activity, when it becomes neutral or incoherent and has little influence on the weather. Overall, the MJO tends to be most active during ENSO-neutral years, and is often absent during moderate-to-strong El Niño and La Niña episodes.
- Status: The MJO index began the month weakly in phase 5, but quickly became incoherent and remained incoherent for the rest of the month. Other modes of coherent subseasonal tropical variability influenced the tropical Pacific and global climate, including the (ENSO-neutral to potentially developing La Niña) base state, Kelvin wave activity, tropical cyclones, the Indian Ocean Dipole (IOD), and the Pacific monsoon trough (also known as the ITCZ, or Inter-tropical Convergence Zone). These Kelvin waves, IOD, tropical cyclones, and the monsoon trough in the western North Pacific may have masked the influence of the MJO (MJO updates for October 3, 10, 17, 24, and October 31).
- Teleconnections (influence on weather): There are no teleconnections for an incoherent MJO.
- The Pacific/North American (PNA) pattern
- Description: The PNA teleconnection pattern is associated with strong fluctuations in the strength and location of the East Asian jet stream. PNA-related blocking of the jet stream flow in the Pacific can affect weather downstream over North America, especially the West and especially in the winter half of the year.
- Status: The daily PNA index was positive for most of the month, averaging positive for the month as a whole. The 3-month-averaged index was also positive.
- Teleconnections (influence on weather): To the extent teleconnections are known, a positive PNA for this time of year (October on the quarterly teleconnection maps) is associated with above-normal temperatures in Alaska and western Canada extending down the west coast of the CONUS; below-normal temperature anomalies in the southern Plains to Southeast; above-normal upper-level circulation anomalies across western North America; and below-normal upper-level circulation anomalies across the Southern Plains to Southeast and Gulf of Mexico. There are few precipitation teleconnections, but below-normal precipitation is suggested over the Great Lakes.
- Comparison to Observed: The October 2016 temperature and upper-level circulation anomaly patterns are opposite those expected with a positive PNA. The precipitation anomaly pattern has little to compare to (few correlations over the CONUS) but it disagrees where there are correlations over the Great Lakes.
- The Arctic Oscillation (AO) pattern
- Description: The AO teleconnection pattern relates upper-level circulation over the Arctic to circulation features over the Northern Hemisphere mid-latitudes and is most active during the cold season.
- Status: The daily AO index was negative for most of the month, averaging negative for the month. The 3-month-averaged index was near zero.
- Teleconnections (influence on weather): To the extent teleconnections are known, a negative AO in October (September-November in the AO Composites table) is typically associated with areas of dryness in the coastal Pacific Northwest, Southern Plains, and Southeast; scattered wet conditions (the precipitation teleconnections are generally weak); below-normal temperatures in the Northern Plains; and upper-level circulation anomalies which are above normal across the Arctic and Greenland, and below normal across the much of the North Pacific and across eastern North America.
- Comparison to Observed: The October 2016 upper-level circulation anomaly pattern is opposite that expected with a negative AO over North America. The October 2016 monthly precipitation anomaly and temperature anomaly patterns shows little agreement.
- The North Atlantic Oscillation (NAO) pattern
- Description: The NAO teleconnection pattern relates upper-level circulation over the North Atlantic Ocean to circulation features over the Northern Hemisphere mid-latitudes.
- Status: The daily NAO index was mostly near zero to slightly positive, averaging positive for the month. The 3-month-averaged index was slightly negative.
- Teleconnections (influence on weather): To the extent teleconnections are known, a positive NAO during October (October on the quarterly teleconnection maps) is associated with above-normal upper-level circulation anomalies over the eastern half of the CONUS, extending across the North Atlantic, and below-normal anomalies over Greenland. The precipitation teleconnections are very weak, with wetter-than-normal anomalies over the Ohio Valley, and the there are no temperature teleconnections over the CONUS.
- Comparison to Observed: The October 2016 upper-level circulation anomaly pattern agrees with that expected with a positive NAO where teleconnections exist. There are no teleconnections to compare against the temperature anomaly pattern, while the October 2016 precipitation anomaly pattern shows some agreement where teleconnections exist.
- The West Pacific (WP) pattern
- Description: The WP teleconnection pattern is a primary mode of low-frequency variability over the North Pacific and reflects zonal and meridional variations in the location and intensity of the (East Asian) jet stream in the western Pacific.
- Status: The monthly WP index was positive while the three-month average WP index was negative.
- Teleconnections (influence on weather): To the extent teleconnections are known, a positive WP during October (October on the quarterly teleconnection maps) is typically associated with above-normal temperatures across the Central and Northern Plains to Upper Midwest; below-normal precipitation in the Pacific Northwest, Upper Midwest, and Deep South; above-normal circulation anomalies over central Canada to the north central CONUS and across the western North Pacific; and below-normal circulation anomalies over the eastern North Pacific off the U.S. coast and over eastern Siberia.
- Comparison to Observed: The October 2016 monthly upper-level circulation anomaly pattern agrees across much of the Northern Hemisphere where teleconnections exist, except it is slightly displaced over North America. The temperature anomaly pattern agrees where teleconnections exist. The precipitation anomaly pattern agrees over the Deep South, but is opposite elsewhere.
- The East Pacific-North Pacific (EP-NP) pattern
- Description: The EP-NP teleconnection pattern relates SST and upper-level circulation patterns (geopotential height anomalies) over the eastern and northern Pacific to temperature, precipitation, and circulation anomalies downstream over North America. Its influence during the winter is not as strong as during the other three seasons.
- Status: The North Pacific SSTs cooled between 40 and 50 degrees North latitude and warmed in places south of there. The net result was a SST anomaly pattern that was similar to that of September, except not as warm in the north and a little warmer to the south. The pattern was mostly warmer than normal across the North Pacific, with a few spots cooler than normal. Sea level pressure and upper-level height anomalies were below normal across the Sea of Okhotsk to Bering Sea and in the North Pacific off the Pacific Northwest coast, reflecting the frequent occurrence of low pressure systems which comprised the storm track. The October 2016 monthly EP-NP index and 3-month running mean were both negative.
- Teleconnections (influence on weather): To the extent teleconnections are known, a negative EP-NP index during October (October on the quarterly teleconnection maps) is typically associated with warmer-than-normal temperatures across the CONUS from the Great Plains to East Coast; colder-than-normal temperatures along the West Coast and over Alaska; below-normal upper-level circulation anomalies (weaker upper-level ridge) over Alaska and western Canada; and above-normal upper-level circulation anomalies across eastern North America (weaker upper-level trough) and over the central North Pacific. The precipitation teleconnections are weak but show above-normal precipitation in the Pacific Northwest.
- Comparison to Observed: The October 2016 temperature anomaly pattern is an excellent match to that expected with a negative EP-NP over the CONUS. The upper-level circulation anomaly pattern is a very good match, especially over eastern North America. The precipitation anomaly pattern has few teleconnections to compare to, but agrees in the Pacific Northwest.
Examination of the available circulation indices and their teleconnection patterns, and comparison to observed October 2016 temperature, precipitation, and circulation anomaly patterns, suggest that the weather over the CONUS in October was traced mostly to atmospheric drivers originating over the North Pacific and North Atlantic Oceans, with possibly some influence from the equatorial Pacific. The MJO was mostly incoherent during the month and there was little agreement between the October 2016 anomaly patterns and those expected with the PNA and AO drivers. The tropical Pacific Ocean was in an ENSO-neutral state but trending towards La Niña. The October precipitation anomaly pattern showed some similarity to the teleconnections expected with a La Niña, but this may be a coincidence since most of the indices have poor teleconnections for precipitation due to the lingering convective nature of precipitation during this transition season. The EP-NP temperature teleconnections are an excellent match to the October temperature anomalies over the CONUS and much of eastern Canada. The October upper-level circulation anomalies agreed best with an integration of the teleconnections for the EP-NP, WP, and NAO drivers. The EP-NP and NAO ideally captured the above-normal 500-mb heights over eastern North America, the WP was the best match for the negative anomalies over eastern Siberia and the North Pacific just off the Pacific Northwest coast, and the NAO correlated with the negative anomalies in the Greenland area. The EP-NP also had some agreement with the anomalies over the North Pacific. The NAO circulation teleconnections also reflected very well the sea level pressure pattern over the North Atlantic, eastern North America, and Greenland.
This month illustrates how the weather and climate anomaly patterns can be strongly influenced by atmospheric drivers (or modes of atmospheric variability) originating in the Pacific and North Atlantic Oceans, with the Bermuda subtropical high playing an important role.