Note: This Synoptic Discussion describes recent weather events and climate anomalies in relation to the phenomena that cause the weather. These phenomena include the jet stream, fronts and low pressure systems that bring precipitation, high pressure systems that bring dry weather, and the mechanisms which control these features — such as El Niño, La Niña, and other oceanic and atmospheric drivers (PNA, NAO, AO, and others). The report may contain more technical language than other components of the State of the Climate series.
Summary
Like last month, November 2015 was characterized by a strong El Niño which contributed to an energized upper-level circulation pattern over the contiguous United States (CONUS). Several troughs and ridges migrated through the jet stream flow at northern latitudes. Strong upper-level troughs and cutoff lows competed with the subtropical high pressure systems at lower latitudes. El Niño-enhanced convection triggered tropical cyclones over the eastern equatorial Pacific, and moisture from some of these systems moved across the CONUS. A complex synoptic weather pattern near the end of the month funneled tropical moisture into the Plains, bringing flooding rains. Fronts and weather systems moving in the jet stream flow brought areas of above-normal precipitation and severe weather to parts of the country, especially across the Plains and Midwest to Southeast. The air behind some of these fronts was cold enough to produce extensive areas of snow cover. High pressure ridging kept the Northeast drier than normal and much of the country east of the Rockies warmer than normal. The widespread heavy precipitation contracted drought across the Plains, Midwest, Southeast, and coastal Northwest. The upper-level circulation, temperature, and precipitation anomaly patterns suggest that the weather and climate of November 2015 were the result largely of atmospheric drivers originating over the Pacific Ocean, with the El Niño playing an important role. See below for details.
Synoptic Discussion
 |
 |
In the Northern Hemisphere, November marks the end of climatological fall (autumn) which is the time of year when solar heating decreases as the sun angle decreases, arctic air masses become much colder, and an expanding circumpolar vortex forces the jet stream to migrate southward. Polar air masses influence the weather over the contiguous U.S. (CONUS) more, and the warm, dry subtropical high pressure belts influence the weather less.
That wasn't the case during November 2015. The North Pacific and North Atlantic subtropical high pressure centers continued to have a strong influence on the weather across the CONUS. An active upper-level circulation dominated at higher latitudes, with several short-wave troughs and ridges migrating through the jet stream flow. The troughs frequently plunged south to form cutoff lows which competed with the subtropical highs across the southern tier states. The jet stream circulation was energized by Pacific tropical cyclones spawned under the influence of a strong El Niño.
The oceanic and atmospheric conditions associated with El Niño enhanced tropical cyclone activity in the eastern and central equatorial Pacific Ocean, while increasing vertical wind shear over the North Atlantic Ocean, which inhibited the development of tropical cyclones in the Atlantic and Caribbean. Two tropical cyclones (Tropical Storm Rick and Hurricane Sandra) formed in the Eastern Tropical Pacific, which is highly unusual for this time of year, and one tropical cyclone (Typhoon In-Fa) formed in the Central to Western Tropical Pacific during November. Tropical moisture from the remnants of Hurricane Sandra moved across Mexico then became entrained in a complex synoptic circulation over the Southern Plains to Mississippi Valley at the end of November — the moisture was caught up in the southwesterly flow over Mexico along the southern edge of a large upper-level trough, then directed into the Southern Plains. Several days of heavy rains resulted as the moist air was lifted over a stationary front (November 27, 28, 29).
One tropical cyclone, Hurricane Kate, formed in the Atlantic basin. This is near the end of the Atlantic hurricane season and about average for November.
The number of major hurricanes observed in the Eastern Tropical Pacific for the 2015 season was the highest since reliable records began in 1971, and the seasonal Accumulated Cyclone Energy (ACE) was above average. Both of these results are expected during an El Niño. In terms of ACE, the 2015 Atlantic season was below average, which is consistent with an El Niño.
Typhoon In-Fa moved northward in the Pacific and added its energy to the jet stream flow. This energy propagated downstream over North America, contributing to the vigor of upper-level ridges and troughs over the CONUS.
The subtropical high pressure systems and strong El Niño helped keep the jet stream and storm track well to the north. Although cool fronts brought Pacific and Canadian air masses across the CONUS, the subtropical highs and El Niño, in combination with migrating jet stream ridges, kept temperatures warmer than normal across the central and eastern CONUS. The tendency for cutoff lows to form and slowly move across the western CONUS and into the central U.S. resulted in below-normal 500-mb heights and cooler-than-normal temperatures over the West. By the end of the month, there were 4,502 record warm daily high (1,642) and low (2,860) temperature records, which is five times the 866 record cold daily high (494) and low (372) temperature records. New Jersey had the warmest November in the 1895-2015 record and 28 other states east of the Rockies ranked in the top ten warmest category, with the CONUS ranking 13th warmest nationally. The REDTI (Residential Energy Demand Temperature Index) for November 2015 ranked fourth lowest for November, illustrating how the unusually warm temperatures reduced heating demands in the heavily-populated Plains to East Coast.
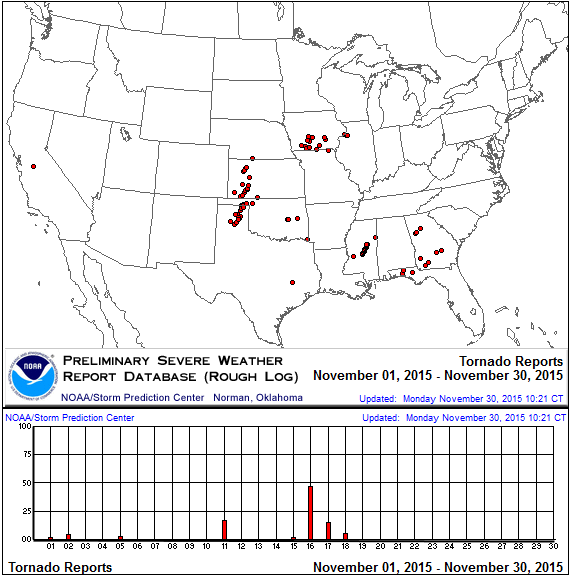
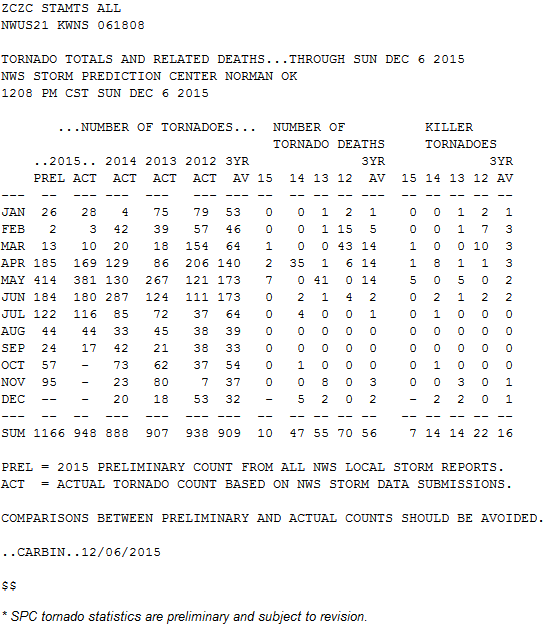
With strong cutoff lows moving slowly out of the West and into the Plains, a divergent southerly flow is set up over the Plains. This pattern contributes to the development of thunderstorms and severe weather. There were 95 tornadoes nationwide during November (according to preliminary reports), which is above the November average of 58. Most of the tornadoes occurred in the Plains to Midwest and Southeast with cutoff lows and strong troughs on the 11th and 16th-17th.
An unusual feature of this month's circulation was the highly elongated or meridional nature of the jet stream flow. As noted earlier, this resulted in the development of several strong troughs and cutoff lows which moved across the southern tier states, especially in the Southwest. The southerly circulation along the east end of these systems funneled Gulf of Mexico moisture into the Plains to Midwest and Southeast, resulting in much above-normal precipitation. Arkansas and Missouri had the wettest November in the 1895-2015 record, while eleven other states ranked in the top ten wettest category.
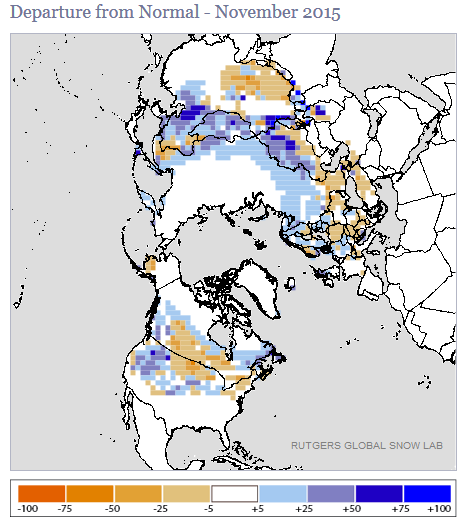
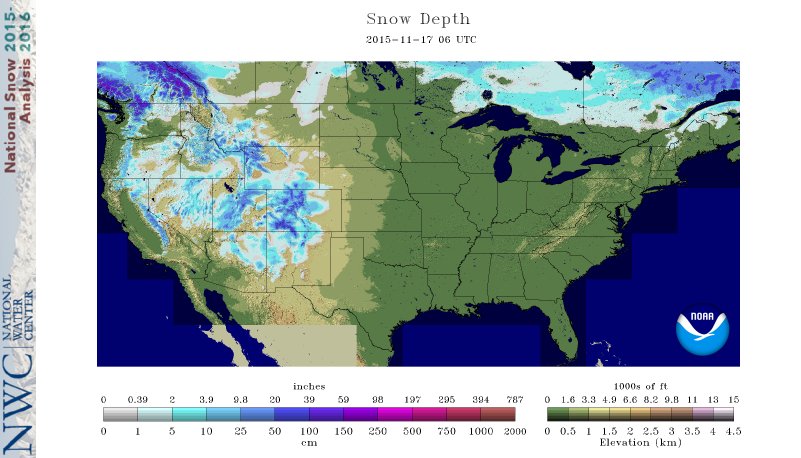
Cold fronts and surface lows were associated with the upper-level systems. The air behind some of these fronts was cold enough to produce snow instead of rain. A new storm system would lay down a new snow cover every five to six days, with nearly 40 percent of the CONUS snow covered at the peak on November 28th. The storms increased the snow cover across much of the West and from the Central Plains to Midwest, but mostly missed the Northern Plains to south central Canada and Northeast.
Another unusual feature of this month's atmospheric circulation was the persistent flow of Pacific weather systems into the Northwest. Locally heavy rainfall amounts led to above-normal monthly precipitation in coastal Washington and contributed to retreat of drought west of the Cascades in that state. It is unusual because during typical El Niño years storm systems are deflected away from the Pacific Northwest.
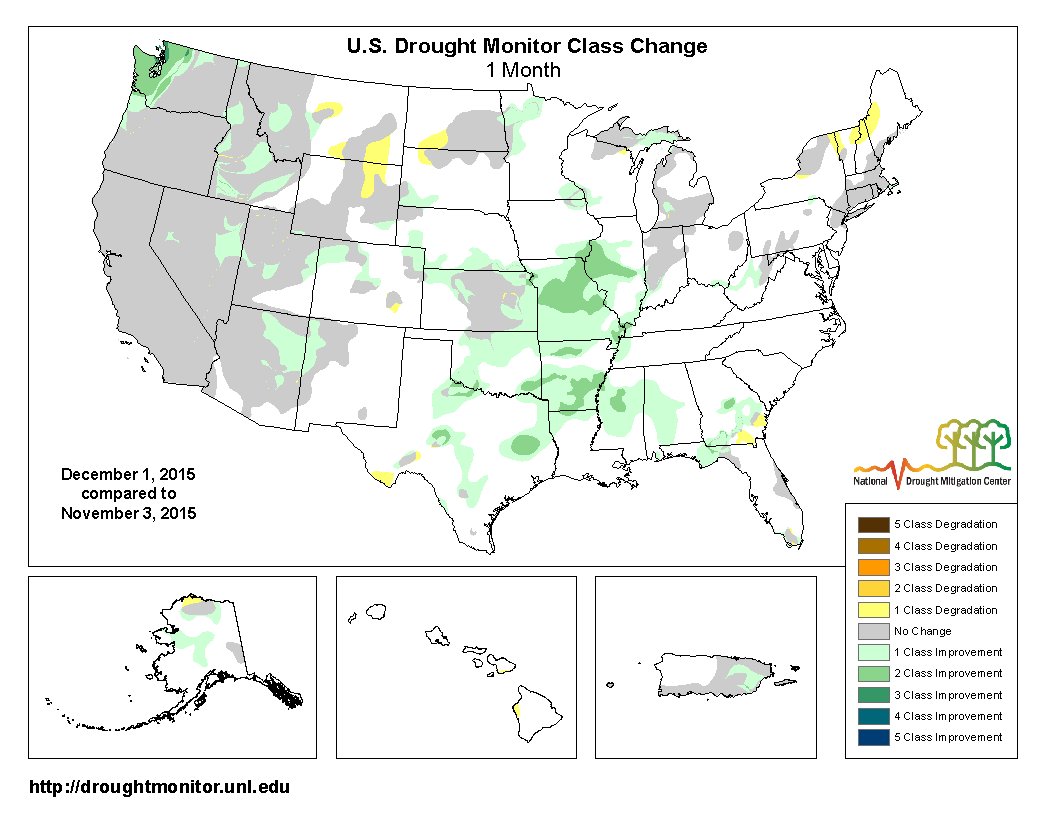
Nationally, November 2015 ranked as the fourth wettest November in the 1895-2015 record. The heavy rains reduced drought and abnormal dryness in the Plains to Midwest and Southeast. Drought also contracted slightly in parts of the West, and above-normal precipitation across parts of Alaska and Puerto Rico reduced drought and abnormal dryness in those areas. Overall, the national moderate-to-exceptional drought footprint shrank to 17.2 percent of the U.S. as a whole, and 20.6 percent of the CONUS.
The Climate Extremes Index (CEI) aggregates temperature and precipitation extremes across space and time. Several parts of the U.S. experienced temperature and precipitation extremes during November. These included the East North Central and Southeast regions, which had the eighth most extreme November CEI in the 1910-2015 record, the Northeast region (12th most extreme), and South region (14th most extreme). The East North Central region's eighth most extreme November CEI was due to the third most extreme warm minimum and fourth most extreme warm maximum temperature components, 28th most extreme 1-day precipitation component, 31st most extreme days with precipitation component, and 33rd most extreme wet spell component. The Southeast region's eighth most extreme November CEI was due to the second most extreme warm minimum and 12thmost extreme warm maximum temperature components, tenth most extreme days with precipitation component, and 19th most extreme wet spell component. When aggregated across the nation, November 2015 had the 14th most extreme national November CEI on record.
 North America monthly upper-level circulation pattern and anomalies. Troughs and ridges migrated through the jet stream flow at higher latitudes while cutoff lows frequently traversed the lower latitudes of the CONUS. But the cutoff lows tended to favor the western CONUS with high pressure ridging over the east, resulting in a below-normal 500-mb height anomaly pattern over the southwestern CONUS and an above-normal pattern over the eastern CONUS and Canada. |
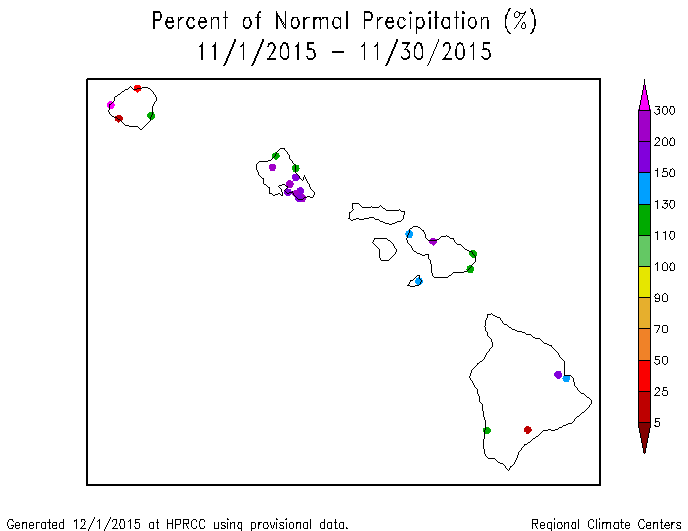
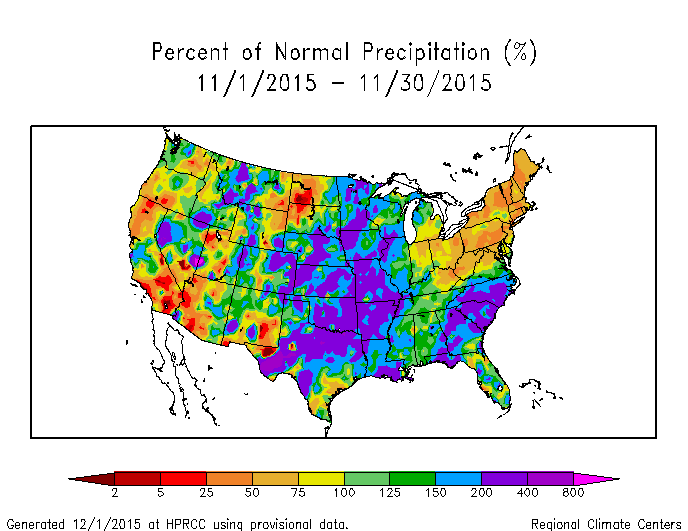 Map of monthly precipitation anomalies. Wetter-than-normal monthly precipitation anomalies dominated across the Southeast, most of the Midwest and Plains, and parts of the West. November was drier than normal across the Northeast and parts of the Ohio Valley, Northern Plains, and West. The precipitation anomaly pattern was mixed in Puerto Rico but mostly wetter than normal in Alaska and Hawaii. |
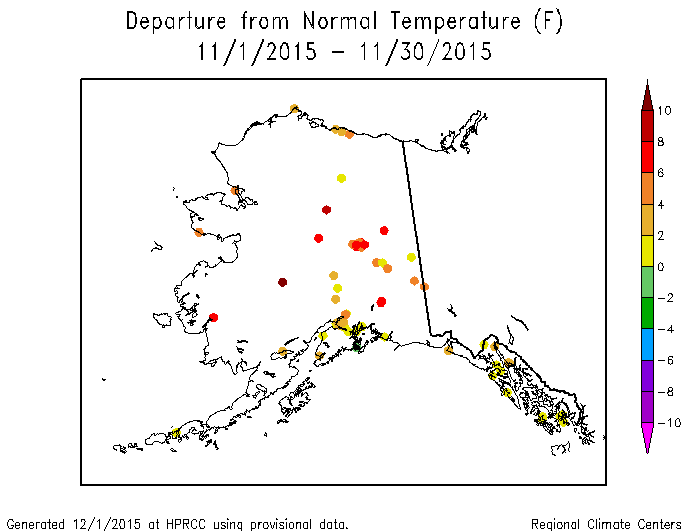
 Map of monthly temperature anomalies. November 2015 averaged warmer than normal across Alaska and the CONUS east of the Rocky Mountains. Temperatures were cooler than normal across the West. |

Northern Hemisphere monthly upper-level circulation pattern and anomalies.
Atmospheric Drivers
Subtropical highs, and fronts and low pressure systems moving in the mid-latitude storm track flow, are influenced by the broadscale atmospheric circulation. The circulation of the atmosphere can be analyzed and categorized into specific patterns. The Tropics, especially the equatorial Pacific Ocean, provides abundant heat energy which largely drives the world's atmospheric and oceanic circulation. The following describes several of these modes or patterns of the atmospheric circulation, their drivers, the temperature and precipitation patterns (or teleconnections) associated with them, and their index values this month:
-
El Niño Southern Oscillation (ENSO)
- Description: Oceanic and atmospheric conditions in the tropical Pacific Ocean can influence weather across the globe. ENSO is characterized by two extreme modes: El Niño (warmer-than-normal sea surface temperature [SST] anomalies in the tropical Pacific) and La Niña (cooler-than-normal SST anomalies), with the absence of either of these modes termed "ENSO-neutral" conditions.
- Status: During November 2015, El Niño conditions were observed as above-average SSTs continued across the western and central equatorial Pacific and continued to be coupled to the tropical atmosphere. Collectively, the atmospheric and oceanic features reflected strong El Niño.
- Teleconnections (influence on weather): To the extent teleconnections are known, the typical temperature and precipitation patterns associated with El Niño during November include above-normal precipitation in parts of the Southwest, Southern Plains, and Southeast; below-normal precipitation across the northern tier states from the Northwest to Northern and Central Plains, Midwest, and Northeast, as well as parts of the Southeast; above-normal temperatures in the Northwest to Northern Plains; near-normal temperatures in the Northeast; and below-normal temperatures across much of the Southwest to Southern Plains and parts of the Southeast, although there is a trend toward warmer-than-normal temperatures for much of the CONUS.
- Comparison to Observed: The November 2015 precipitation anomaly pattern is a reasonable match with that expected historically with an El Niño in the Southern Plains (where it was wet) and Northeast and parts of the Northern Plains (where it was dry), but not in the rest of the CONUS. The temperature anomaly pattern matches the historical teleconnections in the Southwest and Northern Plains, but is opposite across the rest of the CONUS, although it does fit the trend.
-
Madden-Julian Oscillation (MJO)
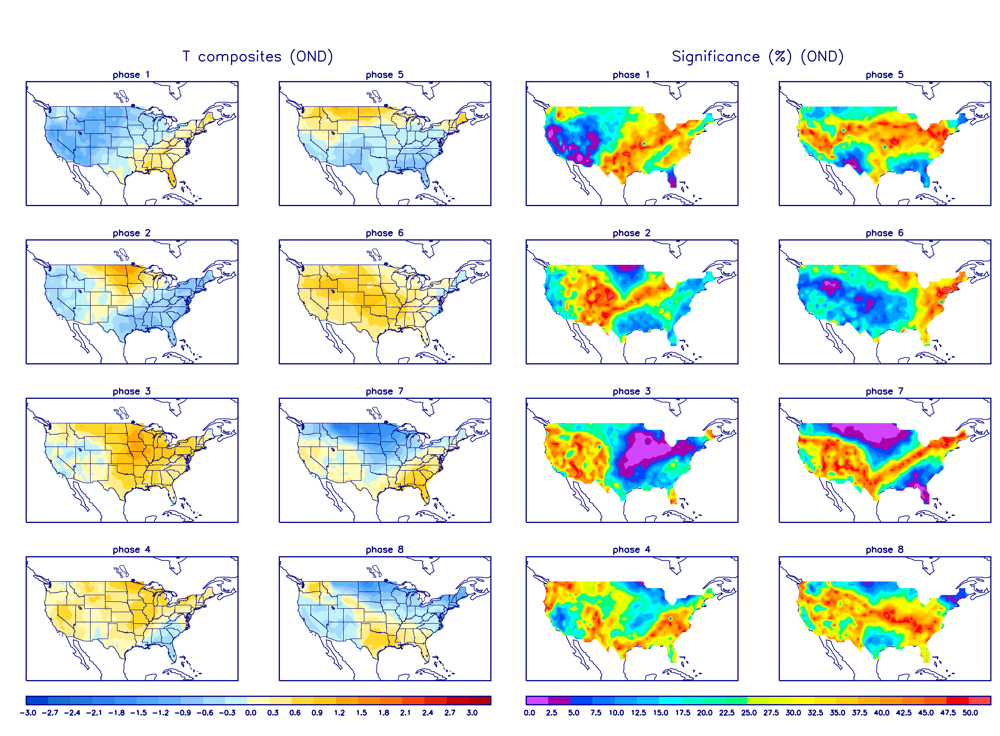
- Description: The MJO is a tropical disturbance or "wave" that propagates eastward around the global tropics with a cycle on the order of 30-60 days. It is characterized by regions of enhanced and suppressed tropical rainfall. One of its indices is a phase diagram which illustrates the phase (1-8) and amplitude of the MJO on a daily basis. The MJO is categorized into eight "phases" depending on the pattern of the location and intensity of the regions of enhanced and suppressed tropical rainfall. The MJO can enter periods of little or no activity, when it becomes neutral or incoherent and has little influence on the weather. Overall, the MJO tends to be most active during ENSO-neutral years, and is often absent during moderate-to-strong El Niño and La Niña episodes.
- Status: The MJO index started the month in phase 2 but spent most of the month in phase 3. The MJO typically migrates through two or more phases during a month, so its presence in phase 3 for most of the month indicated a weak MJO. Other modes of coherent subseasonal tropical variability, including the background El Niño state, tropical cyclone activity, and Rossby wave activity, influenced the tropical Pacific and global climate (MJO updates for November 9, 16, 23, and 30).
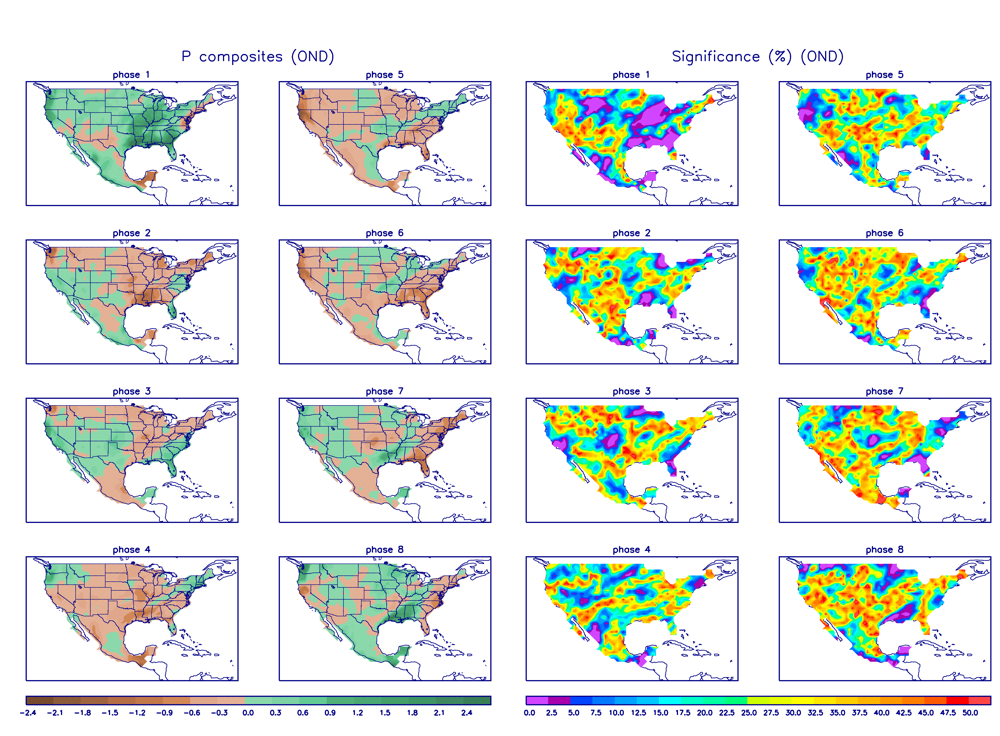
- Teleconnections (influence on weather): The MJO's temperature and precipitation teleconnections to U.S. weather depend on time of year and MJO phase. To the extent teleconnections are known, the October-December teleconnections for temperature are shown here and for precipitation are shown here.
- Comparison to Observed: The MJO is transitory and can change phases (modes) within a month, so it is more closely related to weekly weather patterns than monthly. But in the case of November 2015, the monthly temperature temperature anomaly pattern matches very well that expected with MJO phase 3, especially east of the Rockies where it was warmer than normal, even though the MJO was weak. The monthly precipitation anomaly pattern matches that expected with MJO phase 3 in the Northeast (drier than normal) and where the strongest correlations exist in the Central Plains and Southeast (wetter than normal). The weekly (weeks 1, 2, 3, 4) precipitation anomaly patterns match those expected with MJO phase 3 in various areas during each week.
- The Pacific/North American (PNA) pattern
- Description: The PNA teleconnection pattern is associated with strong fluctuations in the strength and location of the East Asian jet stream. PNA-related blocking of the jet stream flow in the Pacific can affect weather downstream over North America, especially the West and especially in the winter half of the year.
- Status: The daily PNA index was mostly neutral, averaging slightly negative for the month as a whole. The 3-month-averaged index was positive due to an extremely positive October value.
- Teleconnections (influence on weather): To the extent teleconnections are known, a negative PNA for this time of year (October on the teleconnection maps) is correlated with below-normal temperatures over Alaska, western Canada, and the extreme western CONUS; above-normal temperature anomalies over the Southern Plains and Southeast; below-normal upper-level circulation anomalies over western North America; and above-normal circulation anomalies over the Southern Plains to East Coast and the north central North Pacific. The precipitation teleconnection map shows little correlation to the PNA except for a hint of wet anomalies over the Midwest.
- Comparison to Observed: The November 2015 temperature and upper-level circulation anomaly patterns are a good match for the teleconnections for a negative PNA across the CONUS, but not so much over Canada or Alaska. The November 2015 precipitation anomaly pattern does not match, but few correlations exist.
- The Arctic Oscillation (AO) pattern
- Description: The AO teleconnection pattern relates upper-level circulation over the Arctic to circulation features over the Northern Hemisphere mid-latitudes and is most active during the cold season.
- Status: The daily AO index was mostly positive, averaging positive for the month. The 3-month-averaged index was positive.
- Teleconnections (influence on weather): To the extent teleconnections are known, a positive AO this time of year (October-December) is typically associated with dry conditions in the Southern Plains to Southeast, Upper Midwest, and Northeast; wet conditions in the coastal Northwest; above-normal temperatures across the Northern to Central Plains, Great Lakes, and into the Northeast; and upper-level circulation anomalies which are above normal in the North Central Pacific, central to northeastern CONUS, southeastern Canada, and across the North Atlantic, and below normal over the Arctic Ocean, Greenland, and Alaska.
- Comparison to Observed: The November 2015 monthly temperature anomaly pattern is a good match for those areas where correlations exist. The upper-level circulation anomaly pattern is similar, but appears shifted/expanded to the north. The monthly precipitation anomaly pattern agrees in the Northwest and Northeast, but is opposite to the pattern expected with a positive AO in the Plains, Southeast, and Midwest.
- The North Atlantic Oscillation (NAO) pattern
- Description: The NAO teleconnection pattern relates upper-level circulation over the North Atlantic Ocean to circulation features over the Northern Hemisphere mid-latitudes.
- Status: The daily NAO index was positive for the first half of the month and at month's end, and neutral at mid-month, averaging positive for the month. The 3-month-averaged index was positive.
- Teleconnections (influence on weather): To the extent teleconnections are known, a positive NAO during this time of year (October on the teleconnection maps) is associated with above-normal upper-level circulation anomalies over the eastern CONUS. There are no temperature teleconnections, and the precipitation teleconnections are very weak, with the Ohio Valley wetter than normal.
- Comparison to Observed: The November 2015 upper-level circulation anomaly pattern agrees over the eastern CONUS, but seems shifted over the Arctic. The temperature and precipitation anomaly patterns either show little agreement or have few or no teleconnections with a positive NAO.
- The West Pacific (WP) pattern
- Description: The WP teleconnection pattern is a primary mode of low-frequency variability over the North Pacific and reflects zonal and meridional variations in the location and intensity of the (East Asian) jet stream in the western Pacific.
- Status: The monthly WP index was positive. When the November value is averaged with the negative September and October values, the three-month average WP index was near zero.
- Teleconnections (influence on weather): To the extent teleconnections are known, a positive WP during this time of year (October on the maps) is typically associated with above-normal temperatures in the Central to Northern Plains; below-normal precipitation in the Northwest, Upper Midwest, and Deep South; above-normal circulation anomalies over the North Central Pacific and central Canada to the north central CONUS, and below-normal circulation anomalies over the eastern North Pacific just off the West Coast.
- Comparison to Observed: The November 2015 monthly temperature and upper-level circulation anomaly patterns show good agreement with those expected with a positive WP, where correlations exist, but the circulation anomalies appear slightly shifted. The precipitation anomaly pattern does not agree.
- The East Pacific-North Pacific (EP-NP) pattern
- Description: The EP-NP teleconnection pattern relates SST and upper-level circulation patterns (geopotential height anomalies) over the eastern and northern Pacific to temperature, precipitation, and circulation anomalies downstream over North America. Its influence during the winter is not as strong as during the other three seasons.
- Status: The November SSTs cooled along the North American coast but warmed just east of the International Dateline, resulting in an SST pattern that was more uniform across the eastern North Pacific. It was still warmer than normal, but the magnitude of the warmth was not as large compared to October. The November monthly EP-NP index and 3-month running mean were both negative.
- Teleconnections (influence on weather): To the extent teleconnections are known, a negative EP-NP index during this time of year (October on the maps) is typically associated with warmer-than-normal temperatures across central to eastern Canada and across the CONUS east of the Rockies (except for the Southeast), and cooler-than-normal temperatures across Alaska and the extreme West Coast of the CONUS; below-normal upper-level circulation anomalies (weaker upper-level ridge) over Alaska and western Canada, and above-normal upper-level circulation anomalies (weaker upper-level trough) over the CONUS east of the Rockies, eastern Canada, and the central North Pacific. The precipitation teleconnections are too weak to be mapped in any detail, although there is a hint of wetter-than-normal anomalies in the Northwest and drier-than-normal anomalies across southern Alaska.
- Comparison to Observed: The November 2015 temperature and upper-level circulation anomaly patterns agree with the teleconnections for a negative EP-NP in the central to eastern portions of the CONUS and Canada. The temperature anomaly pattern does not agree in Alaska and northwest Canada, perhaps because the upper-level circulation anomalies are shifted south of where the teleconnections indicate they are expected to be. The precipitation anomaly pattern agrees in the coastal Northwest, but not in southern Alaska, where hints of teleconnections exist.
Examination of the available circulation indices and their teleconnection patterns, and comparison to observed November 2015 temperature, precipitation, and circulation anomaly patterns, suggest that the weather over the CONUS in November reflected influences from Arctic and Pacific atmospheric drivers. The NAO showed little correlation with the November anomaly patterns, indicating that the North Atlantic atmospheric driver had little influence on November's weather over the CONUS. For temperature, the PNA, WP, and EP-NP had strong agreement, especially east of the Rockies, suggesting that the Pacific drivers were mostly in control. The AO temperature teleconnections were also strong, suggesting that the Arctic drivers also influenced temperatures, but it may have been a coincidence since the AO teleconnection pattern falls within the EP-NP teleconnection pattern. The MJO temperature pattern also matched, but that may also have been a coincidence for similar reasons since the MJO was weak this month. For the upper-level circulation, the November monthly anomaly pattern matches that expected with the PNA, WP, and EP-NP indices, suggesting that the Pacific drivers exerted the greatest influence, but the pattern was shifted in the west, hinting at other forces exerting an influence. For precipitation, most of the indices have weak or few teleconnections. El Niño, MJO, and AO had the closest agreement with the November precipitation anomaly patterns, but not everywhere.
The El Niño created atmospheric and oceanic conditions that enhanced the development of tropical storms and hurricanes in the eastern and central tropical Pacific Ocean. Moisture and energy from the remnants of some of these tropical cyclones directly impacted the CONUS, especially through a southern branch of the jet stream. The northern branch of the jet stream is influenced more by the drivers behind the PNA, WP, and EP-NP, as well as the AO. The interaction between these two branches likely created a chaotic pattern of precipitation anomalies which makes it difficult to trace them to any particular indicator.
This month illustrates how the weather and climate anomaly patterns can reflect the influence of several atmospheric drivers (or mode of atmospheric variability), but also how random variability can influence the month's weather.