Note: This Synoptic Discussion describes recent weather events and climate anomalies in relation to the phenomena that cause the weather. These phenomena include the jet stream, fronts and low pressure systems that bring precipitation, high pressure systems that bring dry weather, and the mechanisms which control these features — such as El Niño, La Niña, and other oceanic and atmospheric drivers (PNA, NAO, AO, and others). The report may contain more technical language than other components of the State of the Climate series.
Summary
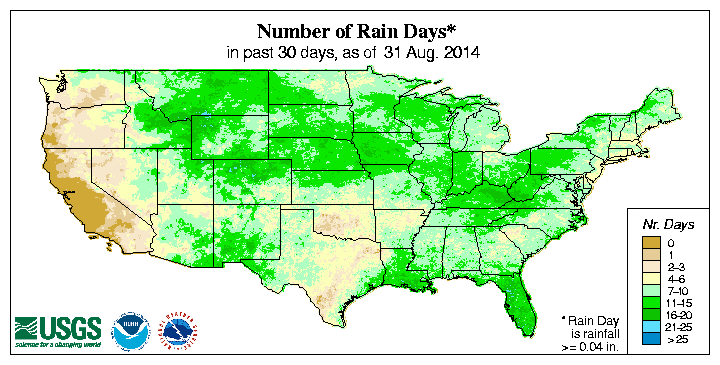
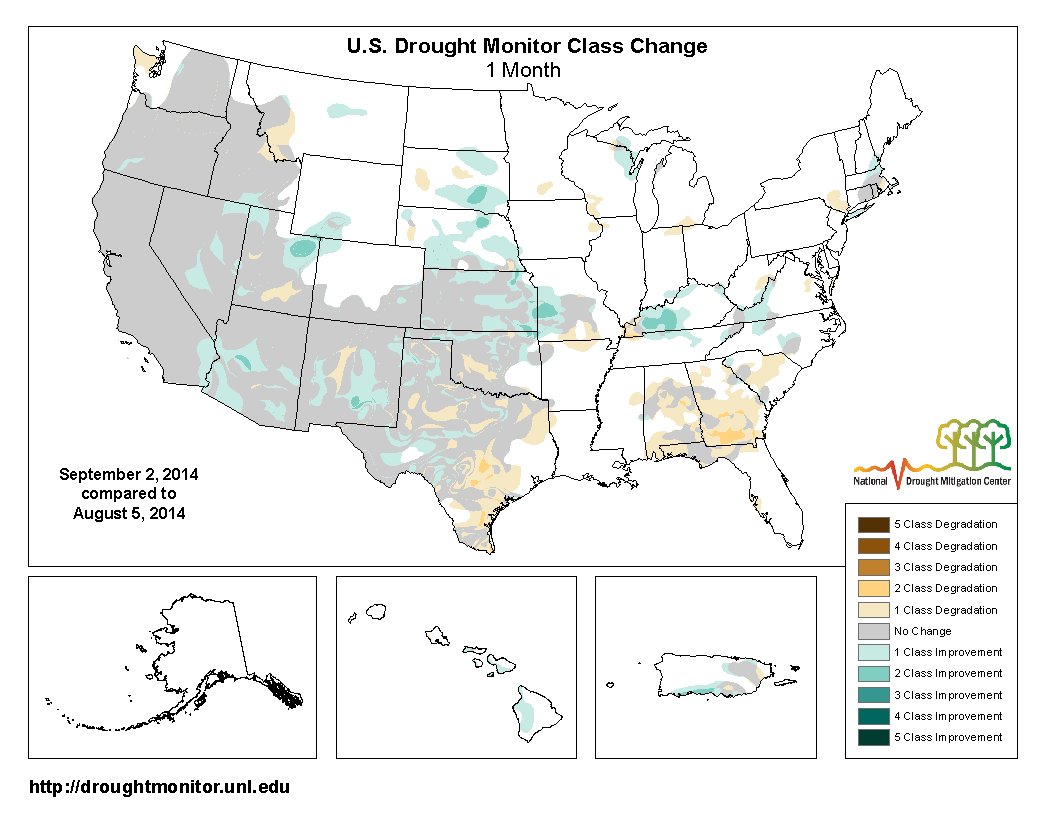
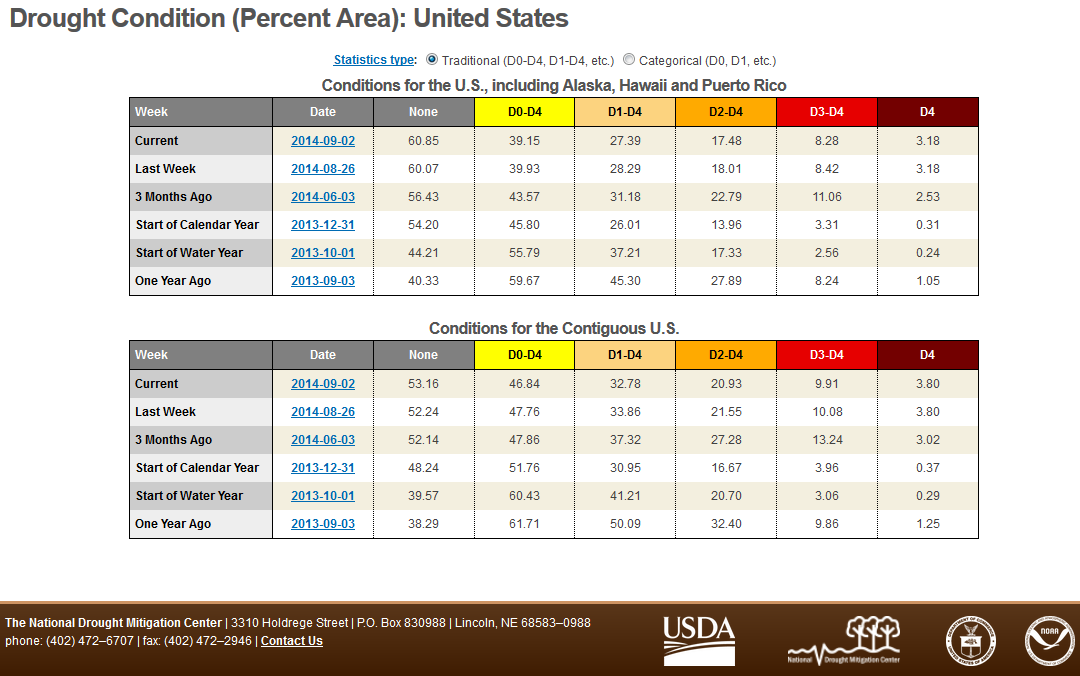
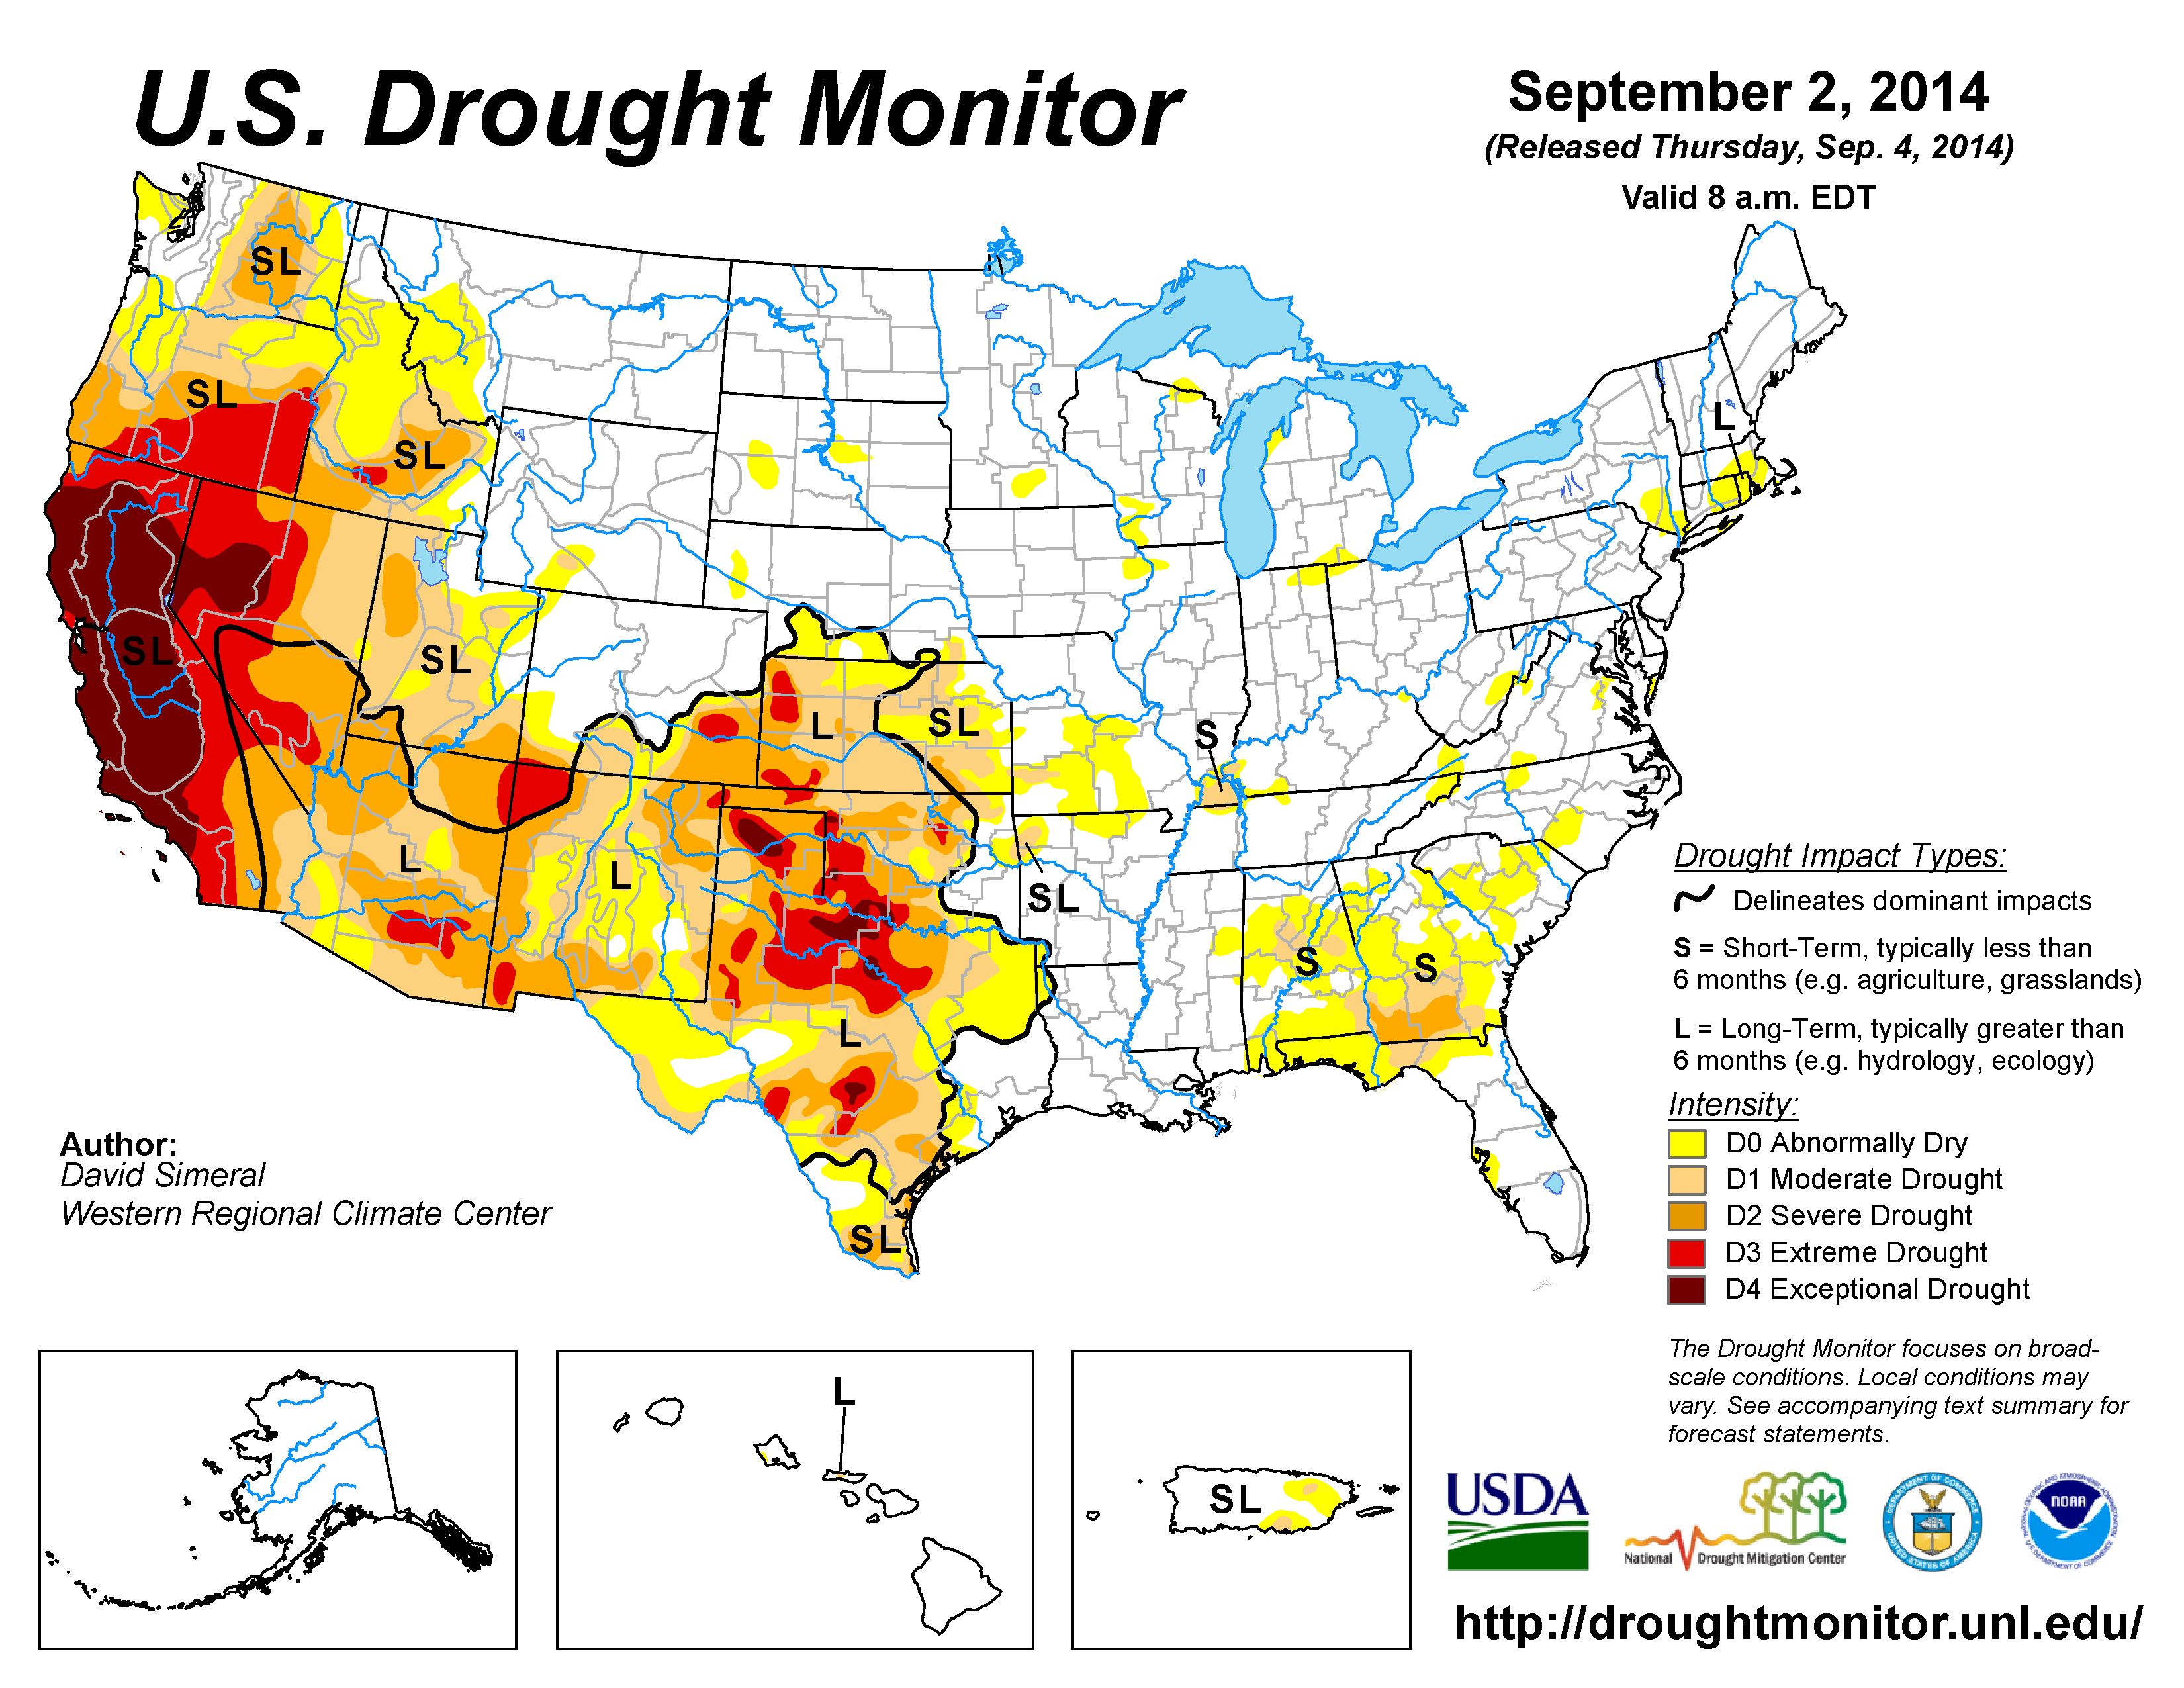
August 2014 was characterized by an active jet stream with many vigorous short-wave troughs and ridges migrating through the upper-level circulation. The competition between cool fronts beneath the troughs and warmer air associated with the ridges and subtropical highs resulted in a mixed pattern of temperature anomalies. Monsoon showers dumped moisture over parts of the southwestern U.S., while large wildfires ravaged areas farther west. Fronts and surface low pressure systems, associated with the jet stream troughs, brought above-normal rainfall to Northern Plains and Midwestern states, and areas of severe weather, mostly east of the Rockies. But the orientation of the upper-level circulation kept the number of tornadoes below normal and helped deflect tropical systems away from the continental United States (CONUS). Subsiding air from the subtropical Bermuda High kept precipitation below normal across much of the Southern Plains to Southeast. Drought contracted where it rained, and expanded where it didn't, with the net result being a contraction in the national drought footprint. The upper-level circulation pattern, and temperature and precipitation patterns, suggested that the weather and climate of August 2014 were influenced, in part, by modes of variability associated with conditions in the North Pacific, North Atlantic, Arctic, and equatorial Pacific oceans, but that normal random summer variability of the atmosphere also played a role. See below for details.
Synoptic Discussion
 Animation of daily upper-level circulation for the month. In the Northern Hemisphere, August is at the end of climatological summer which is the time of year when solar heating brings the warmest temperatures and forces the jet stream and circumpolar vortex to contract poleward. Polar air masses can still influence the weather, but they are usually rare and not as cold as in winter months. The warm, dry subtropical high pressure belt normally dominates the weather as it shifts northward, with warm southerly air masses holding sway across the contiguous United States (CONUS). In August 2014, the North Atlantic subtropical high pressure center (Burmuda High) exerted influence over the southeastern states and occasionally the Southern Plains states, but an active jet stream dominated the north, with many vigorous short-wave troughs and ridges migrating through the upper-level circulation. |
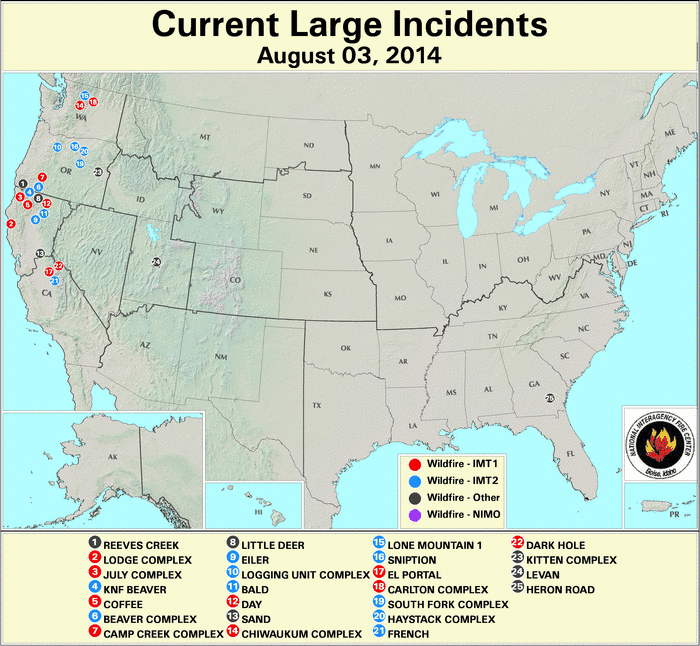
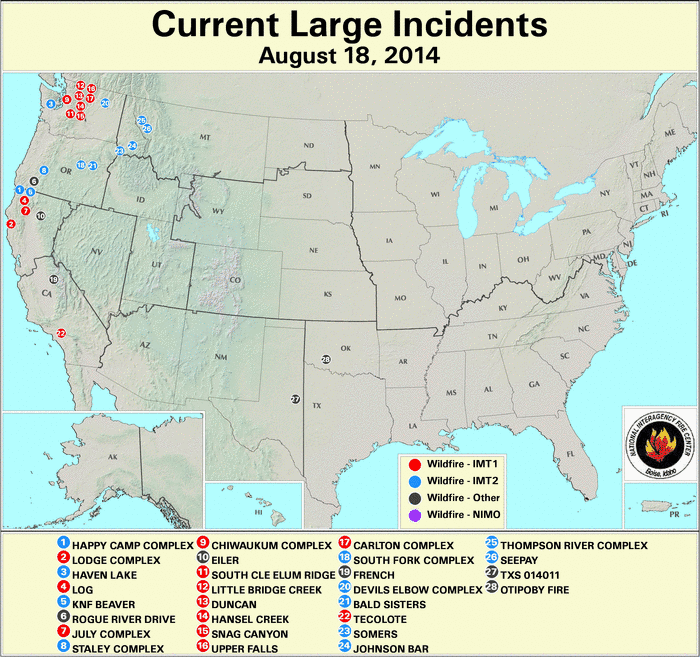
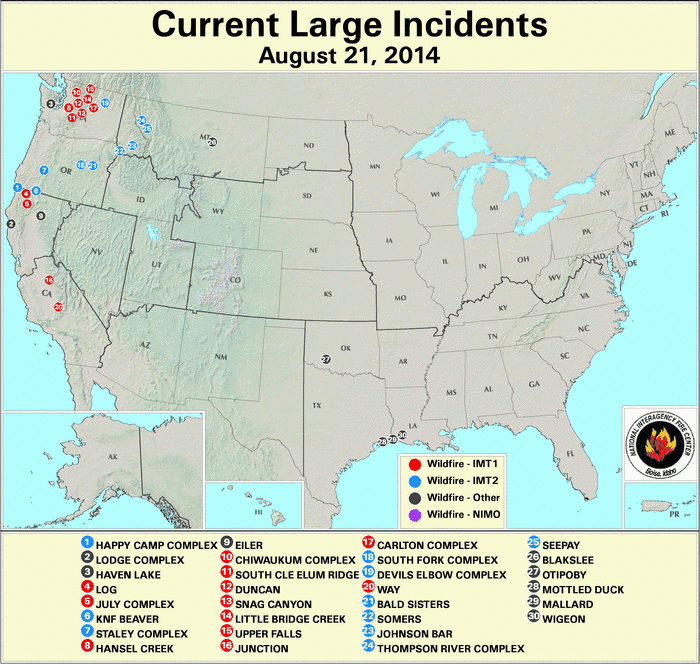
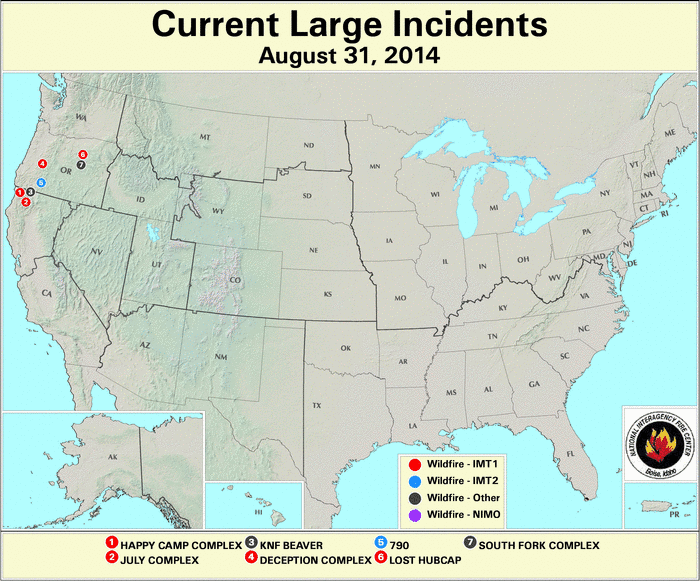
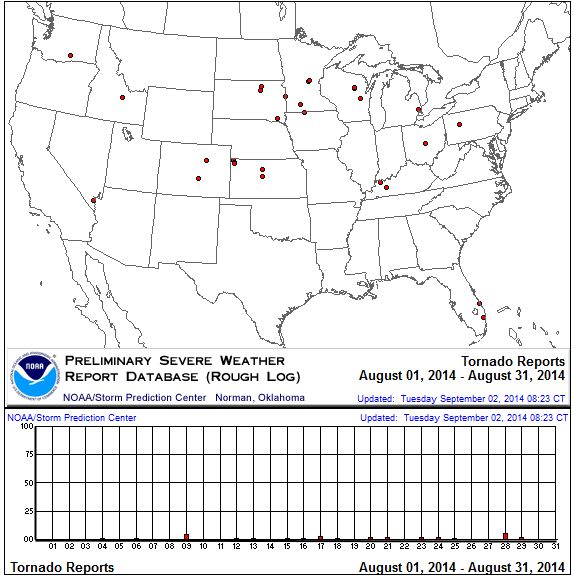
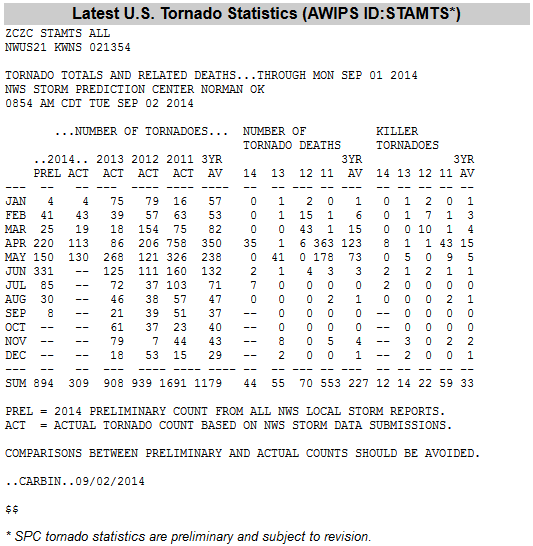
 Animation of daily surface fronts and pressure systems for the month. These upper-level weather systems generated low pressure systems with their associated cold fronts at the surface — warm air flowed ahead of the lows, with cooler air surging southward behind them. The competition between cool fronts beneath the troughs and warmer air associated with the ridges and subtropical highs resulted in a mixed pattern of temperature anomalies. This seesaw of warm and cold fronts produced 2,179 record warm daily high (431) and low (1,748) temperature records and about the same number (2,189) of record cold daily high (1,763) and low (426) temperature records. This was reflected in the national monthly average temperature which ranked August 2014 as the 53rd warmest August in the 1895-2014 record, or about average. The fronts and surface low pressure systems, associated with the jet stream troughs, brought frequent days with rain and above-normal monthly total rainfall to the Northern Plains, Northern Rockies, and Midwestern states. Subsiding air from the Bermuda High dominated much of the Southern Plains to Southeast, keeping precipitation below normal and contributing to expansion of drought. Monsoon showers dumped moisture over parts of the southwestern U.S., contracting drought, while upper-level ridges dominated the Pacific Northwest, bringing persistent warmer-than-normal weather (weeks 1, 2, 3, 4, 5). The warm and dry (weeks 1, 2, 3, 4, 5) weather with the ridges helped the development and spread of large wildfires in the Northwest and California, but rain from troughs and fronts at mid-month helped reduce the wildfire threat by the end of the month. The net change in drought area was a contraction of the moderate to exceptional national drought footprint compared to the end of July. The Climate Extremes Index (CEI) aggregates temperature and precipitation extremes across space and time. The fronts and low pressure systems from the stream of upper-level troughs gave the U.S. the third highest number of days with precipitation CEI component, but the competition between the upper-level systems muted the other components, resulting in a mid-range aggregated national CEI. On a regional basis, however, the highest warm minimum temperature component, ninth highest days with precipitation component, and twelfth highest warm maximum temperature component helped give the Northwest region its sixth most extreme CEI. The third most extreme drought and warm minimum temperature components contributed to the ninth most extreme CEI for the West region. With mixed temperature anomaly pattern across the country, the energy needed to cool the nation, as a whole, was mid-range with the August 2014 REDTI (Residential Energy Demand Temperature Index) ranking as the 58th highest August REDTI in the 120-year record. The migratory nature of the ridges and troughs in the upper-level circulation kept the number of tornadoes below normal, with a preliminary count of 30 tornadoes comparing to the average count of 83 tornadoes for August. It also helped to deflect the two North Atlantic tropical systems (Hurricanes Bertha and Cristobal) away from the CONUS. |
 Monthly upper-level circulation pattern and anomalies. When integrated across the month, the circulation produced a pattern of above-normal 500-mb heights (stronger-than-normal long-wave ridge) over the eastern North Pacific, into western Canada, and across Canada to Greenland. The circulation pattern consisted of below-normal 500-mb heights over southern Alaska and the adjacent parts of the Gulf of Alaska, and across parts of the North Atlantic Ocean. The short-wave ridges and troughs that migrated through the westerly flow resulted in a circulation pattern across the CONUS that averaged near normal. |
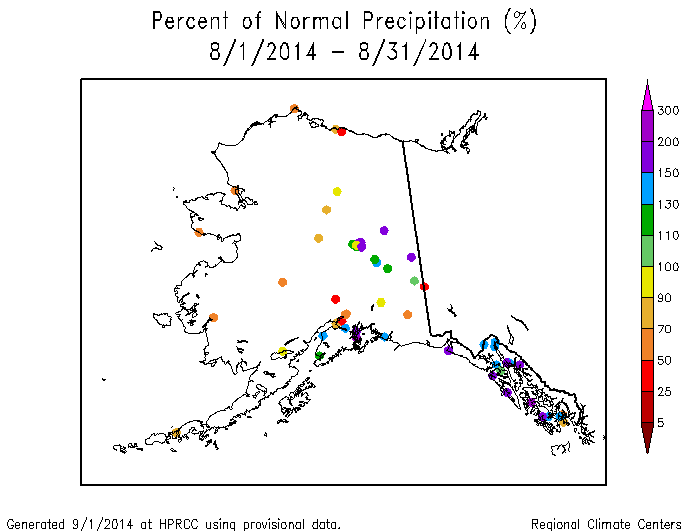
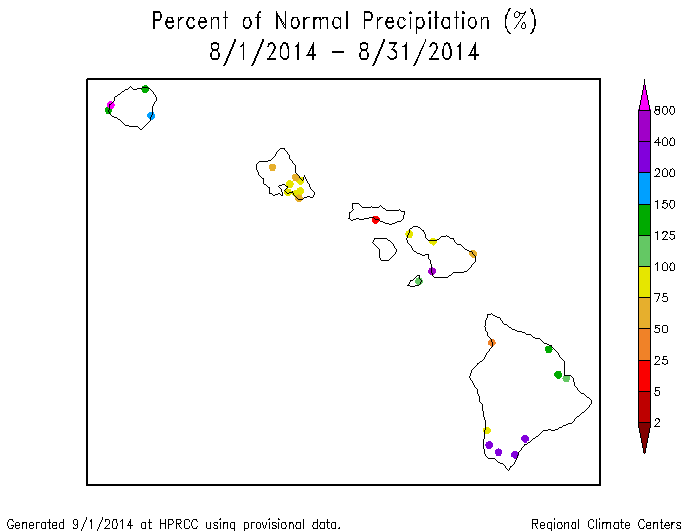
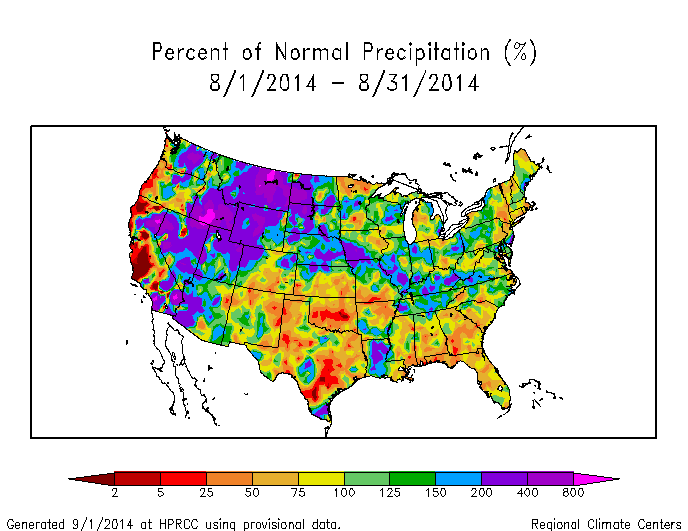 Map of monthly precipitation anomalies. Above-normal precipitation fell across much of the Southwest to Northern Rockies and Northern Plains, and across the Central Plains to parts of the Midwest and Mid-Atlantic states. Precipitation was below normal across the extreme West and much of the Southern Plains and Southeast, and parts of the Northeast. The precipitation pattern over Alaska was drier than normal over the west and wetter than normal over the east. The August rainfall pattern was mixed across Hawaii. |
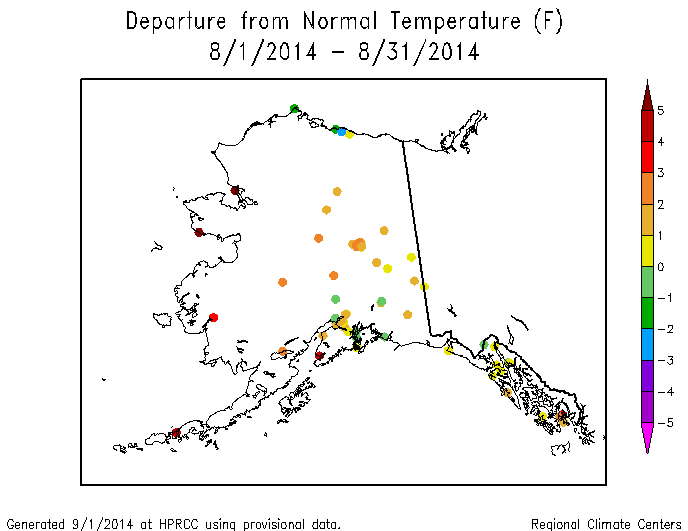
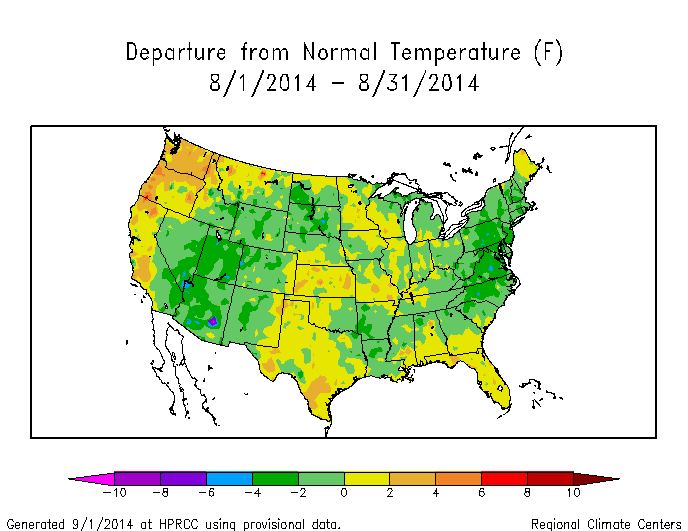 Map of monthly temperature anomalies. The frequent passage of cool short-wave troughs and warm short-wave ridges across the CONUS resulted in a mixed temperature anomaly pattern. Temperatures generally averaged below normal from the Southwest to Northern Plains, and in much of the East, and above normal over the Northwest. August temperatures were near to above normal across California and parts of the Central to Southern Plains, extreme Southeast, and extreme northern New England. Alaska averaged mostly warmer than normal. |
Global Linkages: The upper-level circulation over North America is part of the hemispheric mid-latitude westerly circulation. Unlike the CONUS, where short-wave troughs and ridges averaged out the upper-level circulation anomalies, the August 2014 circulation pattern over Eurasia consisted of several large-amplitude deviations in the westerly flow. Above-normal 500-mb heights, associated with ridging in the upper atmosphere, were reflected by above-normal temperatures at the surface over western and eastern Asia. Below-normal 500-mb heights, associated with troughs in the upper atmosphere, were reflected by below-normal temperatures and above-normal precipitation at the surface over northern Europe and north-central Asia.
Atmospheric Drivers
Subtropical highs, and fronts and low pressure systems moving in the mid-latitude storm track flow, are influenced by the broadscale atmospheric circulation. The circulation of the atmosphere can be analyzed and categorized into specific patterns. The tropics, especially the equatorial Pacific Ocean, provides abundant heat energy which largely drives the world's atmospheric and oceanic circulation. The following describes several of these modes or patterns of the atmospheric circulation, their drivers, the temperature and precipitation patterns (or teleconnections) associated with them, and their index values this month:
-
El Niño Southern Oscillation (ENSO)
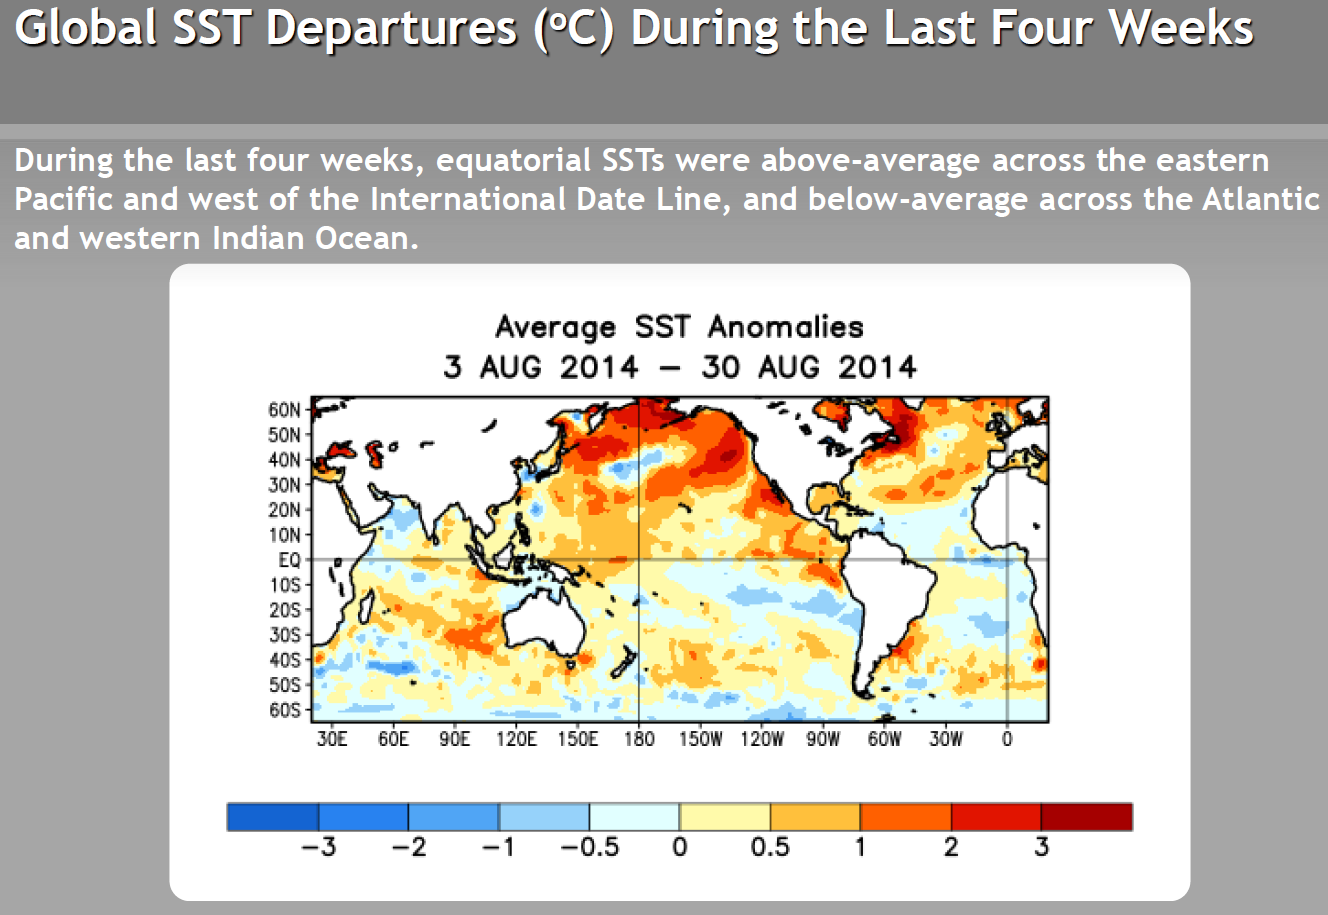
- Description: Oceanic and atmospheric conditions in the tropical Pacific Ocean can influence weather across the globe. ENSO is characterized by two extreme modes: El Niño (warmer-than-normal sea surface temperature [SST] anomalies in the tropical Pacific) and La Niña (cooler-than-normal SST anomalies), with the absence of either of these modes termed "ENSO-neutral" conditions.
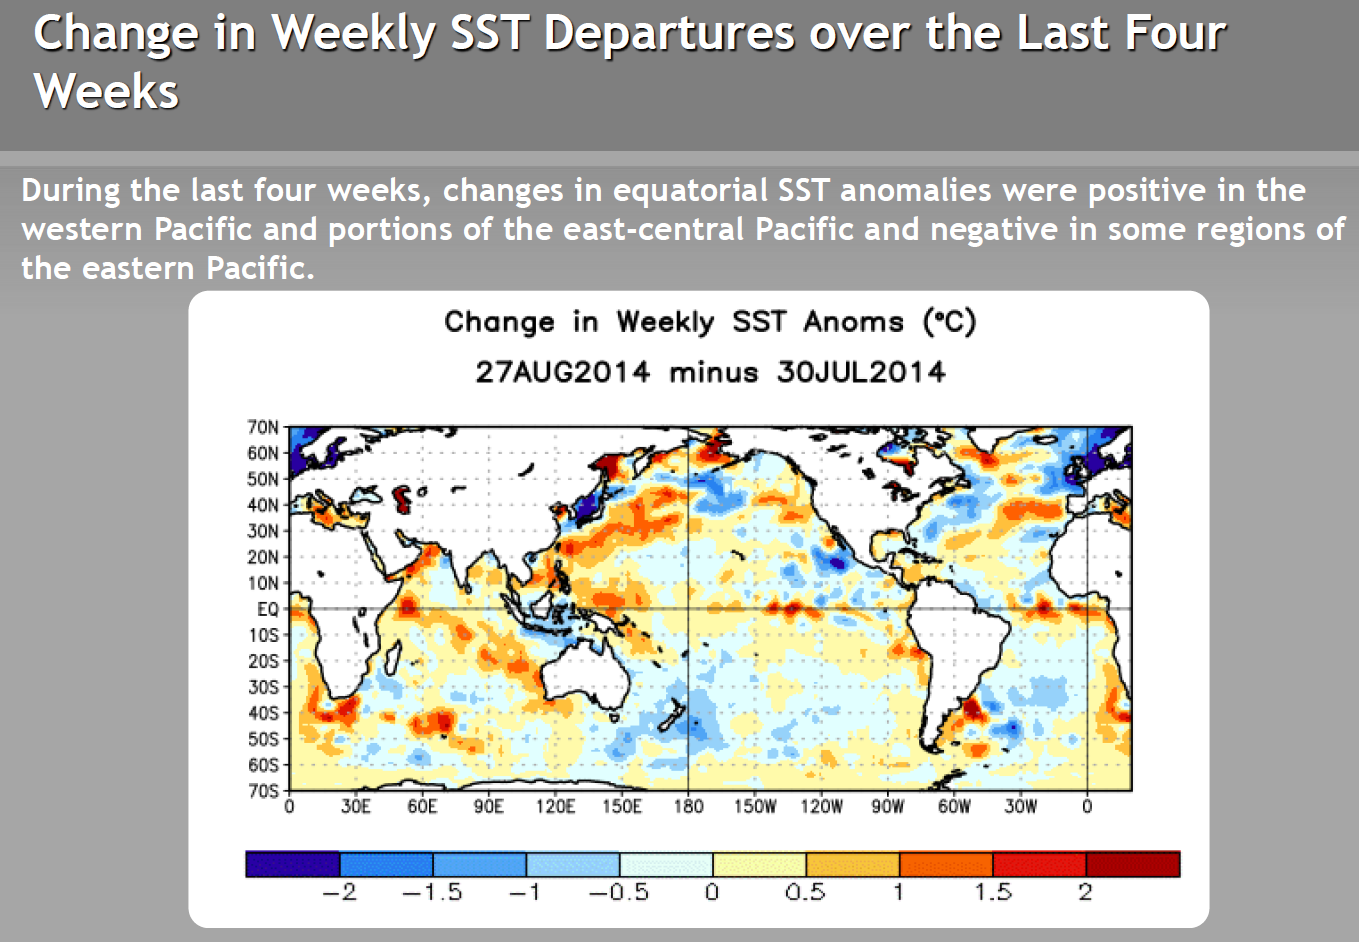
- Status: Ocean temperatures and atmospheric circulation anomalies indicated that the equatorial Pacific continued in an ENSO-neutral state during August. The equatorial Pacific SST anomalies remained near average in the east-central Pacific, while increasing in the western and eastern Pacific, but the collective atmospheric and oceanic conditions still reflect ENSO-neutral conditions.
- Teleconnections (influence on weather): To the extent teleconnections are known, while in a neutral state, ENSO normally is not a player in the month's weather. Historical data has been analyzed by NOAA to show typical temperature and precipitation patterns associated with El Niño and La Niña ENSO episodes. Teleconnections are not available for ENSO-neutral conditions at that NOAA web site. If an El Niño were happening during August, the typical precipitation pattern would consist of wetter-than-normal conditions in the Northern Plains to Upper Midwest, and drier-than-normal conditions in the Southern Plains and from the Southeast to Northeast and the typical temperature pattern would consist of below-normal temperatures in parts of the West, Northern Plains, and New England.
- Comparison to Observed: The August 2014 precipitation anomaly pattern shows some similarity to that expected with an El Niño in the Southern and Northern Plains and Southeast, and the temperature anomaly pattern is similar in the West and North.
-
Madden-Julian Oscillation (MJO)
- Description: The MJO is a tropical disturbance or "wave" that propagates eastward around the global tropics with a cycle on the order of 30-60 days. It is characterized by regions of enhanced and suppressed tropical rainfall. One of its indices is a phase diagram which illustrates the phase (1-8) and amplitude of the MJO on a daily basis. The MJO is categorized into eight "phases" depending on the pattern of the location and intensity of the regions of enhanced and suppressed tropical rainfall. The MJO can enter periods of little or no activity, when it becomes neutral or incoherent and has little influence on the weather. Overall, the MJO tends to be most active during ENSO-neutral years, and is often absent during moderate-to-strong El Niño and La Niña episodes.
- Status: The MJO started the month weakly incoherent, then transitioned into phases 1 and 2 where it stayed for most of the month, finally ending the month weak and incoherent again after briefly passing through phase 3. The MJO indices appeared to be influenced by other modes of coherent subseasonal tropical variability, including Kelvin and Rossby waves and the developing background state related to the transition to El Niño (as indicated by the MJO discussions for August 4, 11, 18, 25, and September 1).
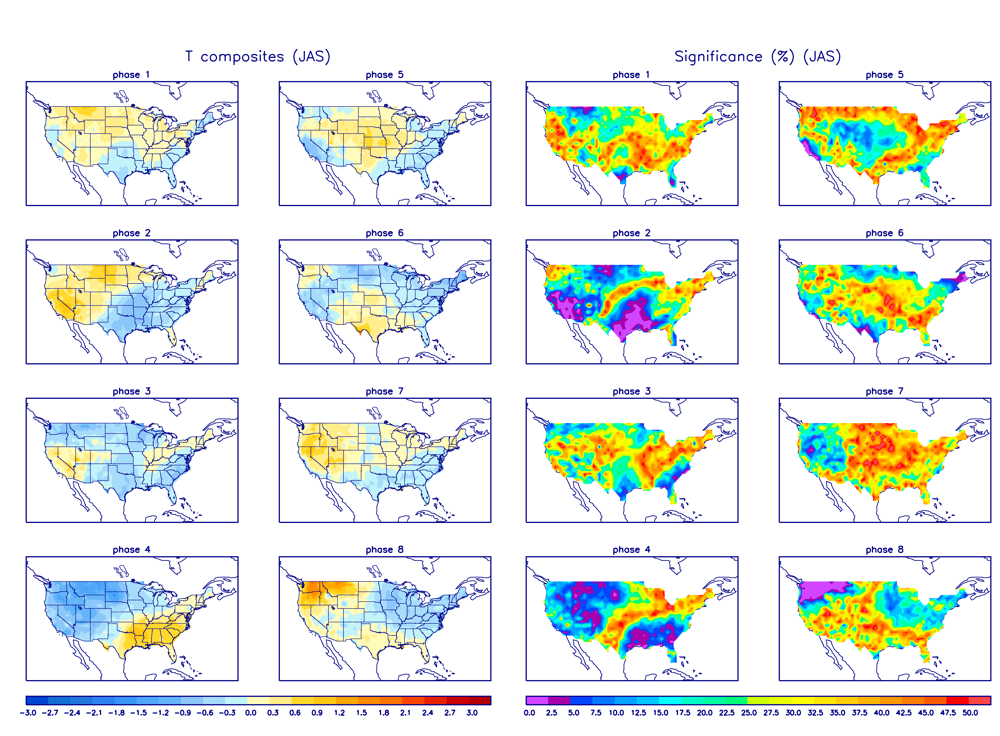
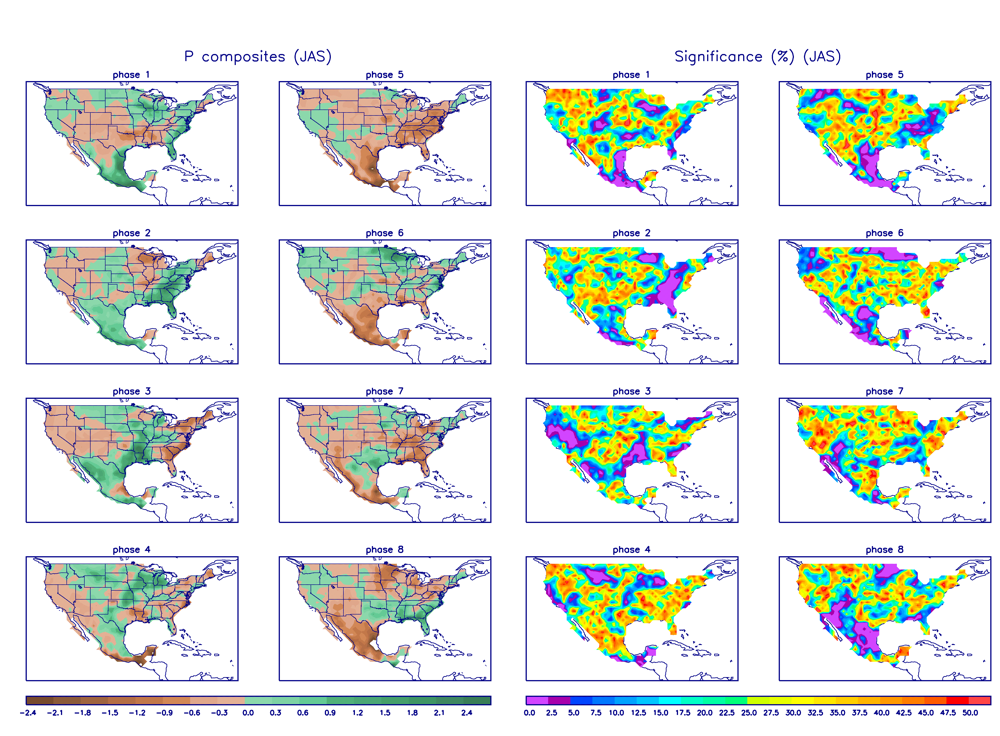
- Teleconnections (influence on weather): The MJO's temperature and precipitation teleconnections to U.S. weather depend on time of year and MJO phase. To the extent teleconnections are known, the July-September teleconnections for temperature are shown here and for precipitation are shown here.
- Comparison to Observed: The MJO is transitory and can change phases (modes) within a month, so it is more closely related to weekly weather patterns than monthly. The August 2014 monthly precipitation and temperature anomaly patterns, and August weekly patterns, show little resemblance to the teleconnections for MJO phases 1 and 2.
- The Pacific/North American (PNA) pattern
- Description: The PNA teleconnection pattern is associated with strong fluctuations in the strength and location of the East Asian jet stream. PNA-related blocking of the jet stream flow in the Pacific can affect weather downstream over North America, especially the West and especially in the winter half of the year.
- Status: The daily PNA index was positive for most of the month then turned negative at the end of the month, averaging positive for the month as a whole. The 3-month-averaged index was positive in August after a long run of mostly negative for the last two years.
- Teleconnections (influence on weather): There are virtually no significant temperature teleconnections during the summer. To the extent teleconnections are known, for a positive PNA, the precipitation teleconnection map for this time of year (July on the teleconnection maps) shows wetter-than-normal conditions from the Northern Rockies to Southern Plains and drier-than-normal weather in the northern Great Lakes (although the teleconnections for precipitation are weak). The upper-level circulation anomaly teleconnections are also weak, but for a positive PNA, below-normal heights are evident over eastern Canada.
- Comparison to Observed: The August 2014 precipitation anomaly pattern shows some similarity with a positive PNA over the Northern Rockies, but little agreement elsewhere, and the upper-level circulation anomaly pattern is opposite that expected over eastern Canada.
- The Arctic Oscillation (AO) pattern
- Description: The AO teleconnection pattern relates upper-level circulation over the Arctic to circulation features over the Northern Hemisphere mid-latitudes and is most active during the cold season.
- Status: The daily AO index was generally negative for the first half of the month and near zero to positive the last half, averaging negative for the month. The 3-month-averaged index was negative in August after a run of mostly positive for the last year.
- Teleconnections (influence on weather): To the extent teleconnections are known, a negative AO this time of year (July-September) is typically associated with dry conditions in New England and parts of Texas, wet conditions in the Central Plains, below-normal temperatures in the Northern Plains, above-normal temperatures in part of Texas, near normal temperatures elsewhere, and upper-level circulation anomalies which are below normal over eastern to central Canada.
- Comparison to Observed: The August 2014 precipitation anomaly pattern is a reasonable match in Texas, New England, and parts of the Central Plains. The temperature anomaly pattern does not match for most of the CONUS and the upper-level circulation anomaly pattern is opposite that expected with a negative AO over eastern Canada.
- The North Atlantic Oscillation (NAO) pattern
- Description: The NAO teleconnection pattern relates upper-level circulation over the North Atlantic Ocean to circulation features over the Northern Hemisphere mid-latitudes.
- Status: The daily NAO index was generally negative throughout August, averaging negative for the month. The 3-month-averaged index was negative in August and the last several months after a run of mostly positive for the previous year.
- Teleconnections (influence on weather): To the extent teleconnections are known, a negative NAO during this time of year (July on the teleconnection maps) is associated with cooler-than-normal temperatures in the Northwest to Northern Plains, warmer-than-normal temperatures in the Southern Plains to Southeast, little correlation elsewhere across the CONUS and over Alaska, wetter-than-normal conditions in the Northern Plains and Midwest, drier than normal in the western Gulf of Mexico coast, little correlation elsewhere across the CONUS and Alaska (although the teleconnections are weak for precipitation), and negative upper-level circulation anomalies across the Northern and Central Rockies, Northern Plains, and eastward to New England and the Canadian Maritimes.
- Comparison to Observed: The August 2014 monthly precipitation anomaly pattern agrees where teleconnections exist. The temperature anomaly pattern has some areas of agreement, but generally does not agree with the teleconnections expected with a negative NAO. The upper-level circulation anomaly pattern does not agree.
- The West Pacific (WP) pattern
- Description: The WP teleconnection pattern is a primary mode of low-frequency variability over the North Pacific and reflects zonal and meridional variations in the location and intensity of the (East Asian) jet stream in the western Pacific.
- Status: The monthly WP index was negative for the month, with the three-month average WP index negative for the last 12 months.
- Teleconnections (influence on weather): To the extent teleconnections are known, a negative WP during this time of year (July on the maps) is typically associated with above-normal temperatures in the Southwest and Midwest to Northeast, above-normal circulation anomalies over the Southwest, Midwest to Northeast, and eastern Canada, and below-normal circulation anomalies over western Canada. There are virtually no significant precipitation teleconnections during the summer.
- Comparison to Observed: The August 2014 monthly temperature and upper-level circulation anomaly patterns do not match what is expected over the CONUS.
- The Pacific Transition (PT) pattern
- Description: The PT teleconnection pattern relates upper-level circulation over the central subtropical North Pacific to circulation features over North America. It is a significant factor in the earth's circulation during August and September.
- Status: The PT index was positive during August.
- Teleconnections (influence on weather): To the extent teleconnections are known, a positive PT is typically associated with warmer-than-normal temperatures for the western CONUS and western Canada, cooler-than-normal temperatures for the eastern CONUS, and drier-than-normal conditions in the Midwest, Alaska, and parts of the Pacific Northwest to Northern Plains. The upper-level circulation anomalies for a positive PT are below-normal 500-mb geopotential heights over the eastern third of the CONUS into the North Atlantic, below-normal heights over the northeastern Pacific (including the Gulf of Alaska), and above-normal heights over the western half of the CONUS into south central Canada.
- Observed: The August 2014 monthly temperature anomaly pattern is consistent with a positive PT in the Pacific Northwest and eastern CONUS, but not elsewhere. The upper-level circulation anomaly pattern is similar to that expected with a positive PT except it appears shifted into Canada in the west and over the Atlantic in the east. The monthly precipitation anomaly pattern agrees over Alaska but not the CONUS.
- The East Pacific-North Pacific (EP-NP) pattern
- Description: The EP-NP teleconnection pattern relates SST and upper-level circulation patterns (geopotential height anomalies) over the eastern and northern Pacific to temperature, precipitation, and circulation anomalies downstream over North America. Its influence during the winter is not as strong as during the other three seasons.
- Status: The SST pattern over the northeastern North Pacific during August 2014 saw a continuation of the warmer-than-normal SSTs there, with the magnitude of the warmth still increasing over part of the area but decreasing in other parts. The monthly EP-NP index was negative during August, but it has alternated between positive and negative in the last four months, pulling the 3-month running mean to near zero or slightly negative.
- Teleconnections (influence on weather): To the extent teleconnections are known, a negative EP-NP index during this time of year (July on the maps) is typically associated with warmer-than-normal temperatures from the Central Rockies to the Great Lakes and beyond into Canada, cooler-than-normal temperatures in part of Alaska, drier-than-normal conditions in the vicinity of Montana and parts of the Midwest (although the precipitation teleconnections are very weak), below-normal upper-level circulation anomalies (weaker upper-level ridge) over Alaska and western Canada, and above-normal upper-level circulation anomalies (weaker upper-level trough) from the central CONUS to northeastern Canada.
- Comparison to Observed: The August 2014 temperature and precipitation anomaly patterns show little agreement to those expected with a negative EP-NP. The upper-level circulation anomaly pattern shows some agreement but appears shifted to the west slightly.
Examination of these circulation indices and their teleconnection patterns, and comparison to observed August 2014 temperature, precipitation, and circulation patterns, suggest that the weather over the CONUS in August was related to the normal chaotic nature of summer convection, but there were hints that the jet stream and ocean-atmosphere interactions over the North Pacific, Arctic, and North Atlantic Oceans played a role, and the equatorial Pacific may have exerted some limited influence. The MJO was mostly weak or incoherent and the PNA and WP showed little correlation. ENSO was neutral, but equatorial Pacific oceanic conditions were slowly evolving toward an El Niño state. A weak to moderate El Niño is forecast by the NOAA Climate Prediction Center to develop in the next few months, and there was even some similarity in the August temperature and precipitation patterns to those expected with an El Niño. But there was also some similarity in the August precipitation pattern to that expected with a negative AO and a negative NAO. The August circulation pattern had some similarity to the circulation patterns expected with the Pacific indices, EP-NP and PT, but they seemed to be shifted from what was expected. Likewise, the August temperature pattern had some agreement with that expected with a positive PT, but it, too, seemed shifted in places. The teleconnections for all of the indices are weak this time of year, especially for precipitation and temperature, indicating that random atmospheric processes (i.e., convection from solar heating) play an important role during the summer. This month illustrates how the weather and climate anomaly patterns can be the manifestation of normal (random) atmospheric variability, but also reflect influences from several atmospheric drivers (or modes of atmospheric variability).