Note: This Synoptic Discussion describes recent weather events and climate anomalies in relation to the phenomena that cause the weather. These phenomena include the jet stream, fronts and low pressure systems that bring precipitation, high pressure systems that bring dry weather, and the mechanisms which control these features — such as El Niño, La Niña, and other oceanic and atmospheric drivers (PNA, NAO, AO, and others). The report may contain more technical language than other components of the State of the Climate series.
Synoptic Discussion

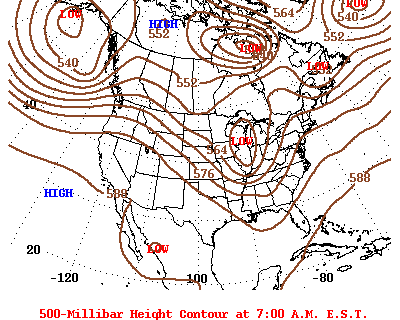
Upper-level circulation pattern and anomalies averaged for June 2012.
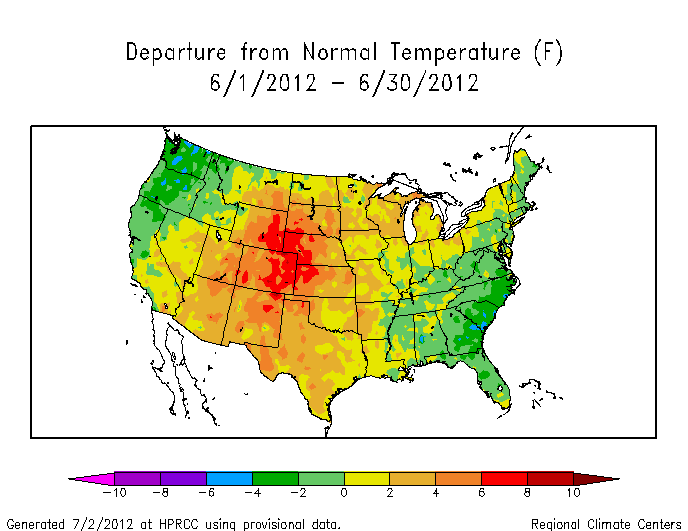
The  weather pattern over North America in June 2012 consisted of a continuation of the seasonal battle between subtropical high pressure (High, or upper-level ridge) in the south and the jet stream (polar front) in the north. Upper-level cool troughs in the jet stream flow poked at the warm High in the northwestern and northeastern corners of the United States, dragging cool fronts across the country. The primary effect of the fronts was to drop monthly average temperatures below normal in the Pacific Northwest and Southeast, although they did little to relieve the High's heat wave in the interior United States. Descending air ("subsidence") associated with the High played the dominant role in this month's weather — inhibiting precipitation from the cool fronts and stopping the formation of most convective showers that are normally triggered by afternoon heating from the sun. The subsidence also contributed to a below-normal tornado count this month, although a derecho (associated with a cool front, unstable air at jet stream level, and unusually hot and moist air at the surface ahead of the front) caused significant wind damage to a wide swath from northern Illinois to the Mid-Atlantic Coast near the end of the month. The High's abnormal dryness and blistering heat brought about a rapid expansion of drought across the country, especially from the Central Rockies to the Ohio Valley, and contributed to an active wildfire season, especially across the West. Meanwhile, the subsidence from the High weakened the steering currents for Atlantic tropical systems, resulting in the slow movement of Tropical Storm Debby (which dropped flooding rains across Florida) and keeping Hurricane Chris well out to sea.
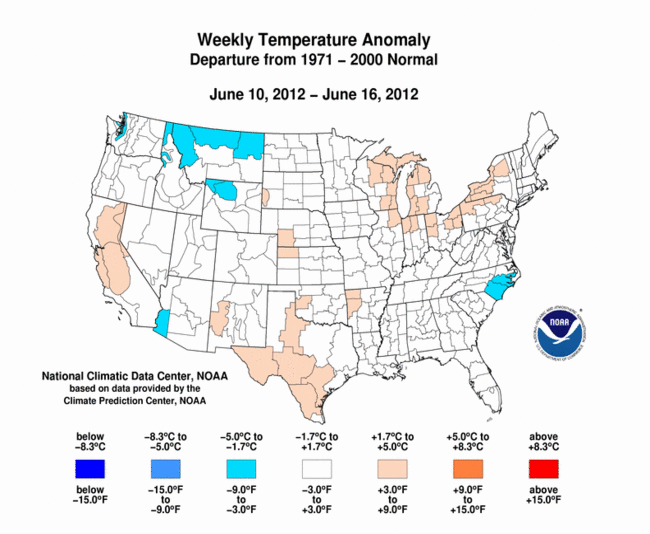
The back-and-forth battle between the High and polar front can be seen in the weekly temperature anomaly maps (weeks 1, 2, 3, 4). Early in the month, the High and its warmer-than-normal air were entrenched in the central U.S. while cooler air beneath upper-level troughs flanked it along both coasts. The battleground shifted during the second week, with the High gaining the upper hand during the third and fourth weeks, spreading east and strengthening. At the end of the month, this battleground yielded the 14th warmest June, nationally, in the 1895-2012 record and many daily and monthly temperature records. Nearly three times as many record warm highs and lows occurred than record cold highs and lows. About 3282 daily high temperature records and nearly 2000 record warm daily low temperatures were tied or broken. In comparison, about 820 record low temperatures and about 1000 record cool daily high temperatures were tied or broken. Maps of the 645 monthly record maximum temperatures and 173 all-time highest maximum temperatures reveal the centers of the record heat — one center over the Central Plains and the other over the Ohio Valley to Southeast. (These numbers are preliminary and are expected to increase as more data arrive.) The Central Plains heat was the most persistent throughout the month, with eight states from the Southwest to Northern and Central Plains ranking in the top ten warmest category — and Colorado nabbing the prize for warmest June on record. Beneath the persistent trough in the northwest, Washington State ranked in the top ten coldest category for June with a rank of seventh coolest. In spite of June 2012 ranking as the 14th warmest June for the nation, the influence of the upper troughs and their cooler temperatures over the population centers of the country earlier in the month contributed to a national Residential Energy Demand Temperature Index (REDTI) for June 2012 that was only mid-range.
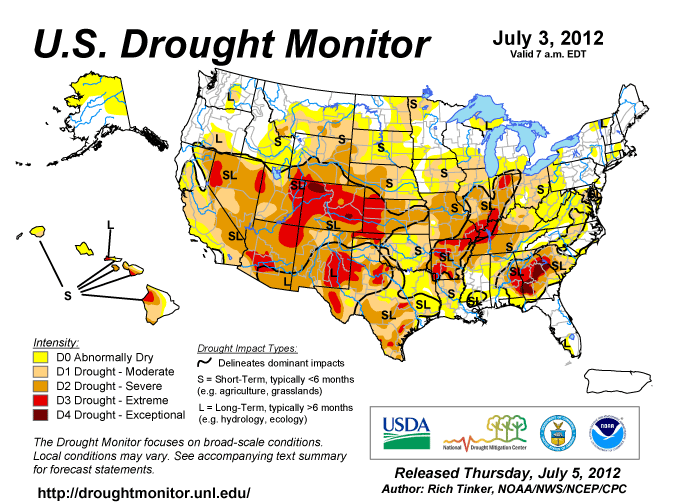
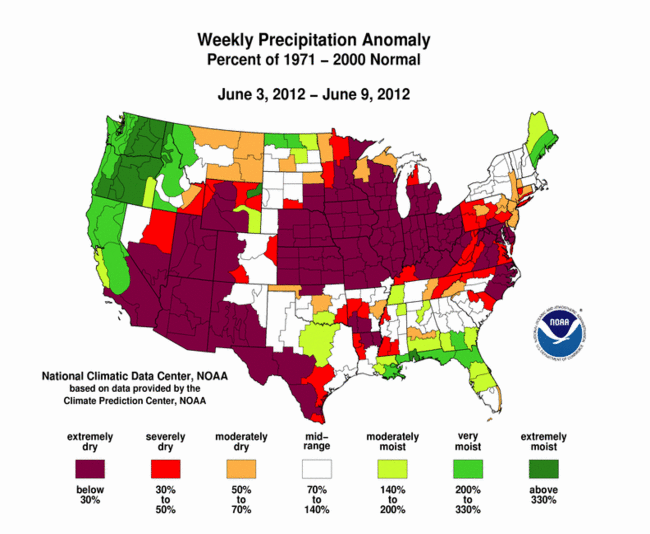
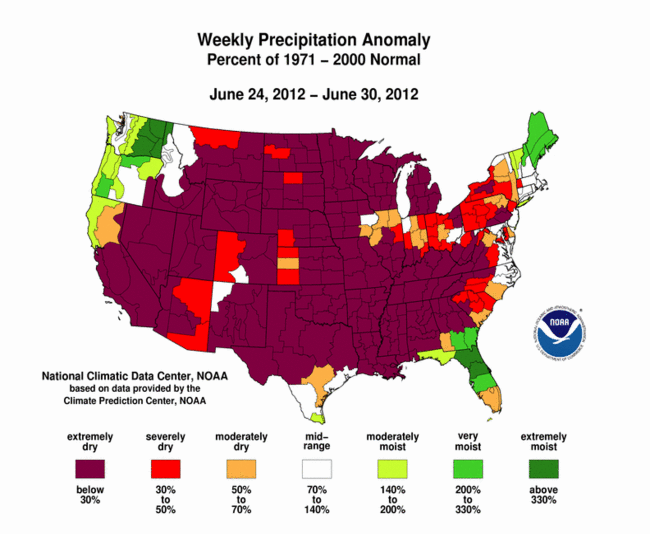
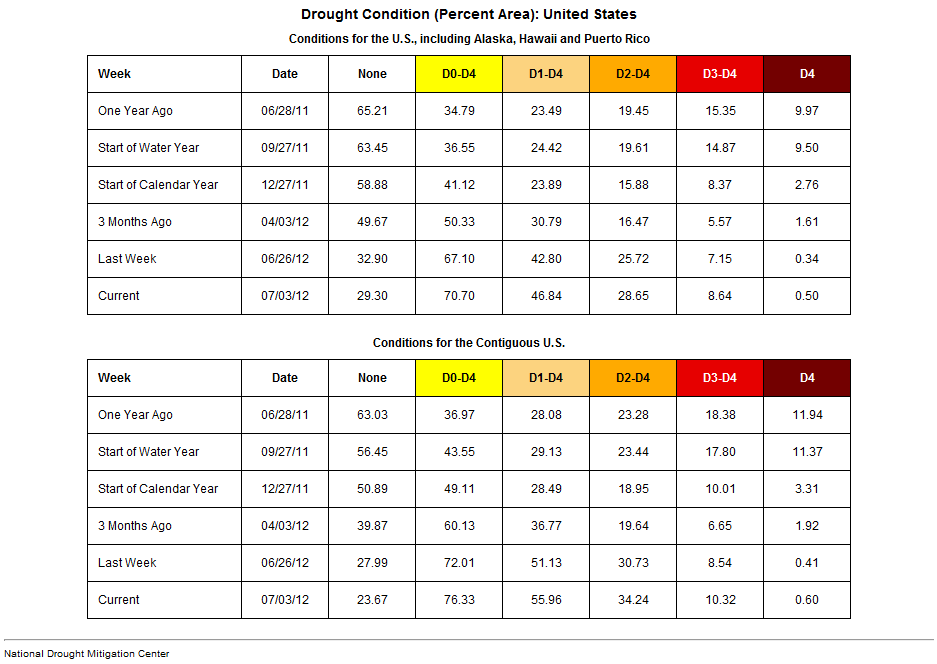
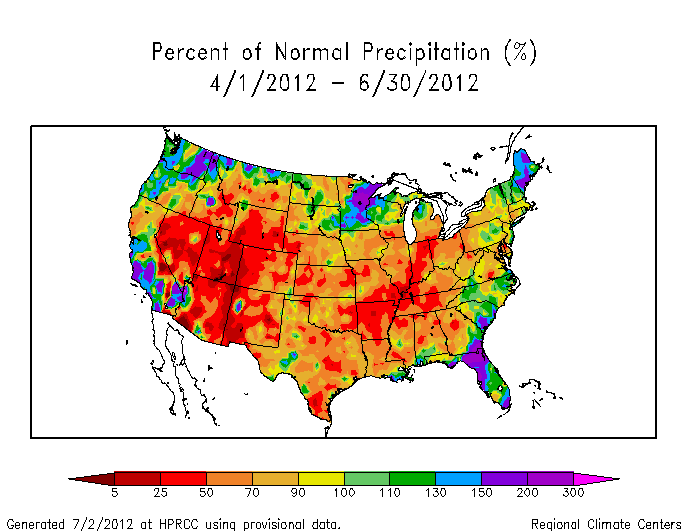
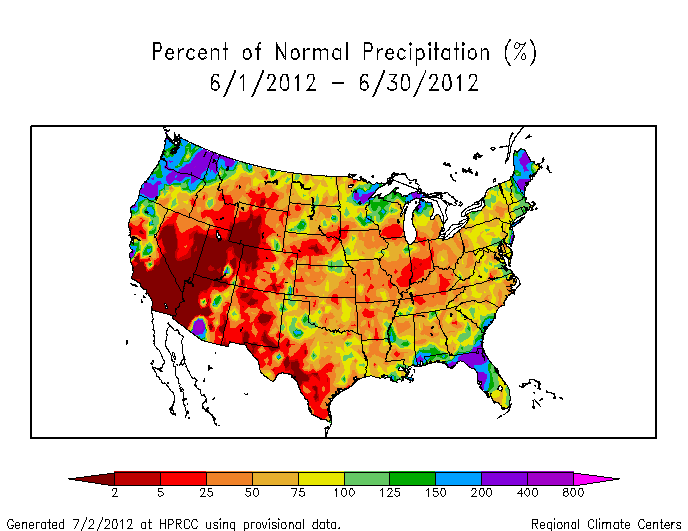
Although locally heavy rains occurred in some weeks along some of the fronts in parts of the Plains, Midwest, and Southeast, the High dominated (weeks 1, 2, 3, 4) with the monthly precipitation below normal for most of the country from the Southwest to Central Rockies — eastward to the Atlantic Coast. Three corners of the country were wetter than normal with the coastal troughs — Florida had the wettest June on record, Washington State ranked second wettest, and Oregon and Maine ranked in the top ten wettest category. Over half (26) of the states in between ranked in the driest one-third category of the historical record, with the nation overall having the tenth driest June. There were two epicenters of dryness — one in the Ohio Valley where five states ranked in the top ten driest category, and the other in the Intermountain Basin to Central Plains where six states were top ten driest, including Wyoming which had the driest June on record. There was considerable overlap between these dry centers and the centers of record heat. The combination of abnormally dry conditions and high evapotranspiration due to excessive heat resulted in an extensive area of severe to extreme short-term drought. Consequently, long-term drought conditions expanded in the Midwest, Great Plains, and West, but shrank in the Southeast where Tropical Storm Debby late in the month, combined with frontal rains early in the month, washed away drought in Florida and southeast Georgia. According to the July 3rd U.S. Drought Monitor, moderate to exceptional drought grew to cover 56 percent of the contiguous United States, an increase of 19 percent compared to last month.
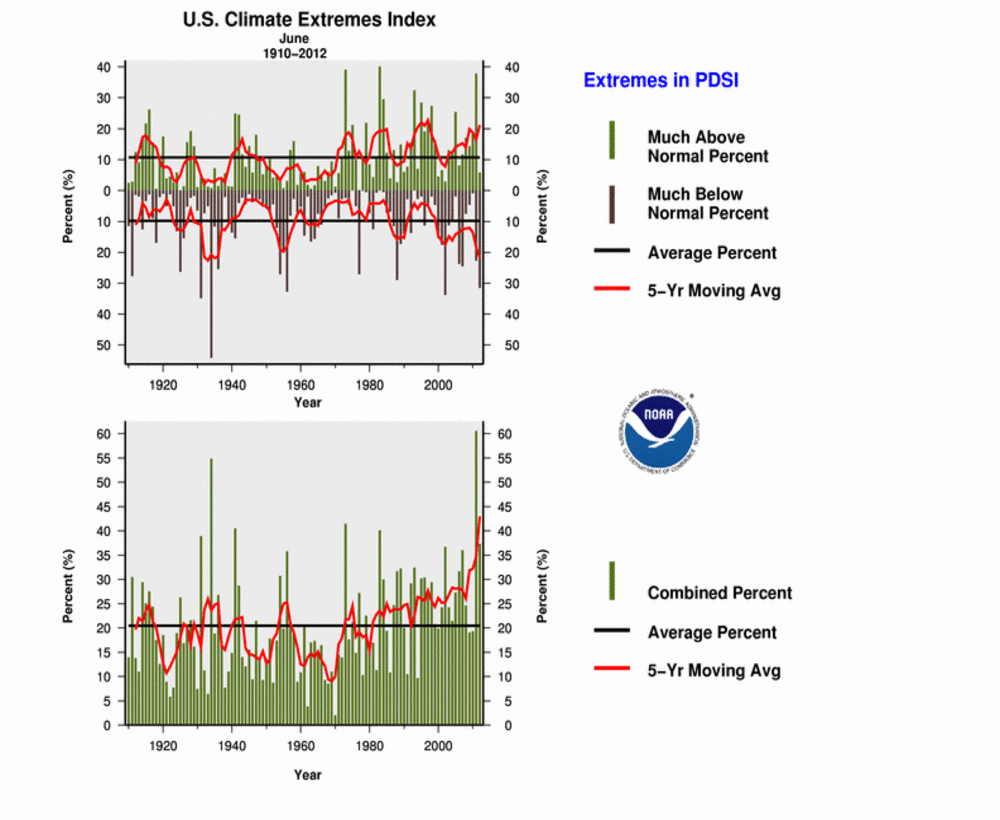
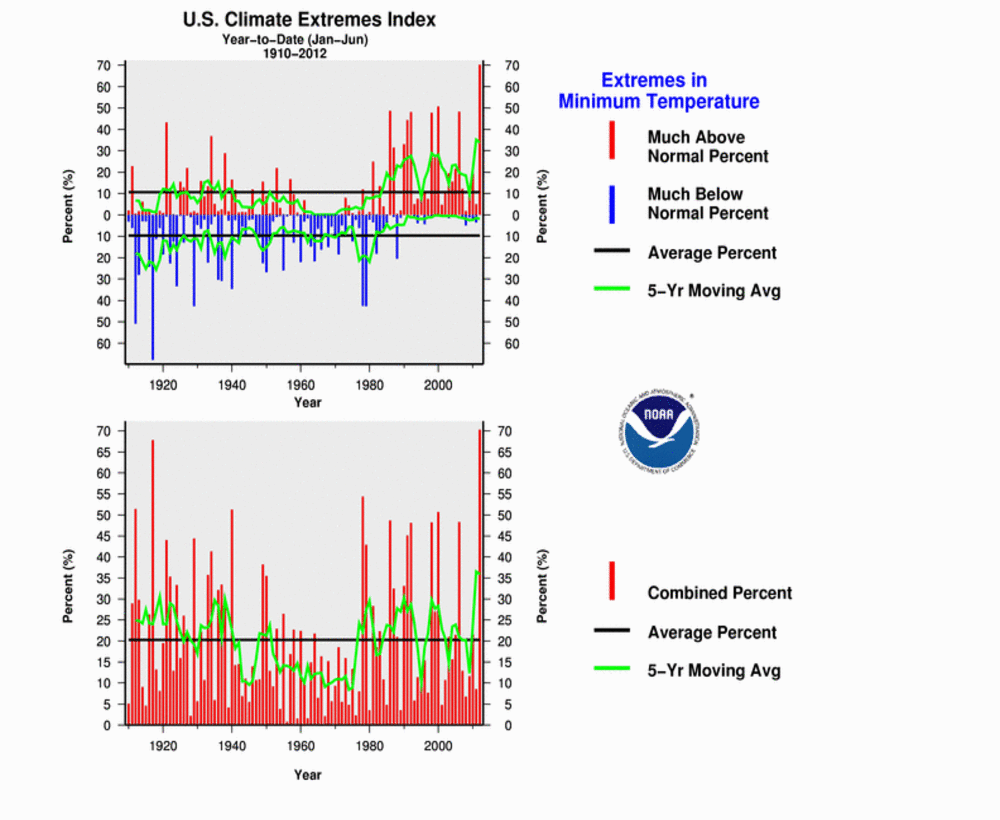
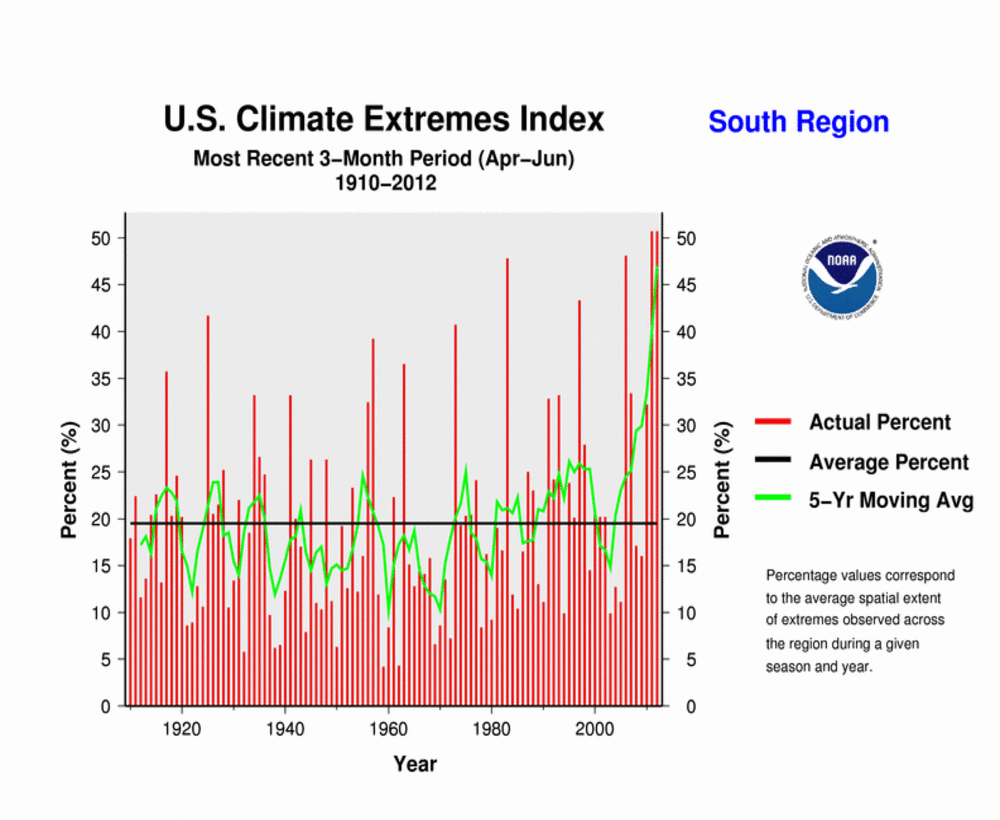
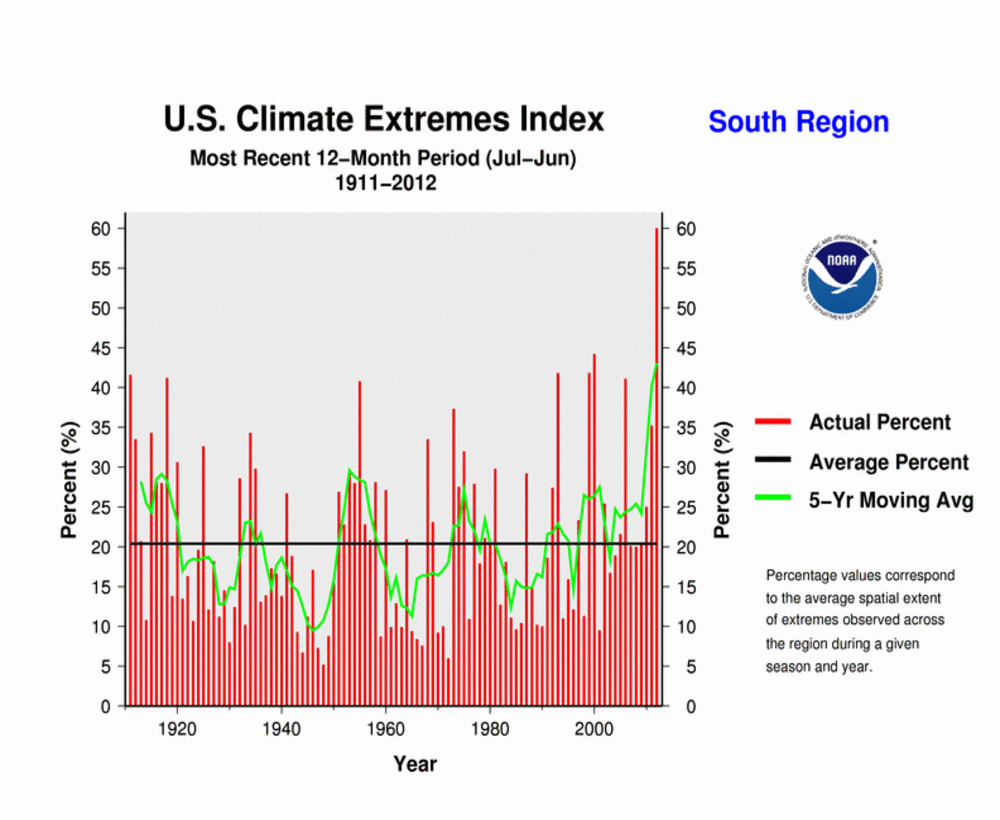
When averaged together, the mixture of temperature and precipitation extremes gave the U.S. (as noted above) the 14th warmest and tenth driest June in the 118-year record. Averaging extremes tends to cancel them out. But when extremes are combined cumulatively, like in the U.S. Climate Extremes Index (CEI), they may tell a different story. The large spatial extent of unusually warm highs (13th largest) and very dry conditions (fifth largest) gave the U.S. its 20th largest CEI for June. The combination of persistent and unusual warmth (in maximum and minimum temperatures) and drought over the last several months, however, contributed to the highest national CEI for the year-to-date (January-June) and last 12 months (July-June), and the fourth highest CEI for the last three months (April-June), for the nation, and the highest regional CEI for the South region for the last three months, year-to-date, and last 12 months.
Subtropical highs, and cold fronts and low pressure systems moving in the storm track flow, are influenced by the broadscale atmospheric circulation. Five such large-scale atmospheric circulation drivers were potentially influential during June:
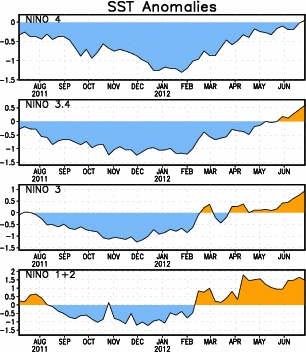
- Ocean temperatures and atmospheric circulation anomalies indicated that the equatorial Pacific continued in an ENSO-neutral state during June. While in a neutral state, ENSO normally is not a player in the month's weather. Historical data can be analyzed to show typical temperature and precipitation patterns associated with the ENSO episodes. For an El Niño, the typical April-June temperature and precipitation anomaly patterns do not match the temperature and precipitation anomaly patterns for April-June 2012. The typical April-June temperature and precipitation anomaly patterns for La Niña have a hint of a resemblance (cold Northwest, warm Great Plains, Ohio Valley, and Southeast; dry Southwest to Central Plains, Ohio Valley, and Northeast) to the April-June 2012 temperature and precipitation anomaly patterns, possibly reflecting the last vestiges of La Niña early in the period. As noted in the July 2nd NOAA ENSO discussion, "the atmospheric circulation over the tropical Pacific reflects cool-to-neutral ENSO conditions".
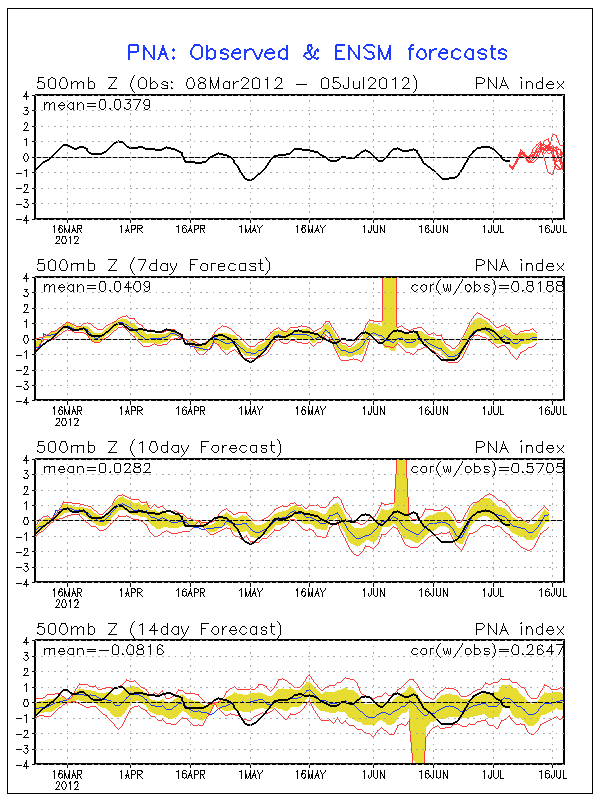
- The Pacific/North American (PNA) pattern was neutral to slightly positive at the beginning of the month, dipped negative in the middle of June, then was positive again about the last week of the month. The temperature teleconnection maps for this time of year (between April and July) show a weakening relationship between temperature and the PNA, with a positive PNA associated with warmer-than-normal temperatures in the Northwest and cooler-than-normal temperatures in the Southern Plains and Southeast, and a negative PNA associated with the opposite pattern (cool in the Northwest and warm in the Southern Plains and Southeast). The precipitation patterns are weakly correlated this time of year (between April and July on the maps), but show some hint of drier-than-normal conditions from the Great Basin to Central Plains and wetter-than-normal conditions in the Upper Mississippi Valley with a negative PNA, and vice versa for a positive PNA. As seen in the
 daily upper atmospheric maps for June 2012, the trough-ridge pattern shifted during the month, similar to the shift in the PNA pattern. A trough set up in the eastern U.S. during the first third of the month, with associated below-normal temperatures along the east coast that week, at about the same time the PNA was positive.
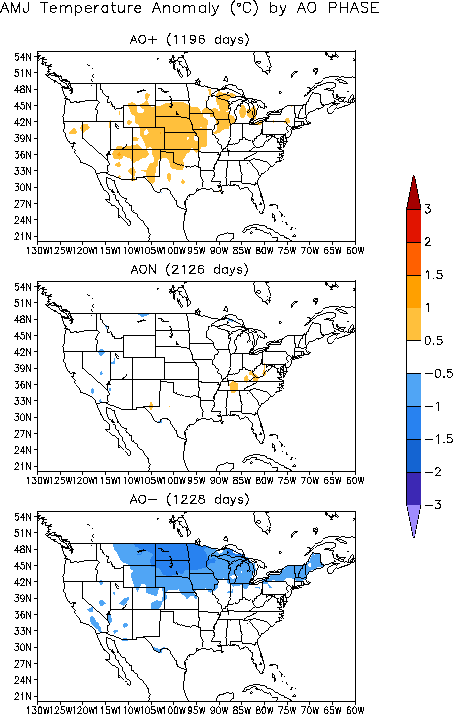
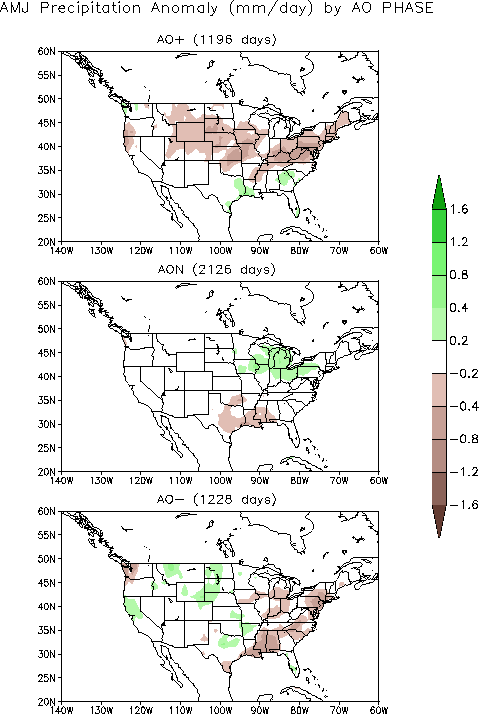
 - The Arctic Oscillation (AO) pattern was negative for the first half of June then fluctuated around neutral (zero) for the rest of the month. A negative AO this time of year (April-June) is typically associated with cooler-than-normal temperatures across the northern tier states east of the Rockies and dryness from the Gulf Coast to Ohio Valley, then to the East Coast, and wet conditions in the Plains and parts of the West. The April-June averaged upper-level circulation anomalies for a negative AO consist of a below-normal pattern over the northeastern fourth of the U.S. into the North Atlantic, and above-normal pattern over the Arctic. The April-June 2012 upper-level circulation had an above-normal pattern over much of the country.
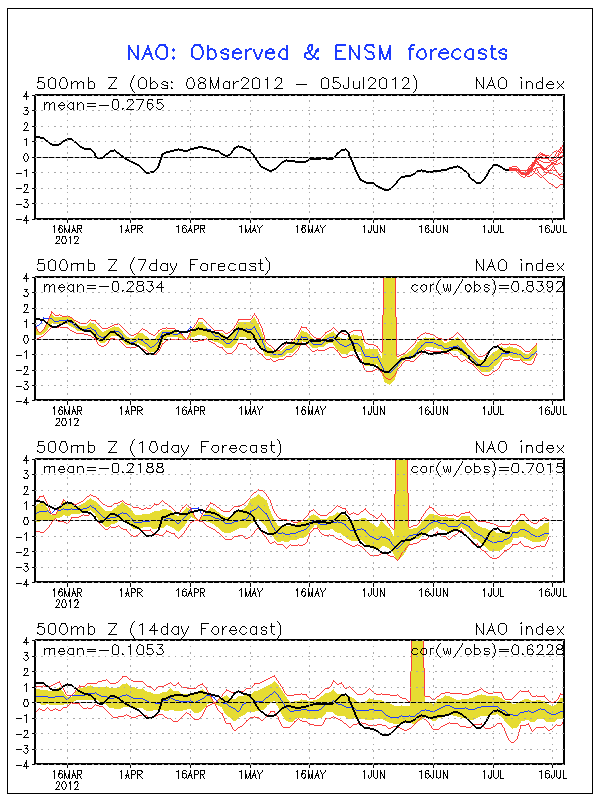
- The North Atlantic Oscillation (NAO) pattern was negative throughout the month. A negative NAO during this time of year (between April and July on the teleconnection maps) is typically associated with wetter-than-normal conditions in the Central Plains extending into the Midwest. In the Southeast and Gulf Coast, the relationship is in a period of transition at this time of year. The temperature correlations indicate a transition to above-normal temperatures in the Southern Plains to Southeast and below-normal in the Northern Rockies to Northern Plains.
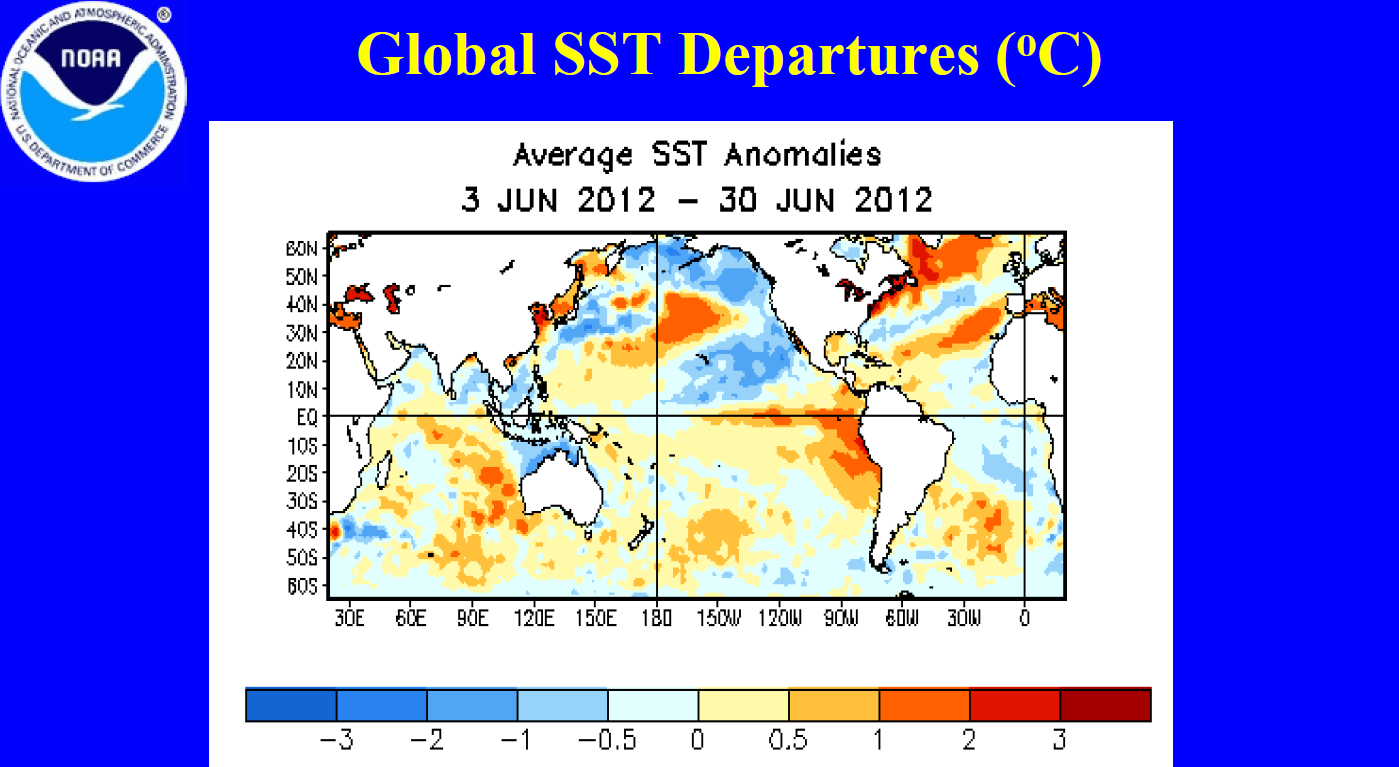
- The East Pacific-North Pacific (EP-NP) pattern relates sea surface temperature (SST) and upper-level circulation patterns over the eastern and northern Pacific to temperature, precipitation, and circulation anomalies downstream over North America. The EP-NP index has recently been negative, the June 2012 SST pattern was cooler than normal over the northeast Pacific, and the June upper-level circulation anomalies were below normal over the northeast Pacific. A negative EP-NP pattern (below-normal upper-level heights in the northeast Pacific) during this time of year (between April and July on the teleconnection maps) is typically associated with above-normal upper-level anomalies (upper-level ridge) over the central U.S., warmer-than-normal temperatures over the central to eastern U.S., and drier-than-normal conditions over the central U.S. (although the correlations are weak for precipitation).
 |
 |

The upper-level circulation anomalies for both June 2012 and April-June 2012 over the northeast Pacific and downstream over North America are generally consistent with the EP-NP pattern. The above-normal heights over the central U.S. are shifted north reflecting a stronger High, with below-normal heights over western North America coinciding with below-normal sea surface temperatures in the northeastern North Pacific. The pattern of observed temperature anomalies for June 2012 and the last three months (April-June) corresponds to the negative phase of the EP-NP across most of the country, although some weekly variation may be related to the PNA. The June 2012 and April-June precipitation patterns also correspond weakly to a negative EP-NP index where the correlations exist. There is some hint of waning La Niña influence in the three-month temperature and precipitation anomaly maps. As noted above, some of the indices were near neutral values for much of the month. When the atmospheric circulation drivers are neutral or in a state of transition, their influence becomes difficult to trace and can be overwhelmed by other competing forces, including random fluctuations in the atmosphere.