Note: This Synoptic Discussion describes recent weather events and climate anomalies in relation to the phenomena that cause the weather. These phenomena include the jet stream, fronts and low pressure systems that bring precipitation, high pressure systems that bring dry weather, and the mechanisms which control these features — such as El Niño, La Niña, and other oceanic and atmospheric drivers (PNA, NAO, AO, and others). The report may contain more technical language than other components of the State of the Climate series.
Overview
Key Drivers
- Month
- El Niño
- Oscillating West Pacific Oscillation (WPO)
- Oscillating East Pacific Oscillation (EPO)
-
March 1-16
- Positive WPO
- Positive EPO
- Negative Arctic Oscillation (AO)
-
March 17-23
- Negative WPO
- Negative EPO
-
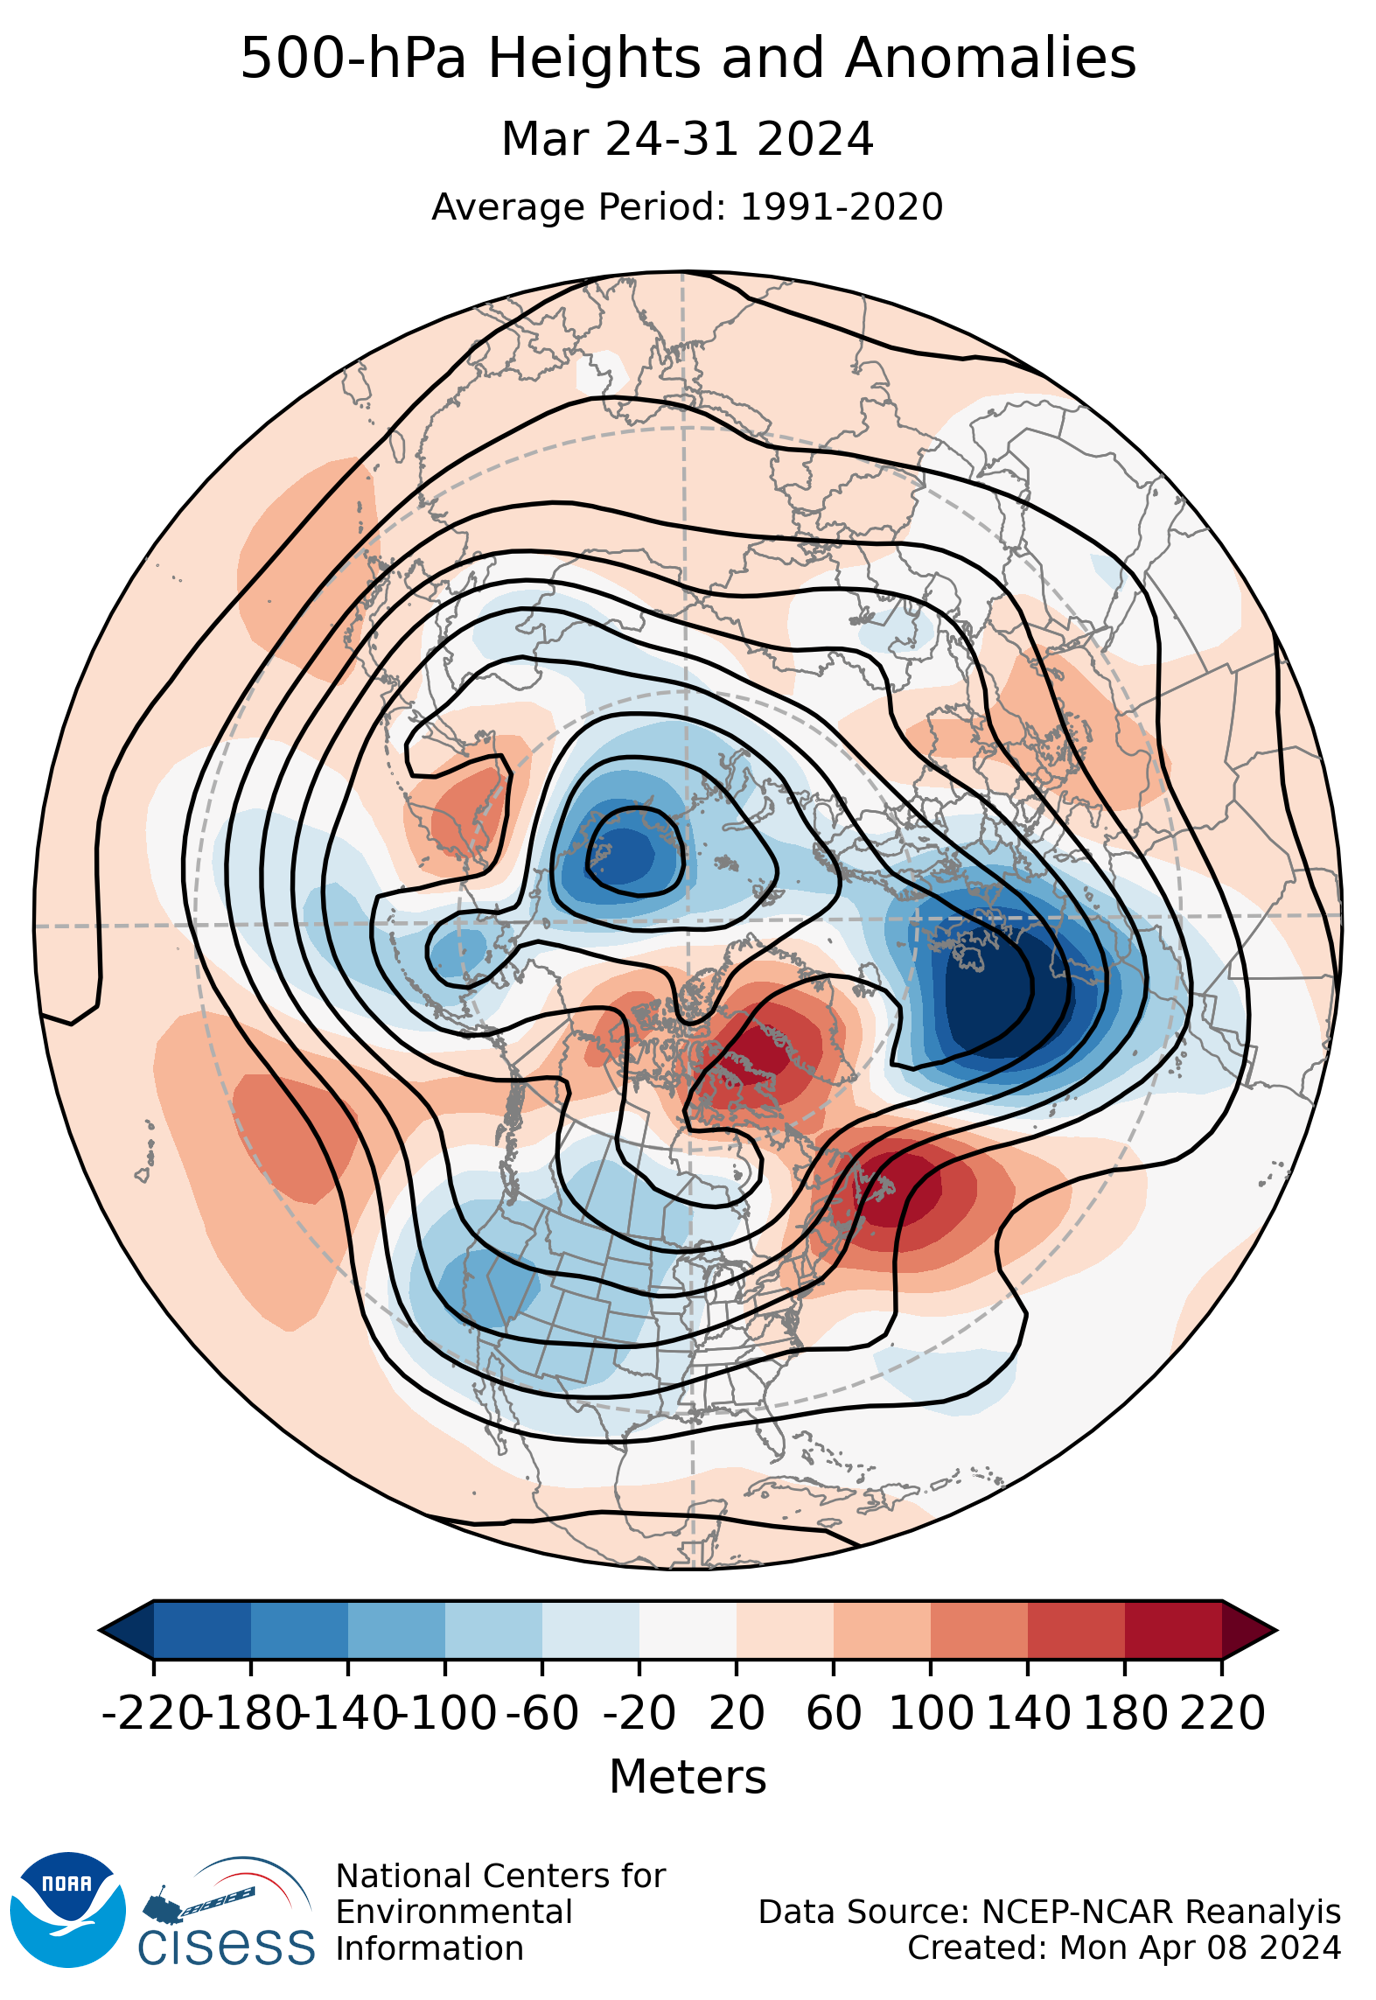
March 24-31
- Negative North Atlantic Oscillation (NAO)
- Negative AO
- Oscillating EPO
Summary
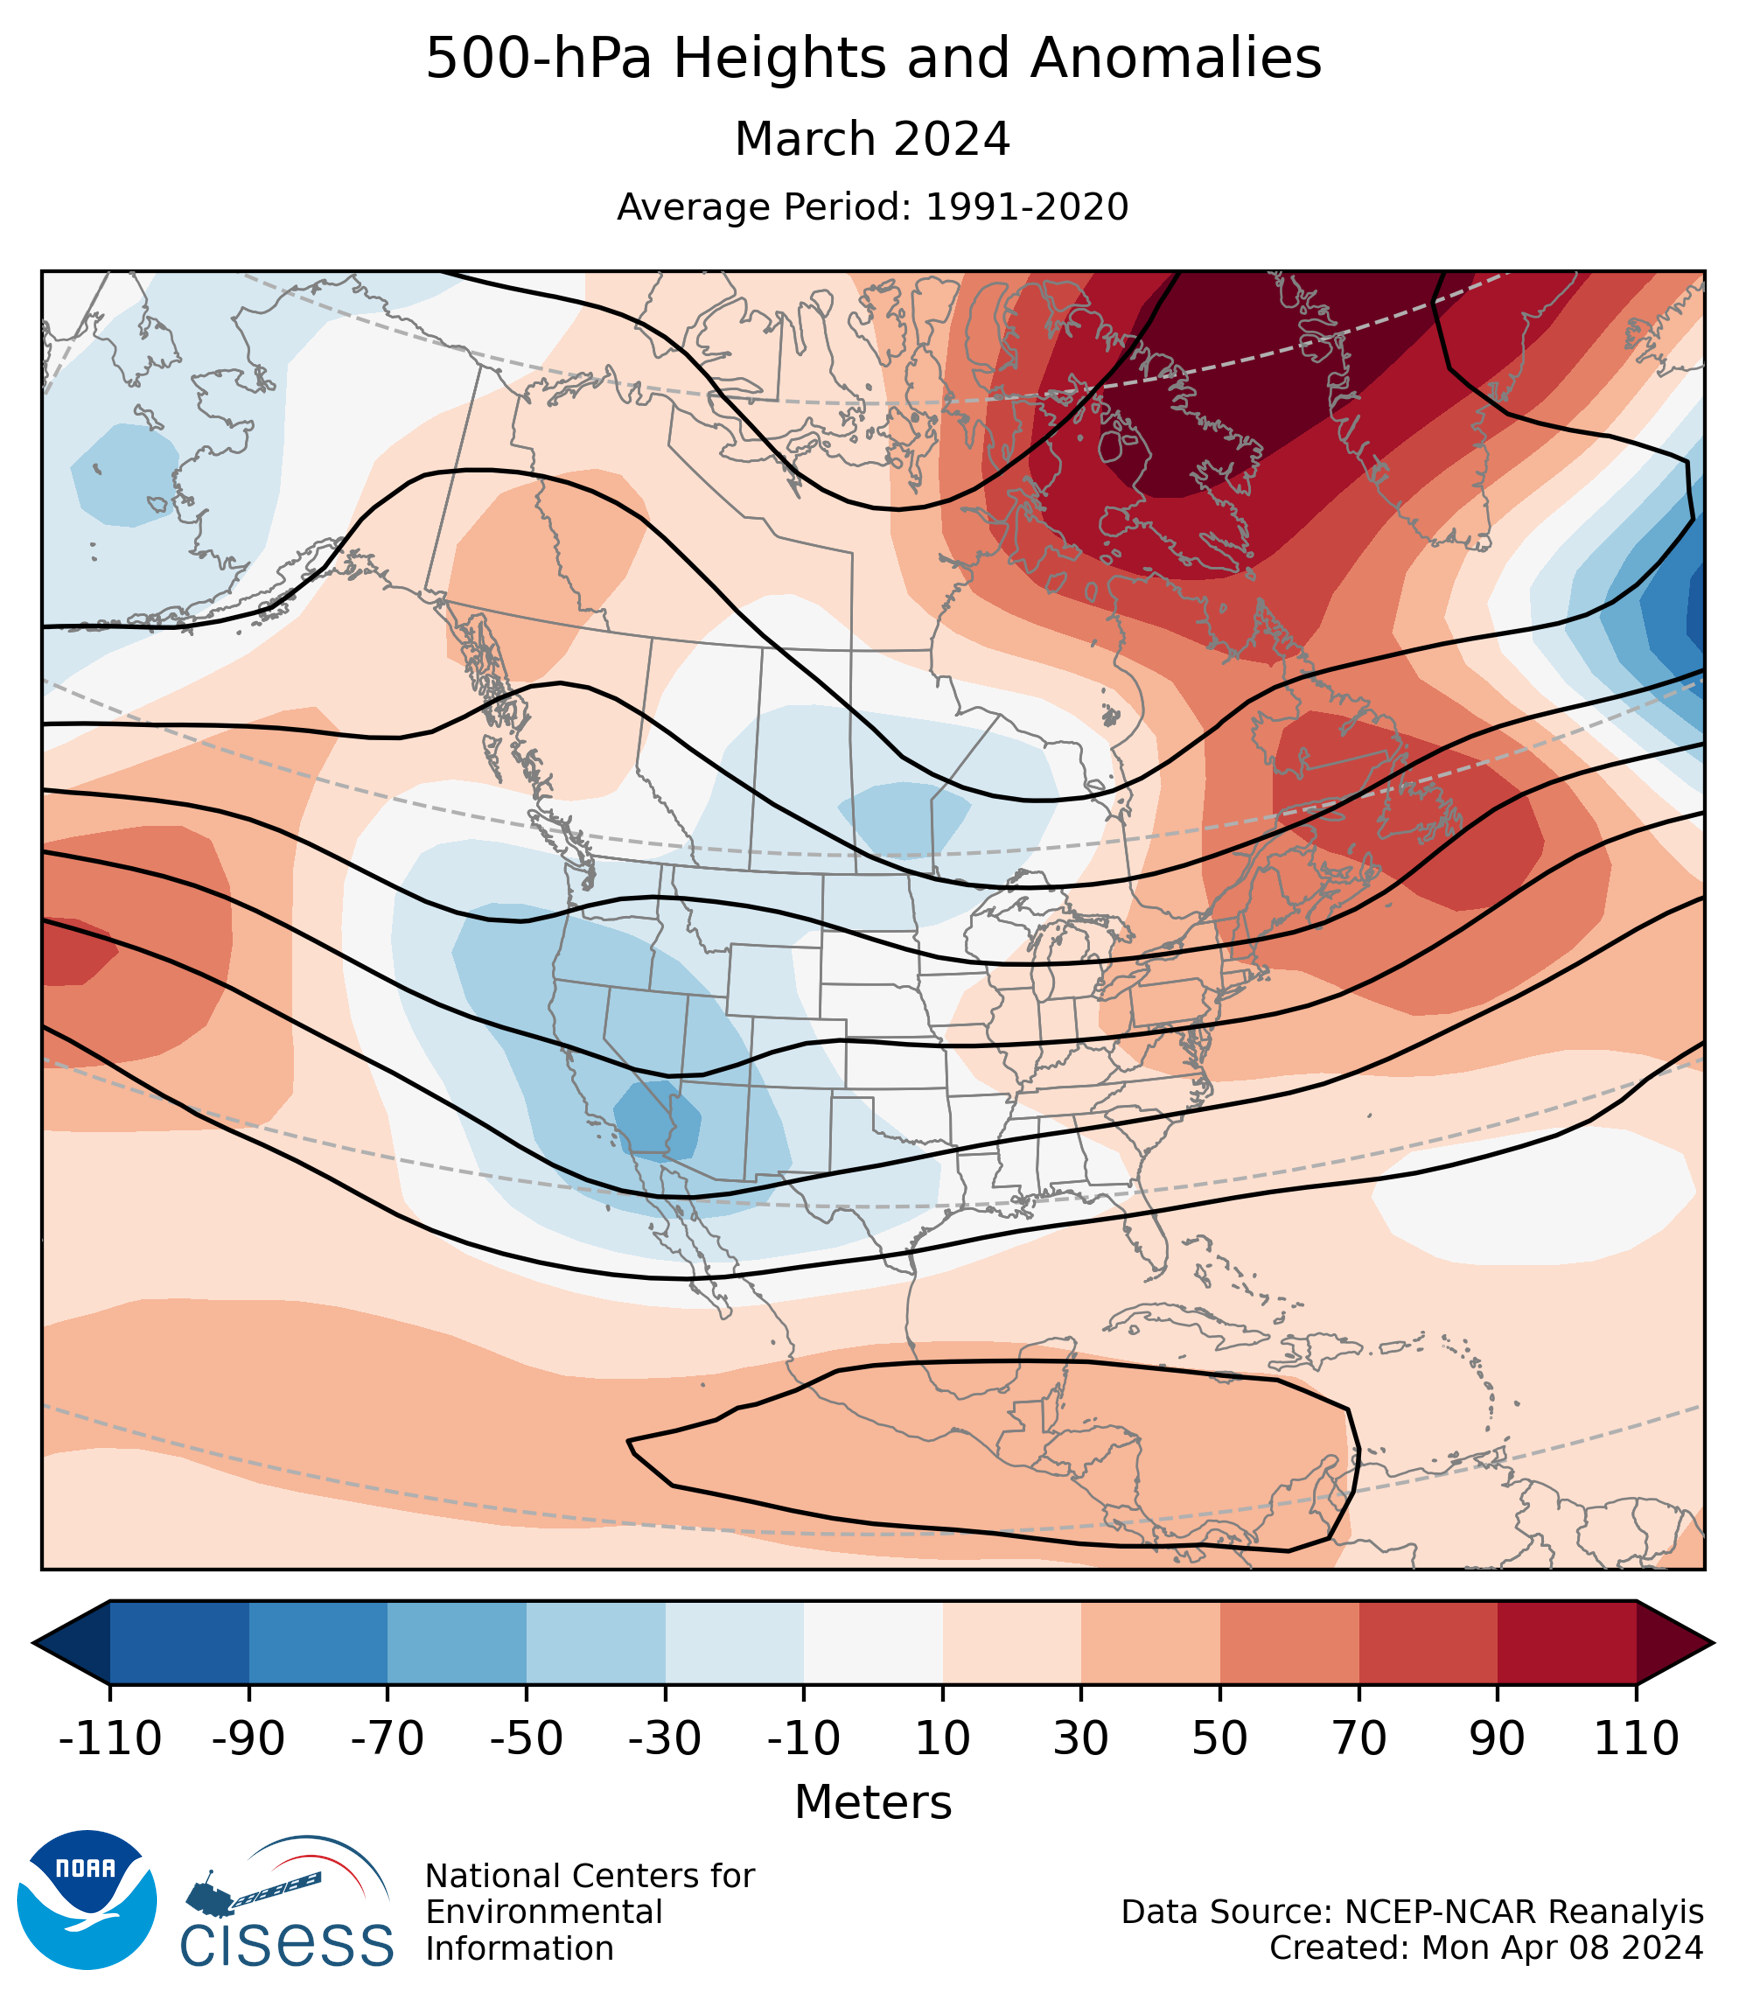
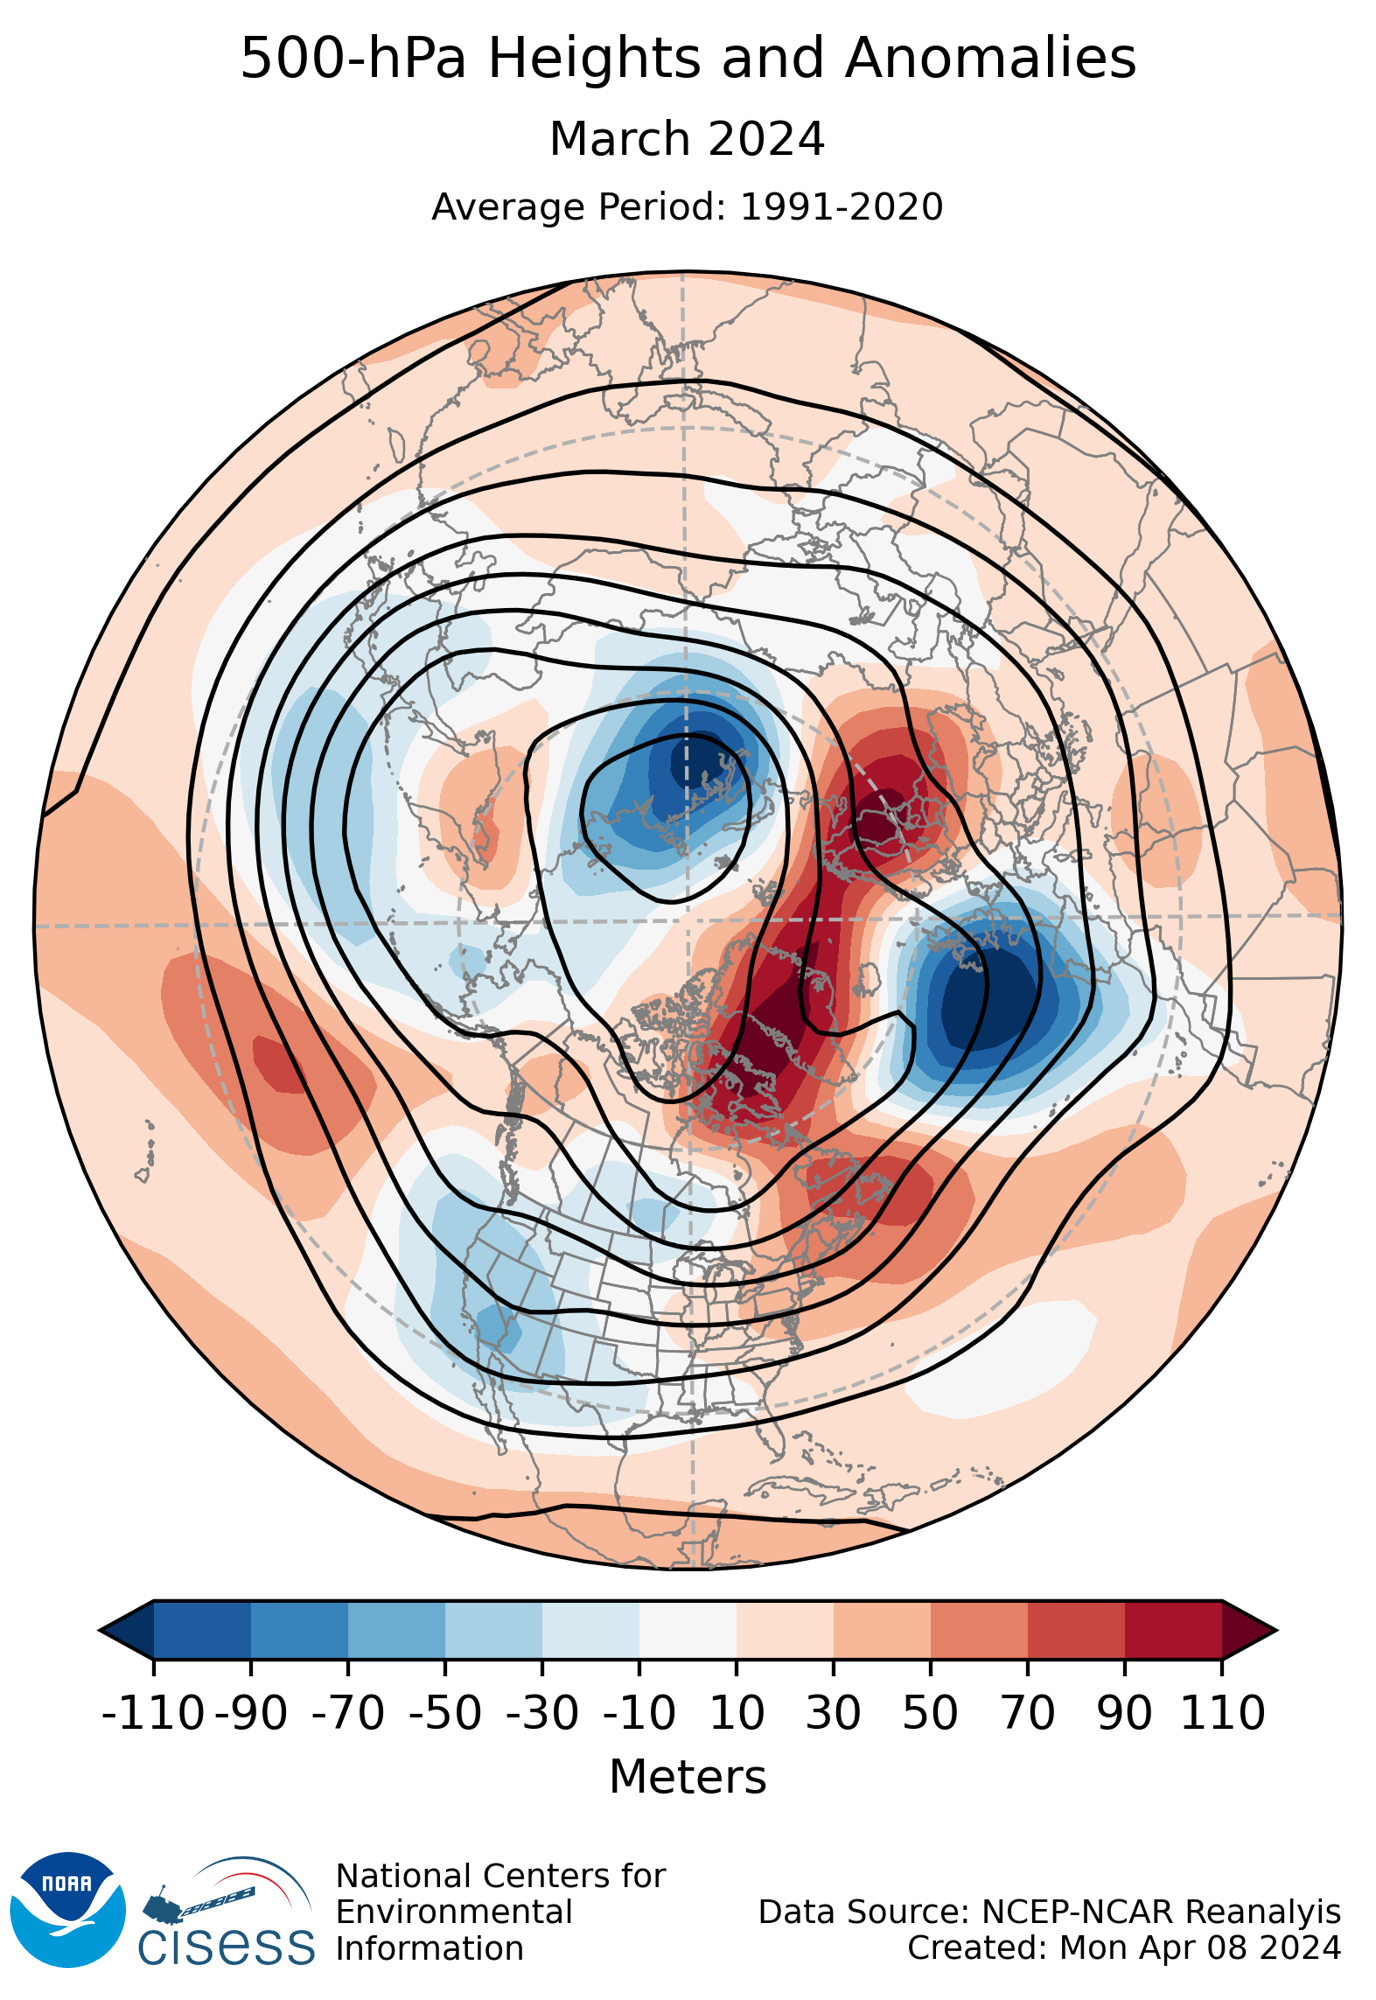
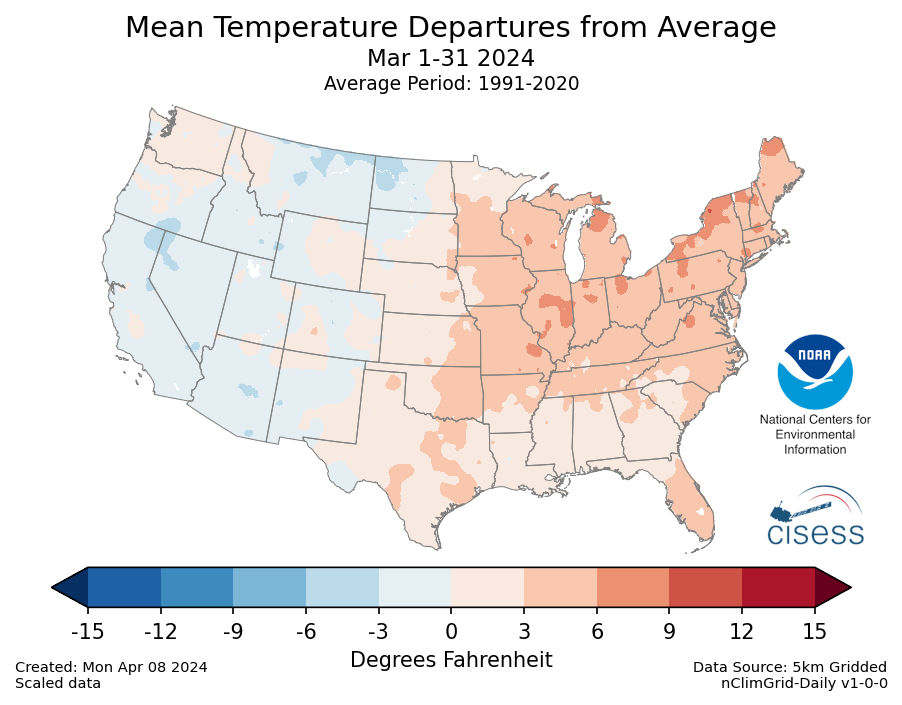
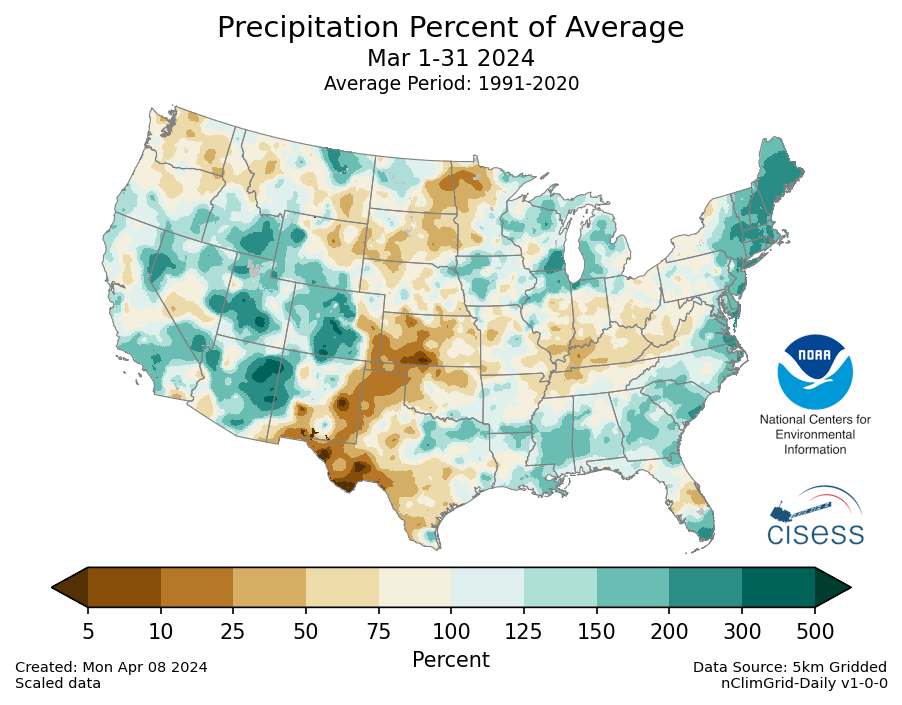
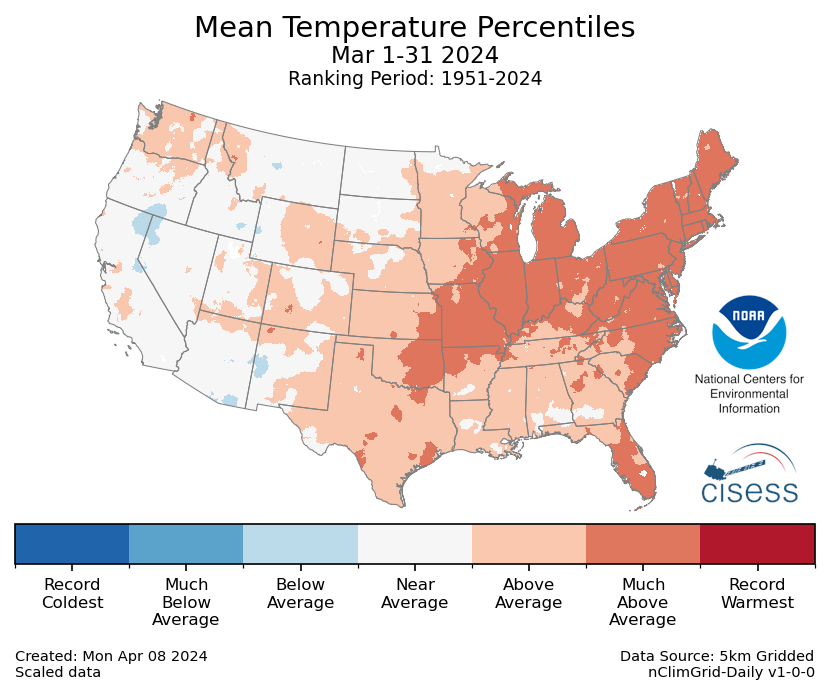
The North American circulation at the beginning of the month was characterized by strong ridging across the eastern half of the U.S., with troughing across the western half of the country. The ridging over the eastern U.S. returned at the end of the month. This led to generally warmer conditions during March across the eastern U.S. extending through the central Plains. During the middle of the month, the pattern was generally flipped with trouging over the eastern U.S. and ridging across the West. Overall, the month of March saw cooler conditions across the western U.S. along with the warmer conditions over the rest of the country. There were also drier conditions across the southern Plains during March, whereas the East Coast and western U.S. saw higher than normal precipitation totals.
Submonthly Evolution
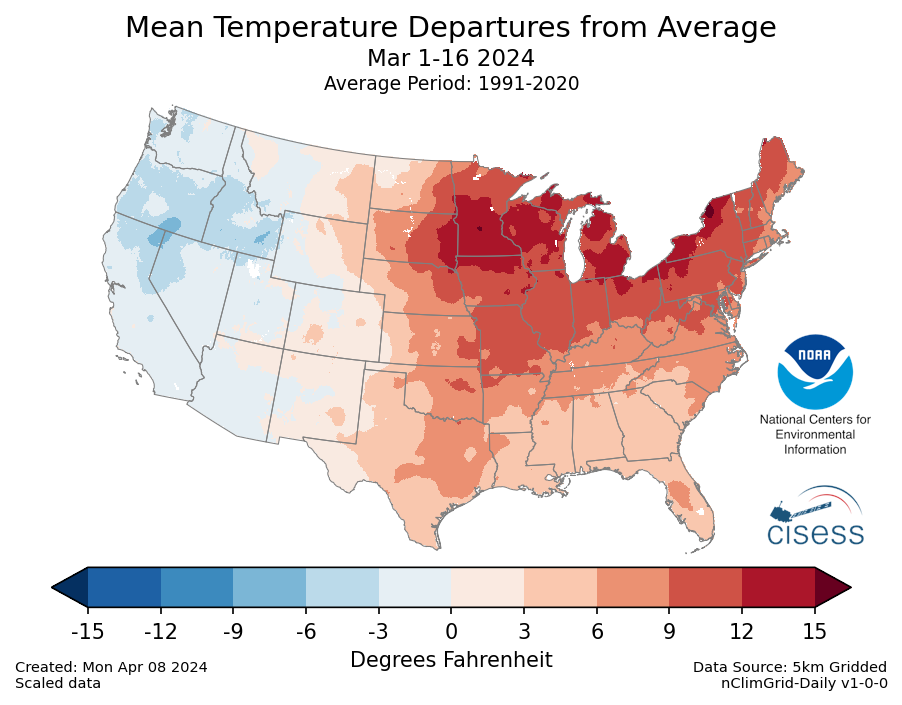
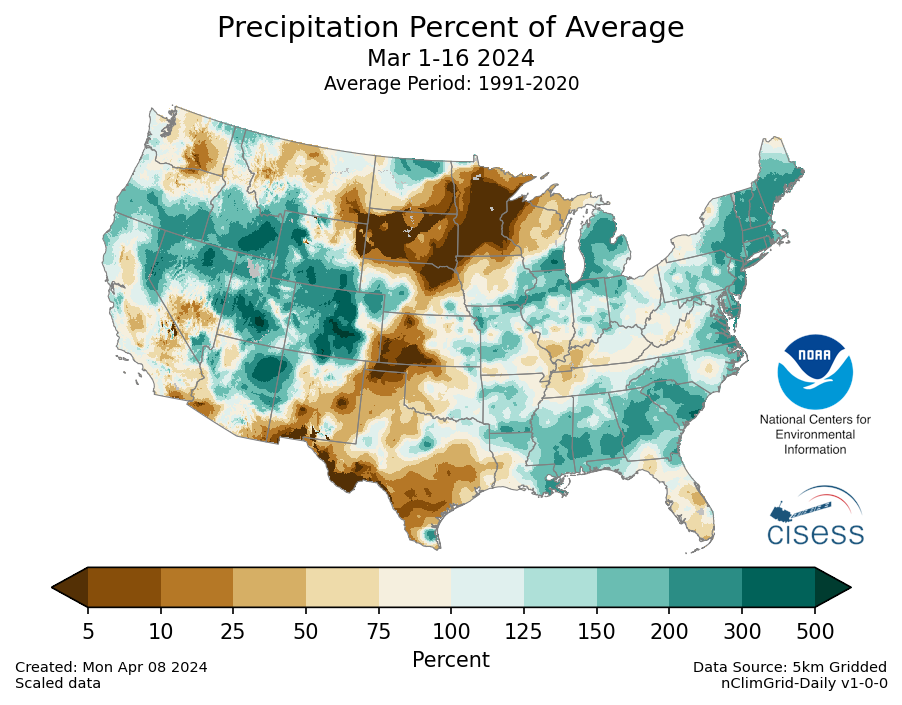
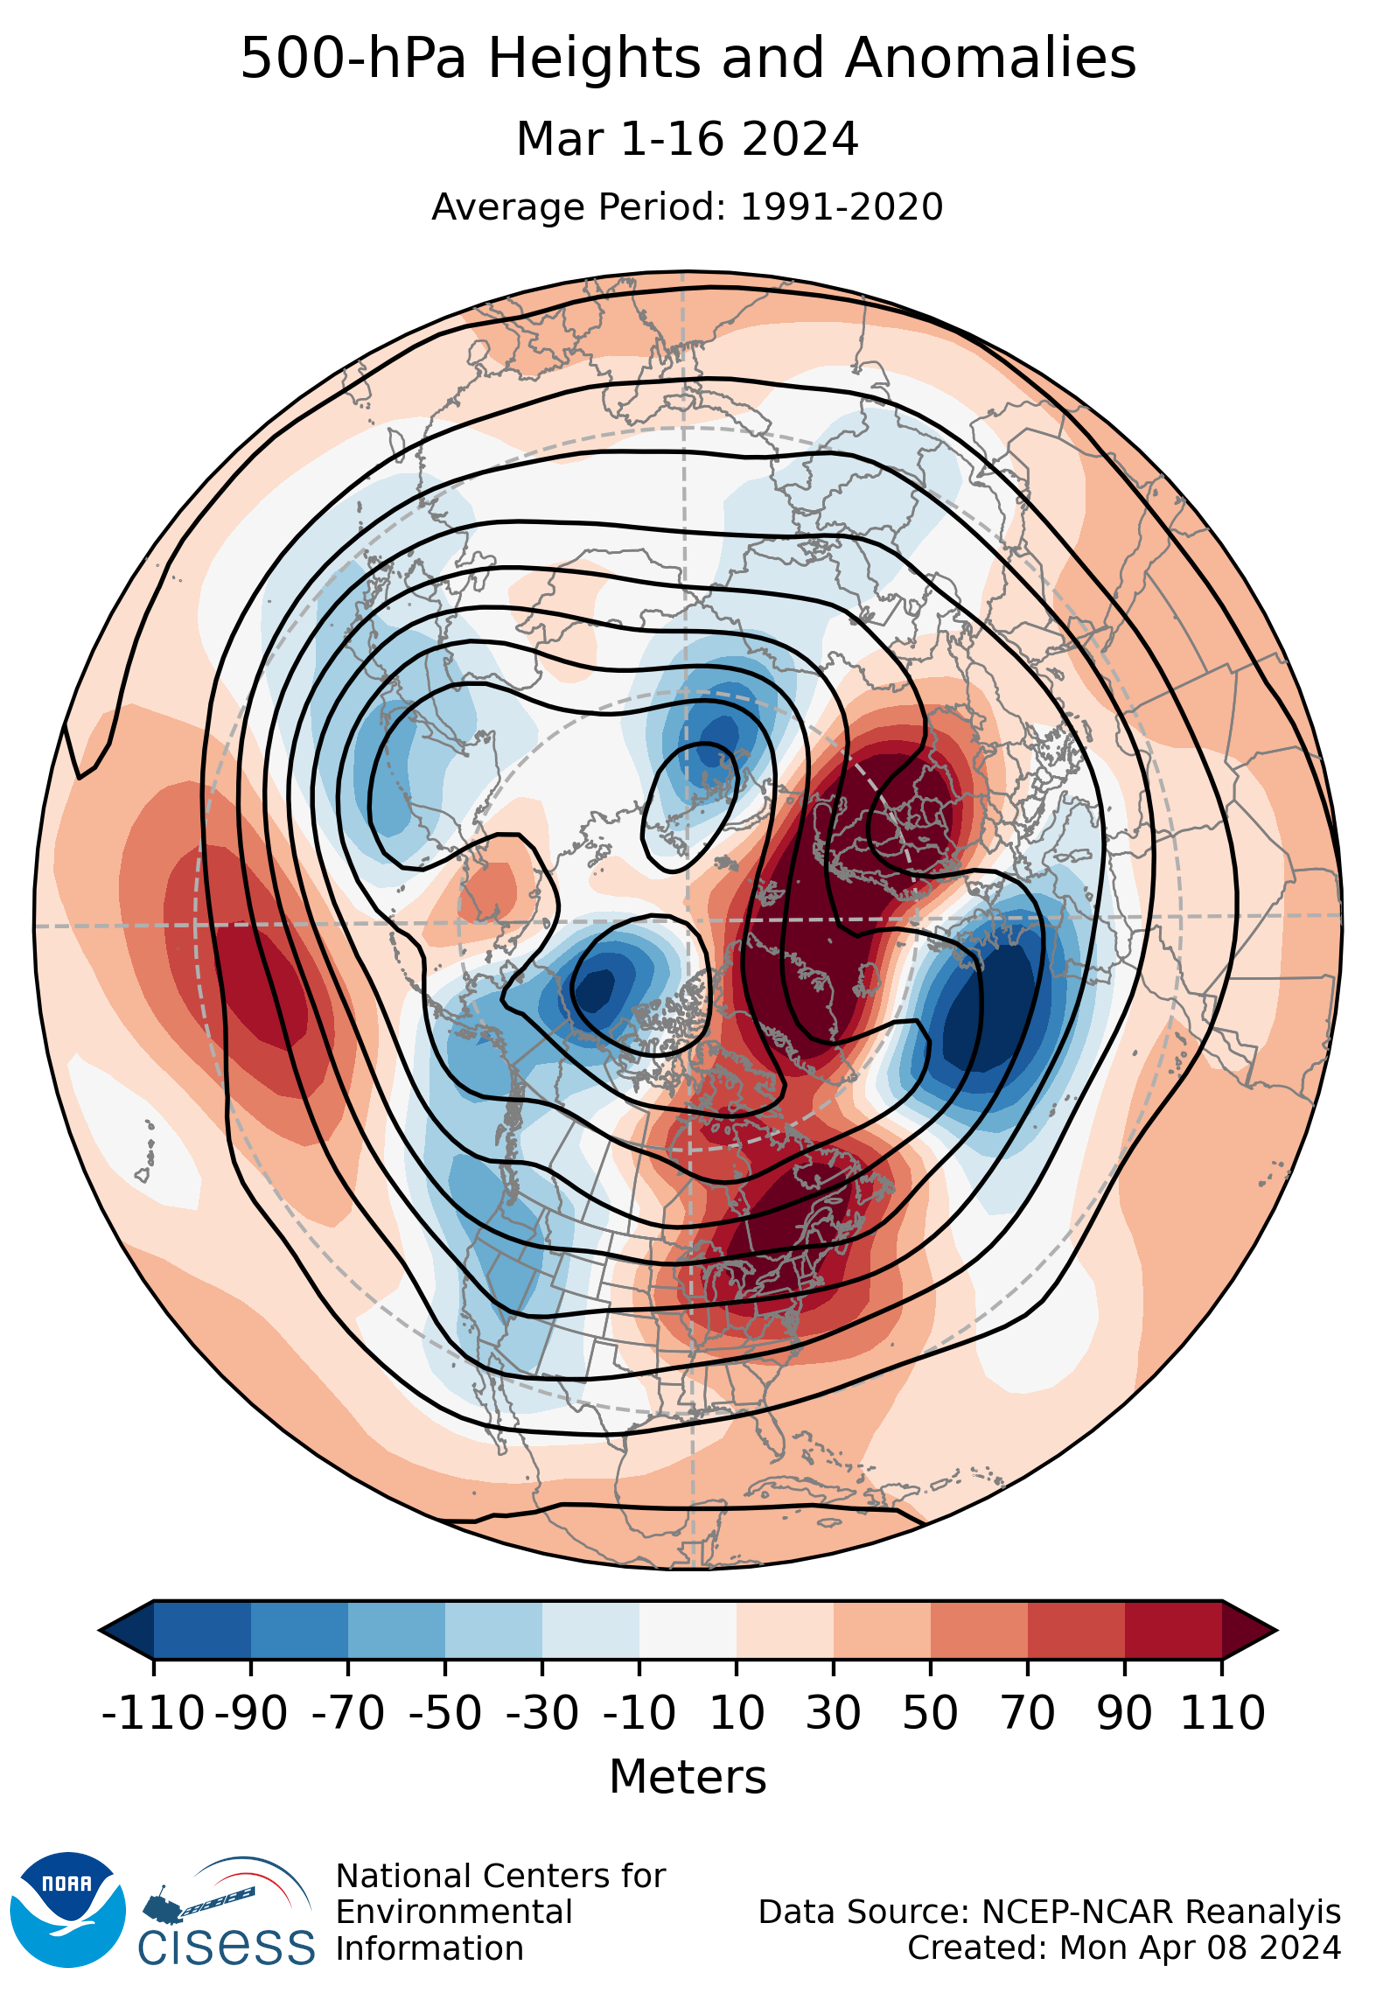
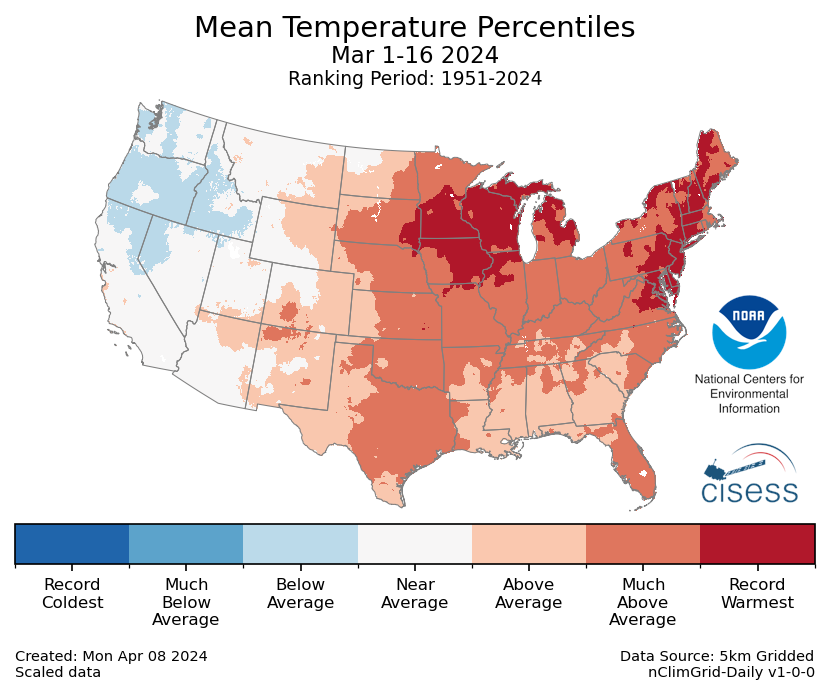
March 1-16
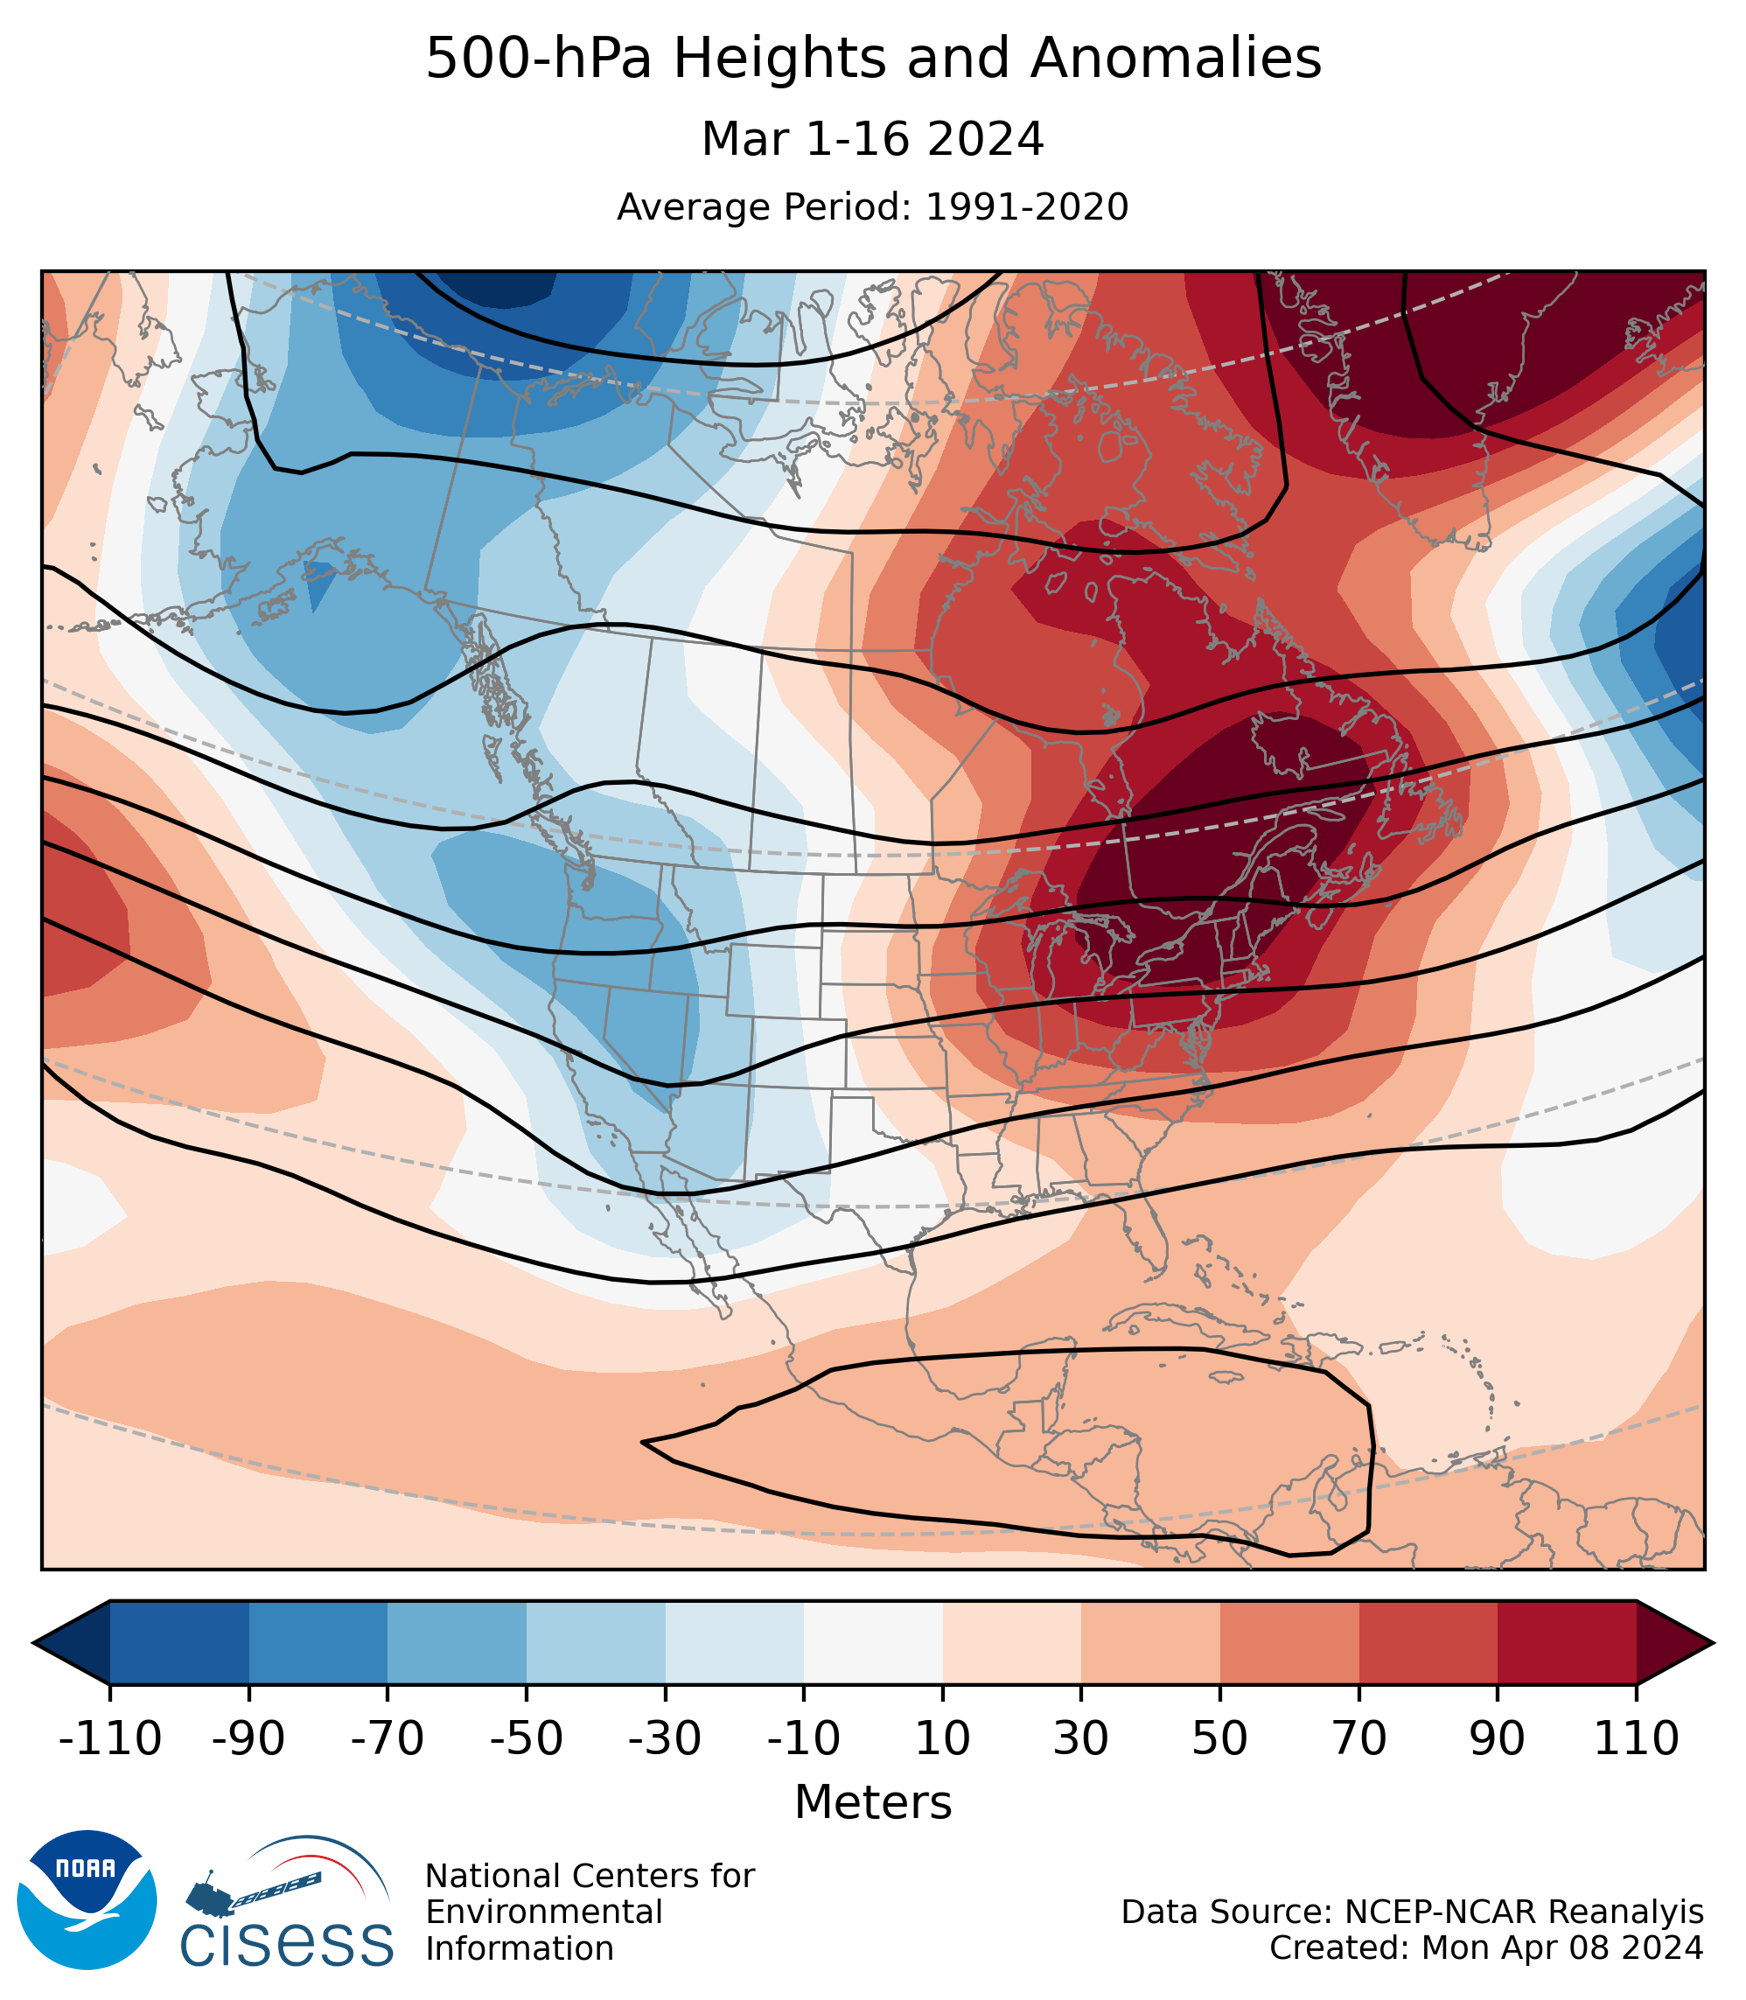
During the first two weeks of March, there was a strong ridge located over much of the eastern U.S. that was centered over southeastern Canada. As a result, there were unusually warm temperatures over much of the eastern U.S. During this period the WPO and EPO were both positive, and both a positive WPO and EPO are typically associated with warmer than normal conditions in the eastern U.S. during March. Drier than normal conditions were seen across the Great Plains during the early part of March, with enhanced precipitation across the East Coast and the Rocky Mountains.
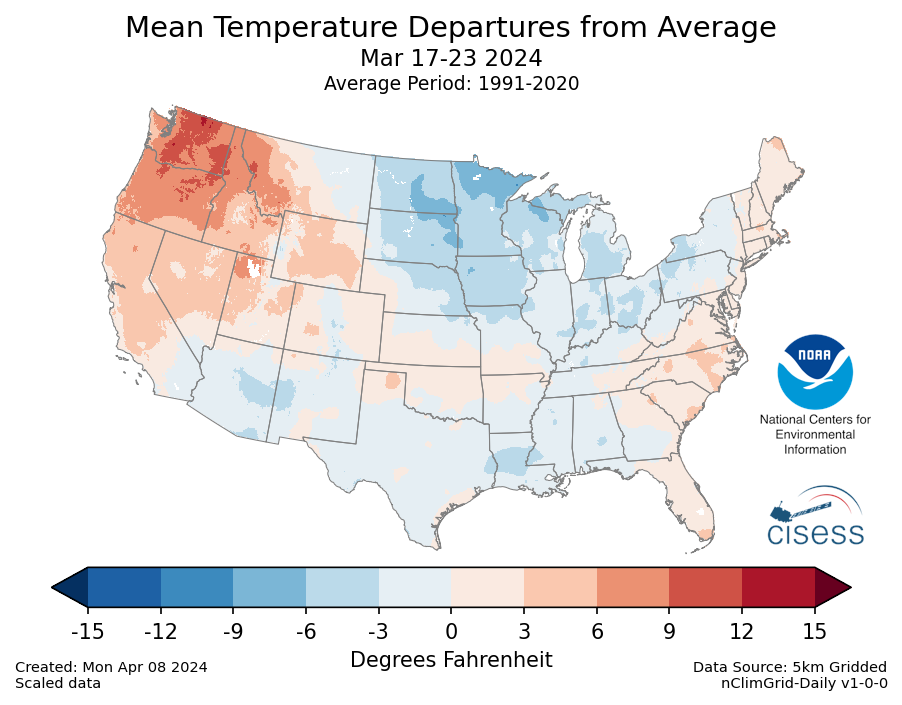
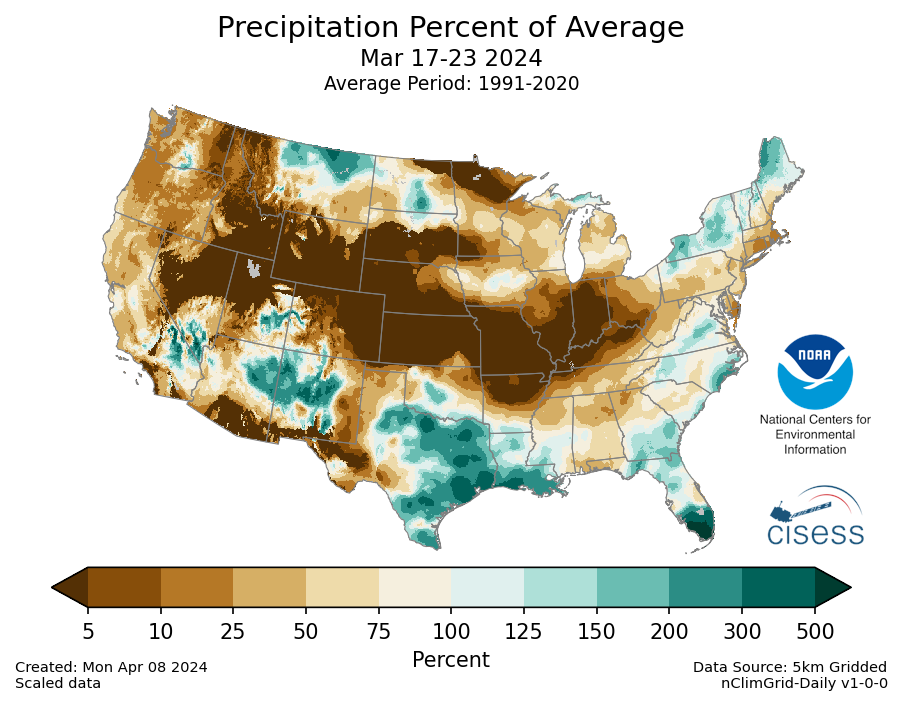
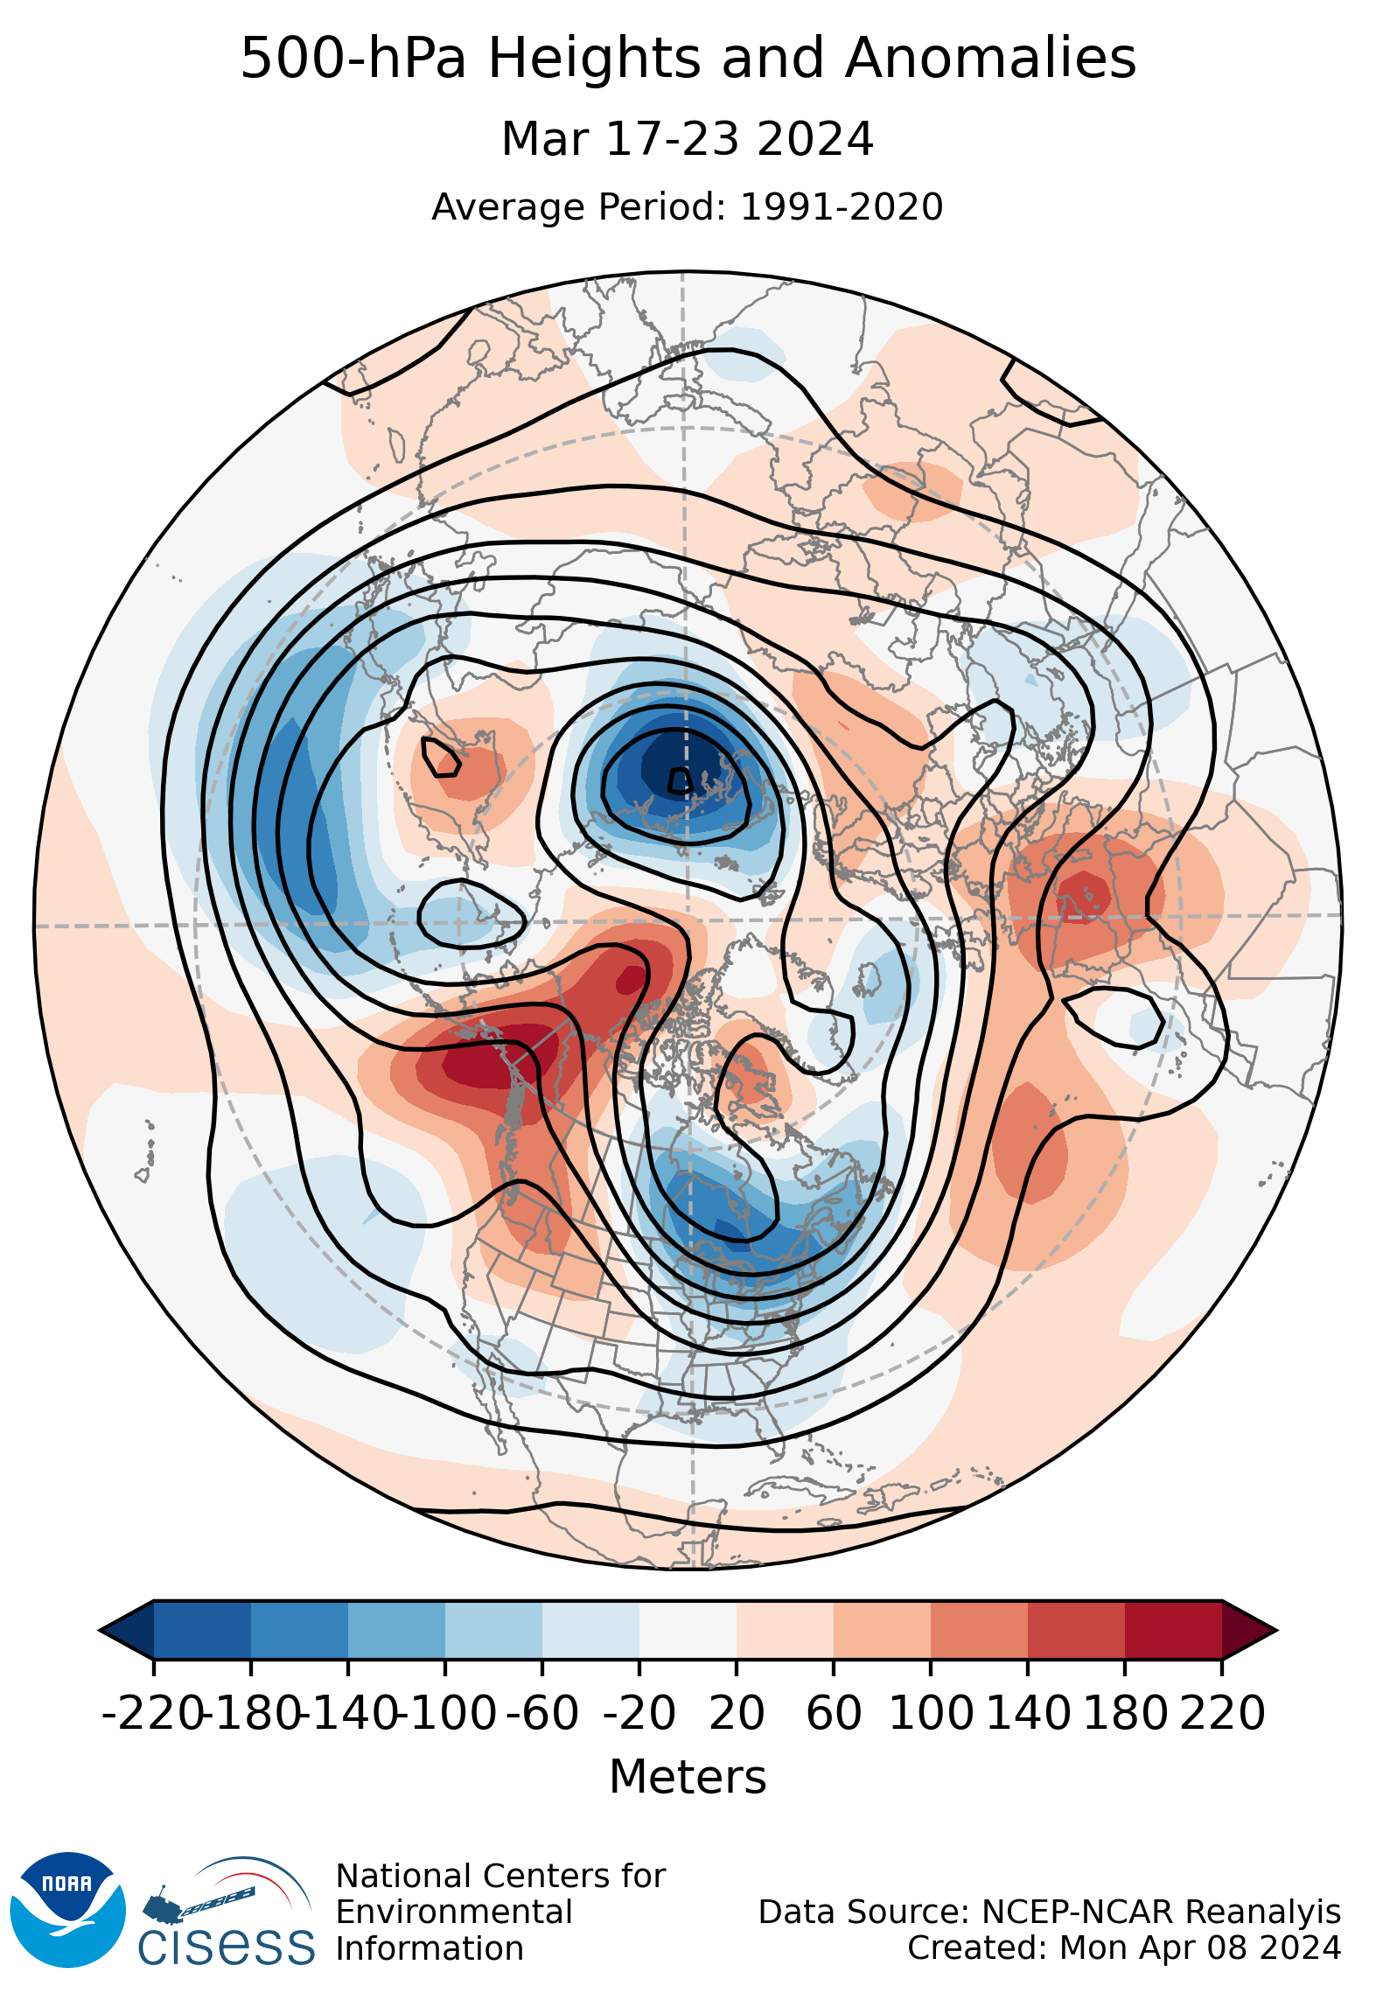
March 17-23
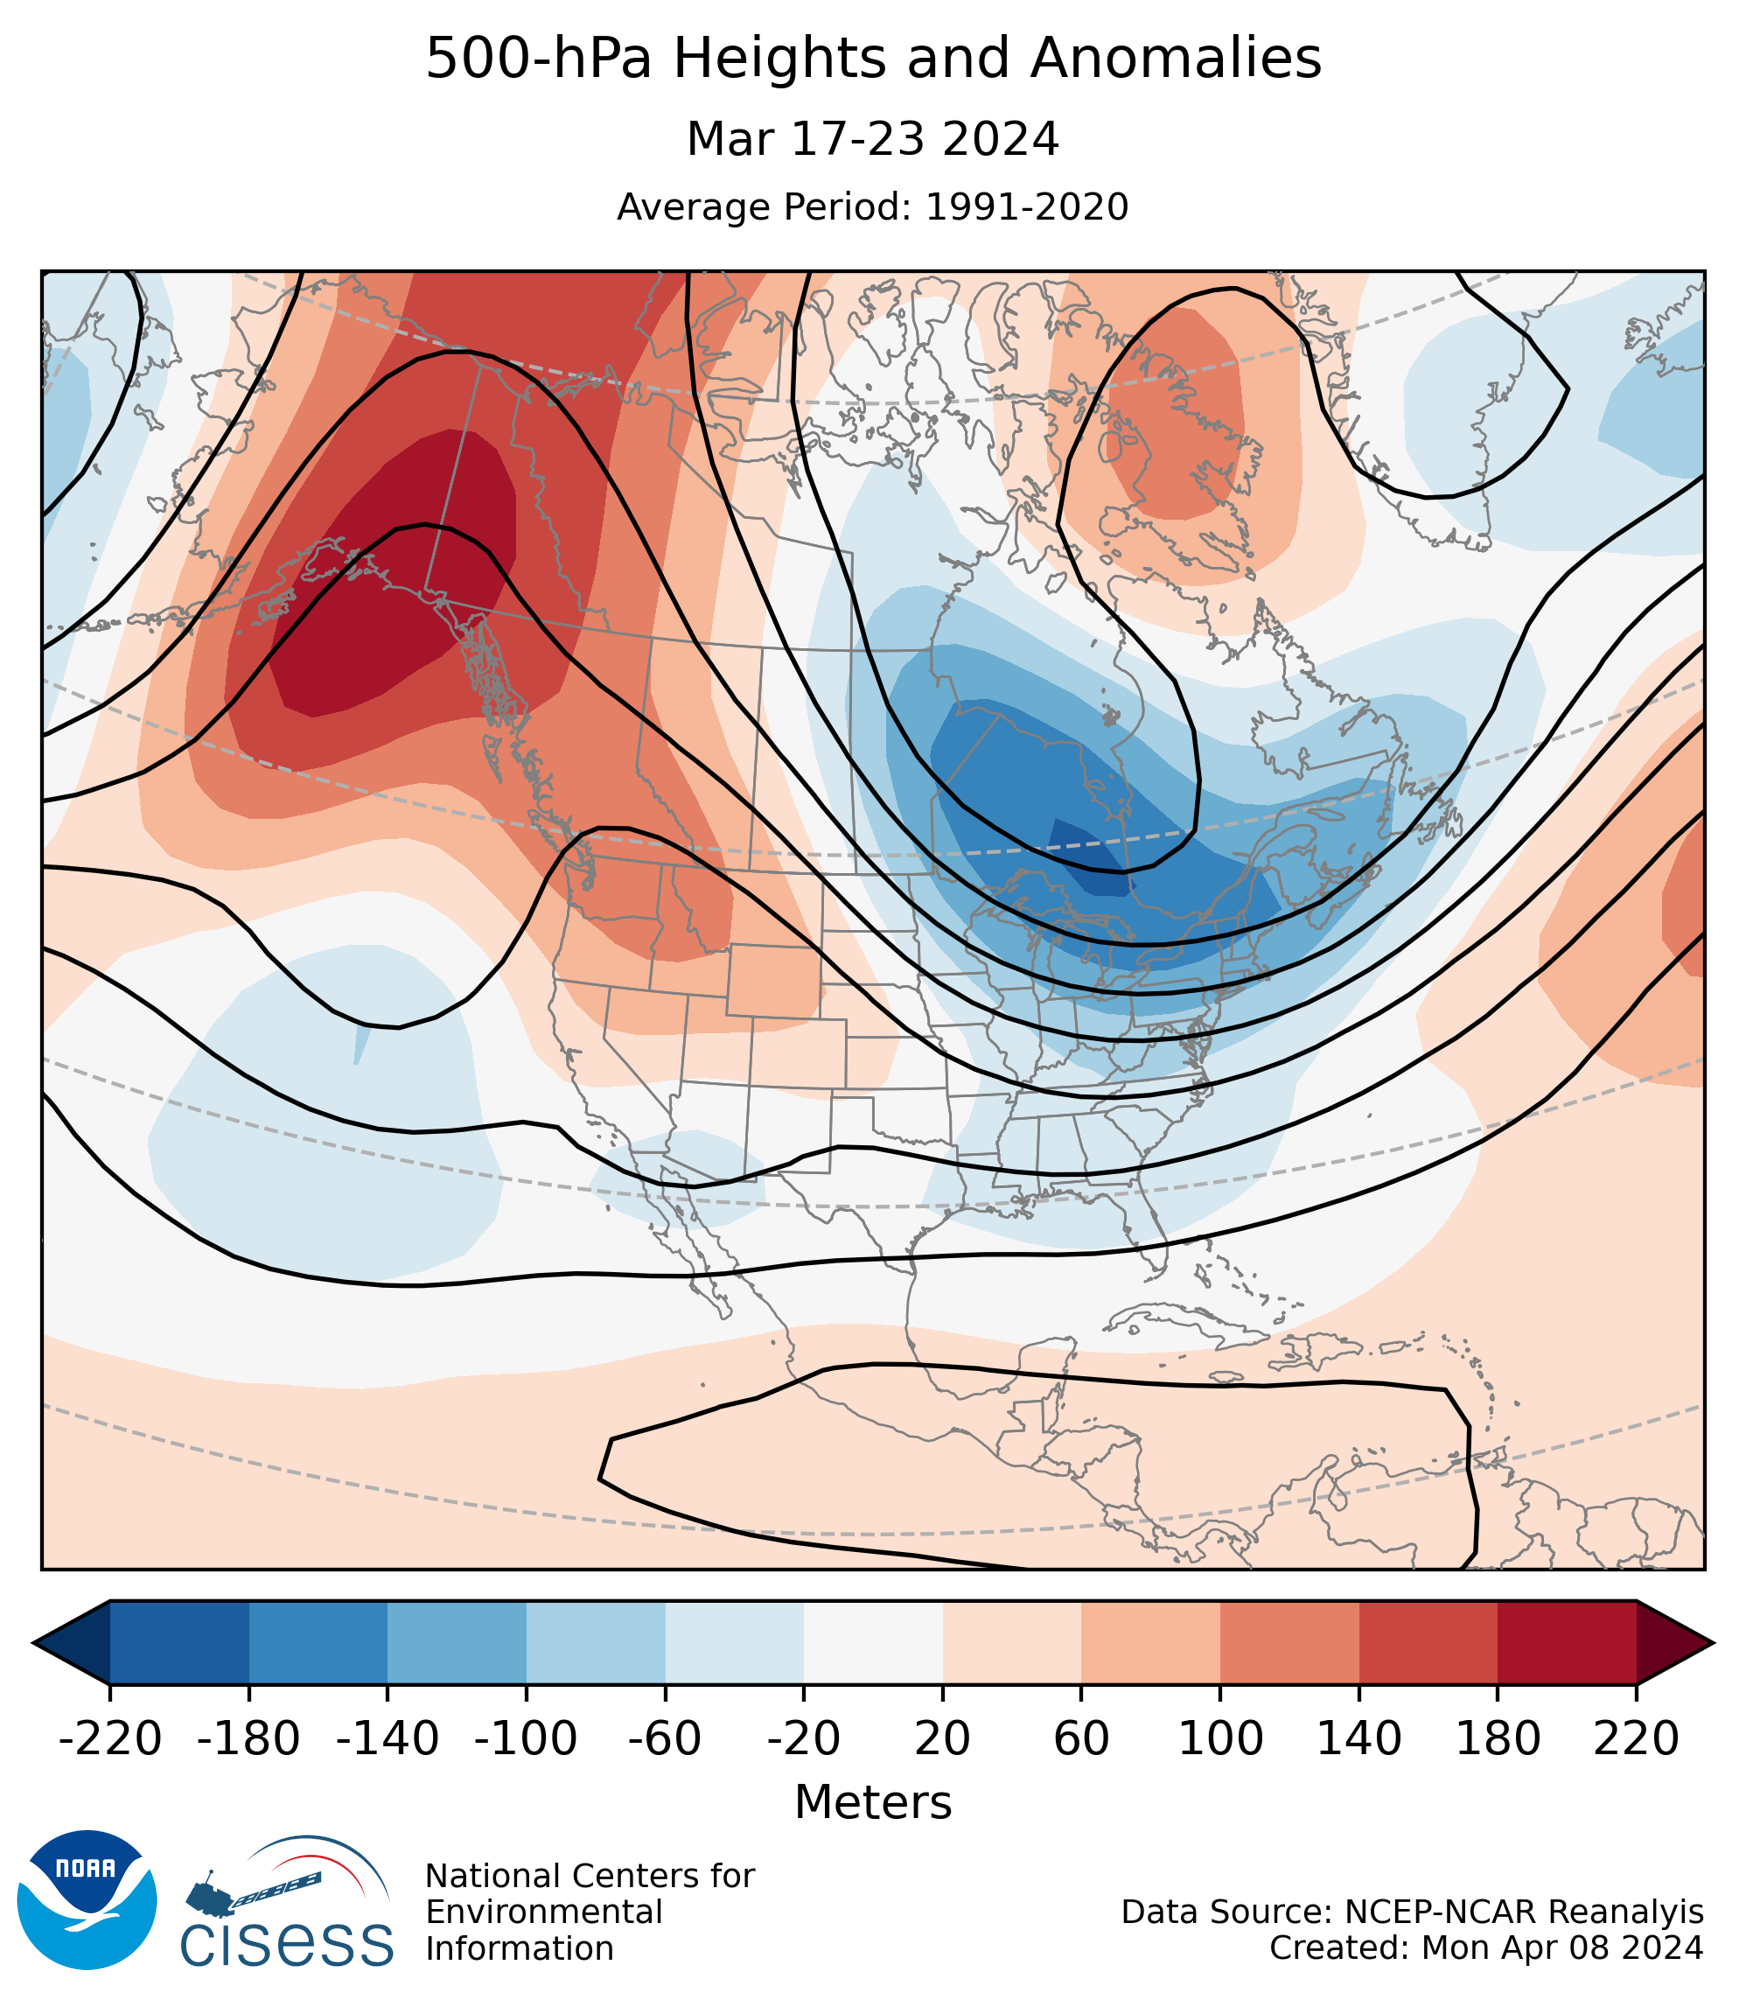
During the middle part of March, the synoptic pattern was flipped from the beginning of the month, with troughing across the eastern U.S. and ridging over the west. During the middle of the month, the WPO and EPO were both negative, which could help explain the reversal of the patterns seen during the first half of the month. Overall during the middle part of March, the Pacific Northwest saw warmer than normal conditions, with cooler conditions seen across the central and eastern U.S. Dry conditions were experienced over much of the U.S. with some precipitation occurring over the southern U.S. from Texas through to Florida.
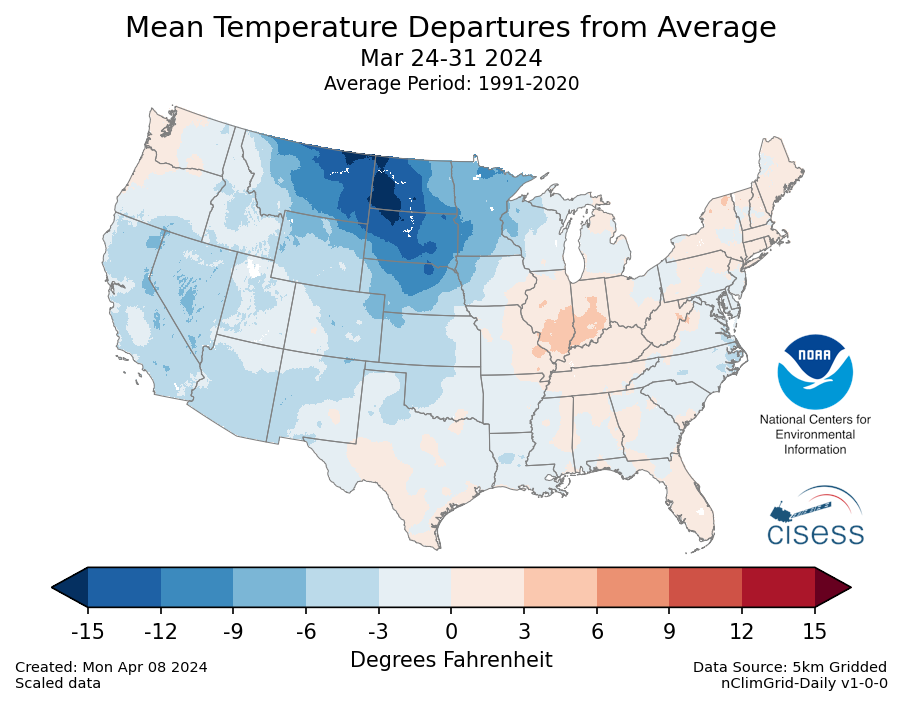
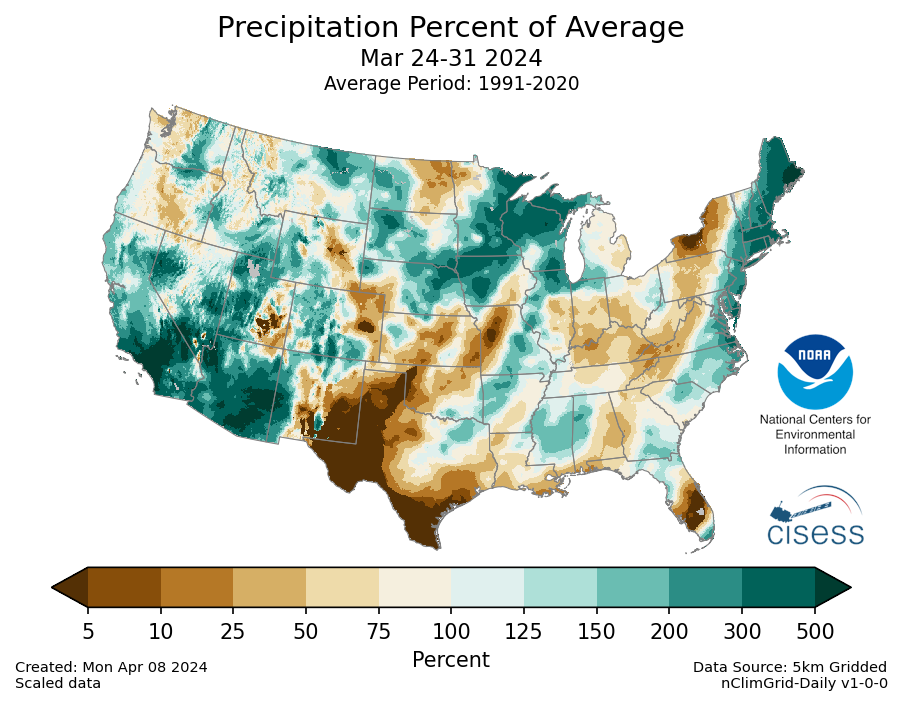
March 24-31
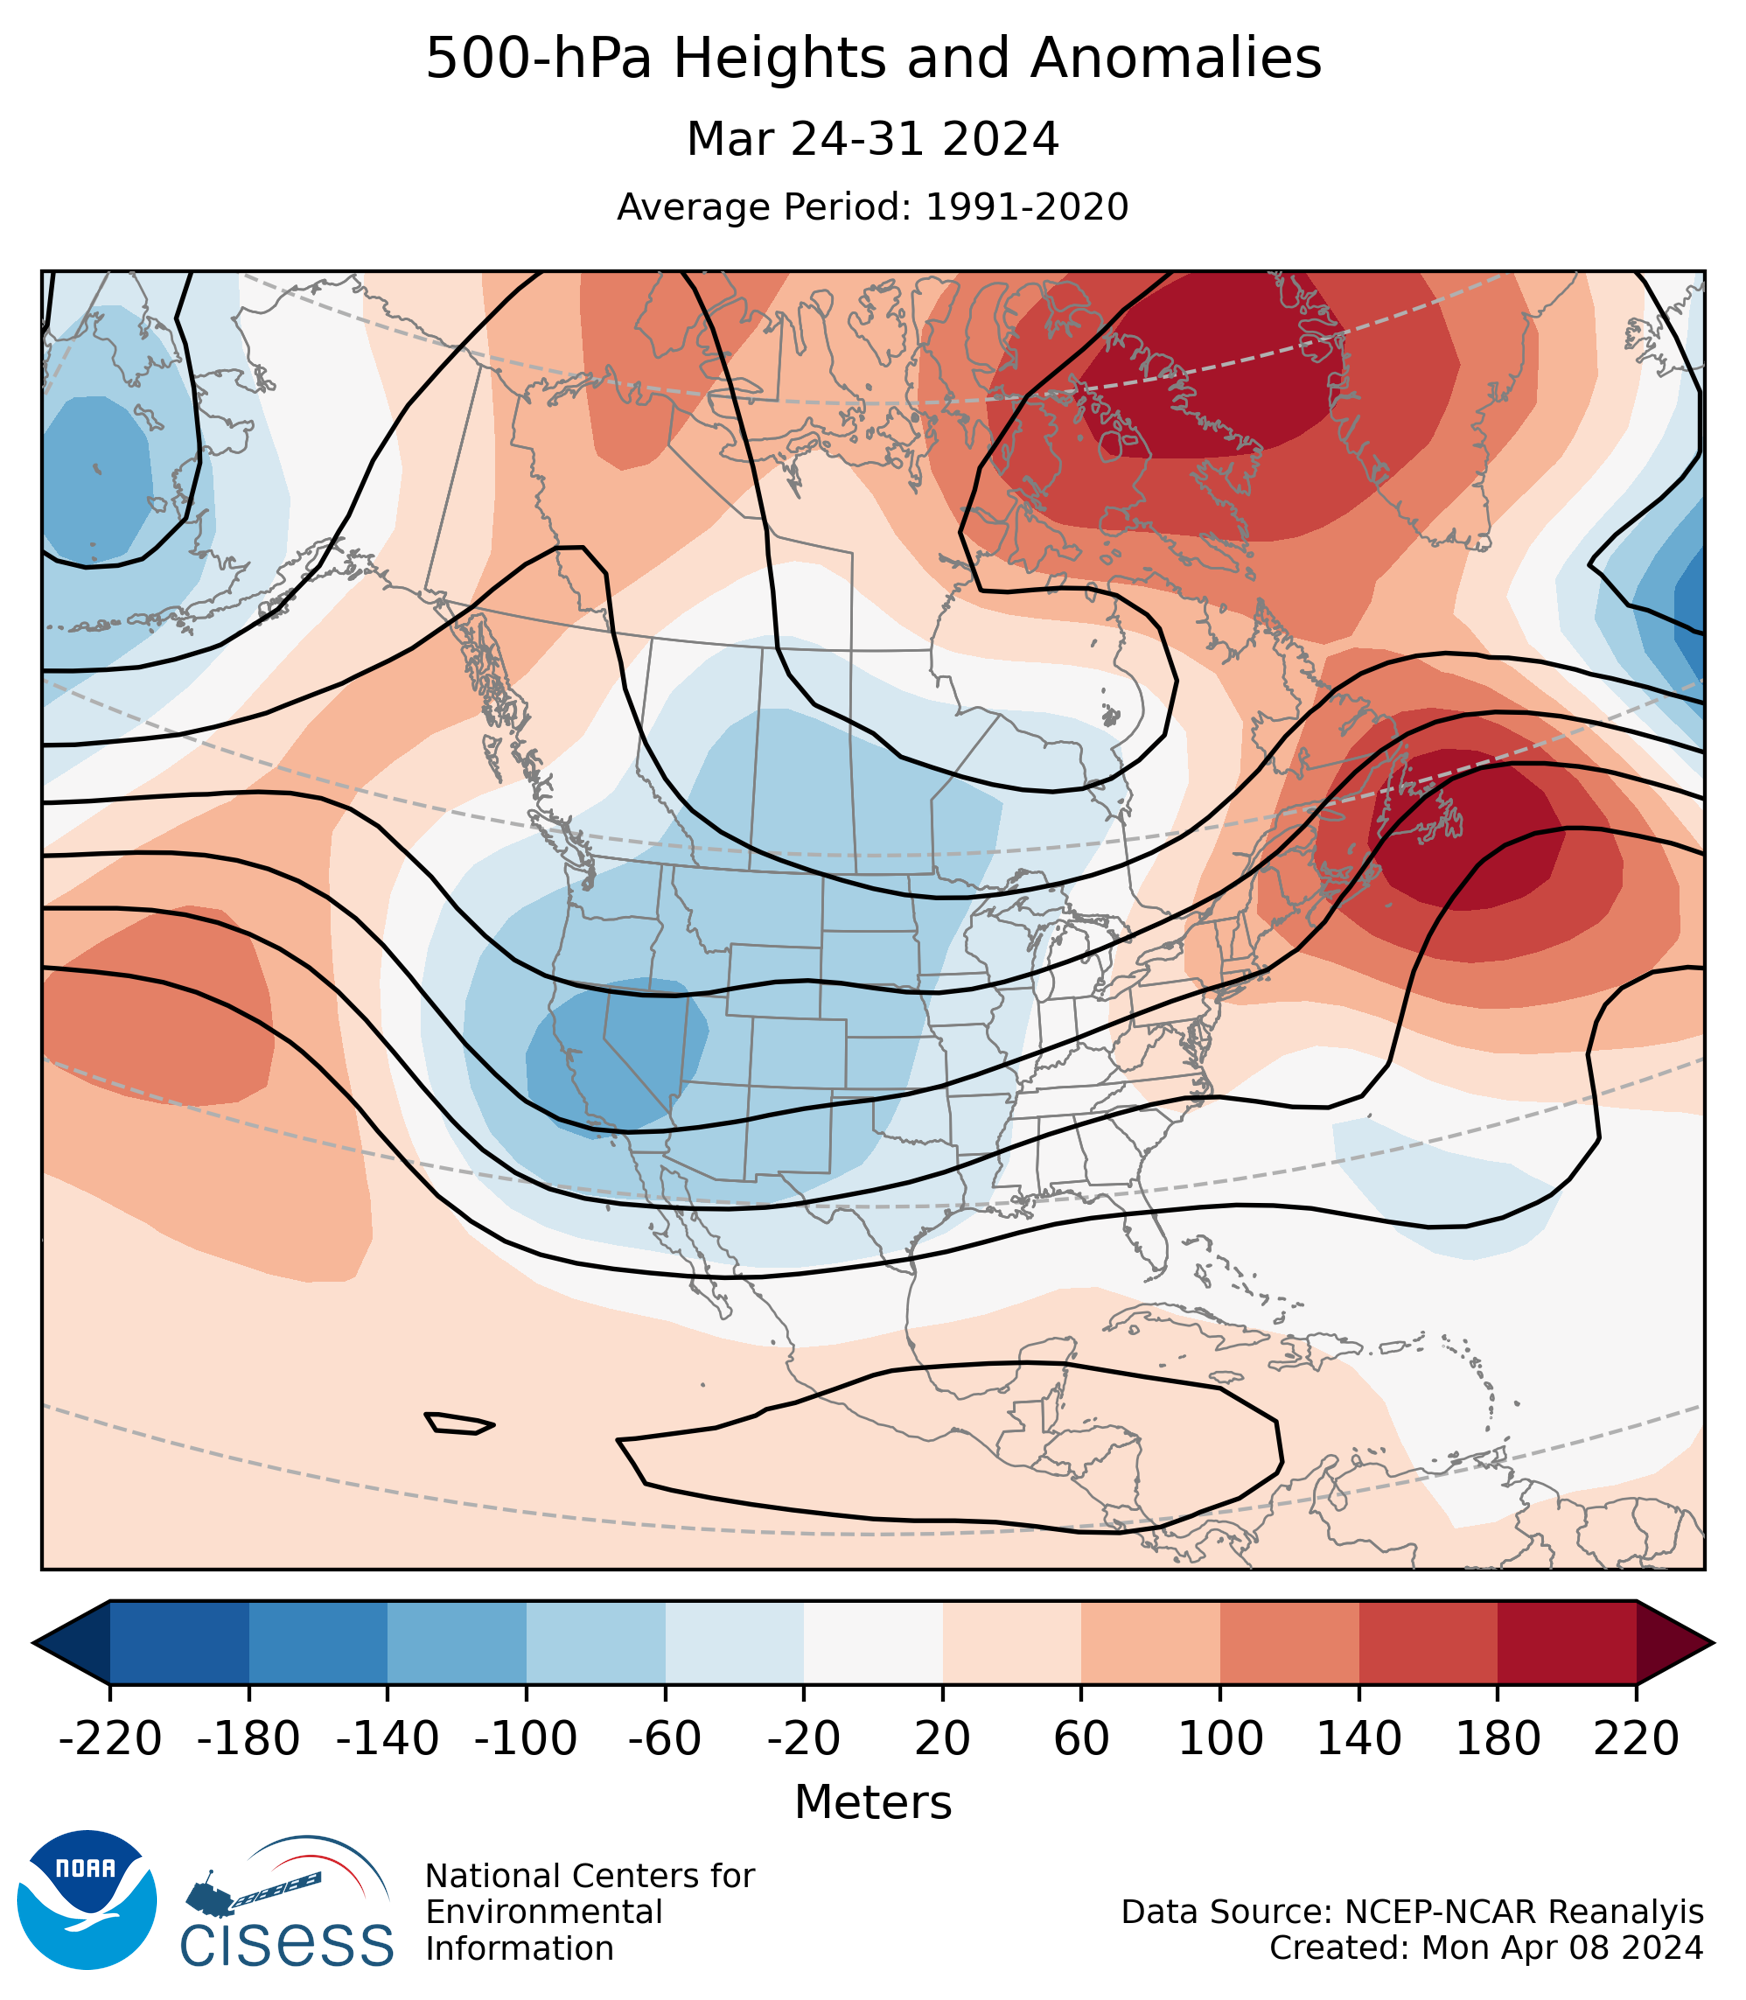
The overall temperature pattern at the end of March was similar to the pattern observed during the early part of the month with a trough over much of the western U.S. and a ridge over the eastern U.S. and Canada. This resulted in much cooler than normal conditions across much of the U.S. during the end of the month, especially over the northern Plains and western U.S. The end of March was much wetter as well, with the northern and western U.S. seeing enhanced precipitation totals. The AO was negative during the end of March, which could help explain the cooler conditions seen during the end of the month.
Atmospheric Drivers
ENSO: El Niño Southern Oscillation
- Description: Oceanic and atmospheric conditions in the tropical Pacific Ocean can influence weather across the globe. ENSO is characterized by two extreme modes: El Niño (warmer-than-normal sea surface temperature [SST] anomalies in the tropical Pacific) and La Niña (cooler-than-normal SST anomalies), with the absence of either of these modes termed “ENSO-neutral” conditions. These variations in SST change the locations of the Pacific's largest thunderstorms, which can in turn change circulation patterns around the globe.
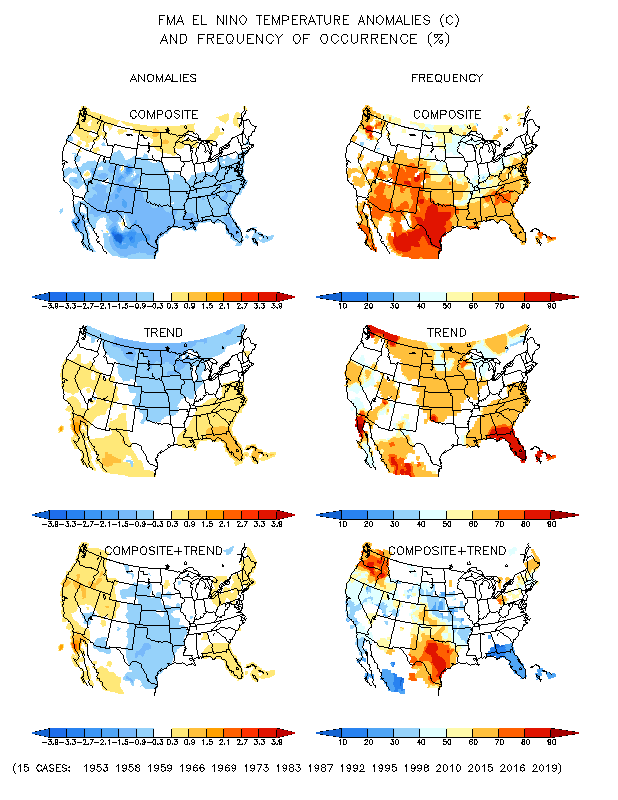
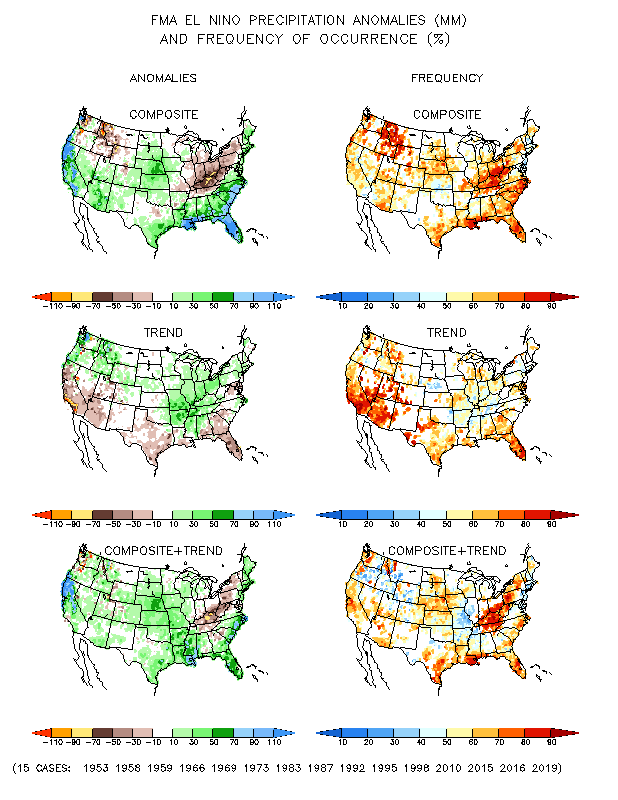
- Status: El Niño conditions continued during March. The most common metric for ENSO is the SST anomalies in the equatorial Pacific. These values were around +1.2°C during March. The Southern Oscillation Index, which measures the atmospheric response, was around 0.4. Together, the coupled ocean-atmosphere system was consistent with El Niño.
- Teleconnections (influence on weather): El Niño favors cooler temperatures for most of the contiguous U.S. Cooler than normal conditions were seen during the end of March when the ridging was less pronounced. El Niño is also associated with wetter conditions for the southeastern U.S. and the West Coast along with drier conditions for the northern U.S. Wetter than normal conditions were seen across the southeast and western U.S., matching the typical pattern.
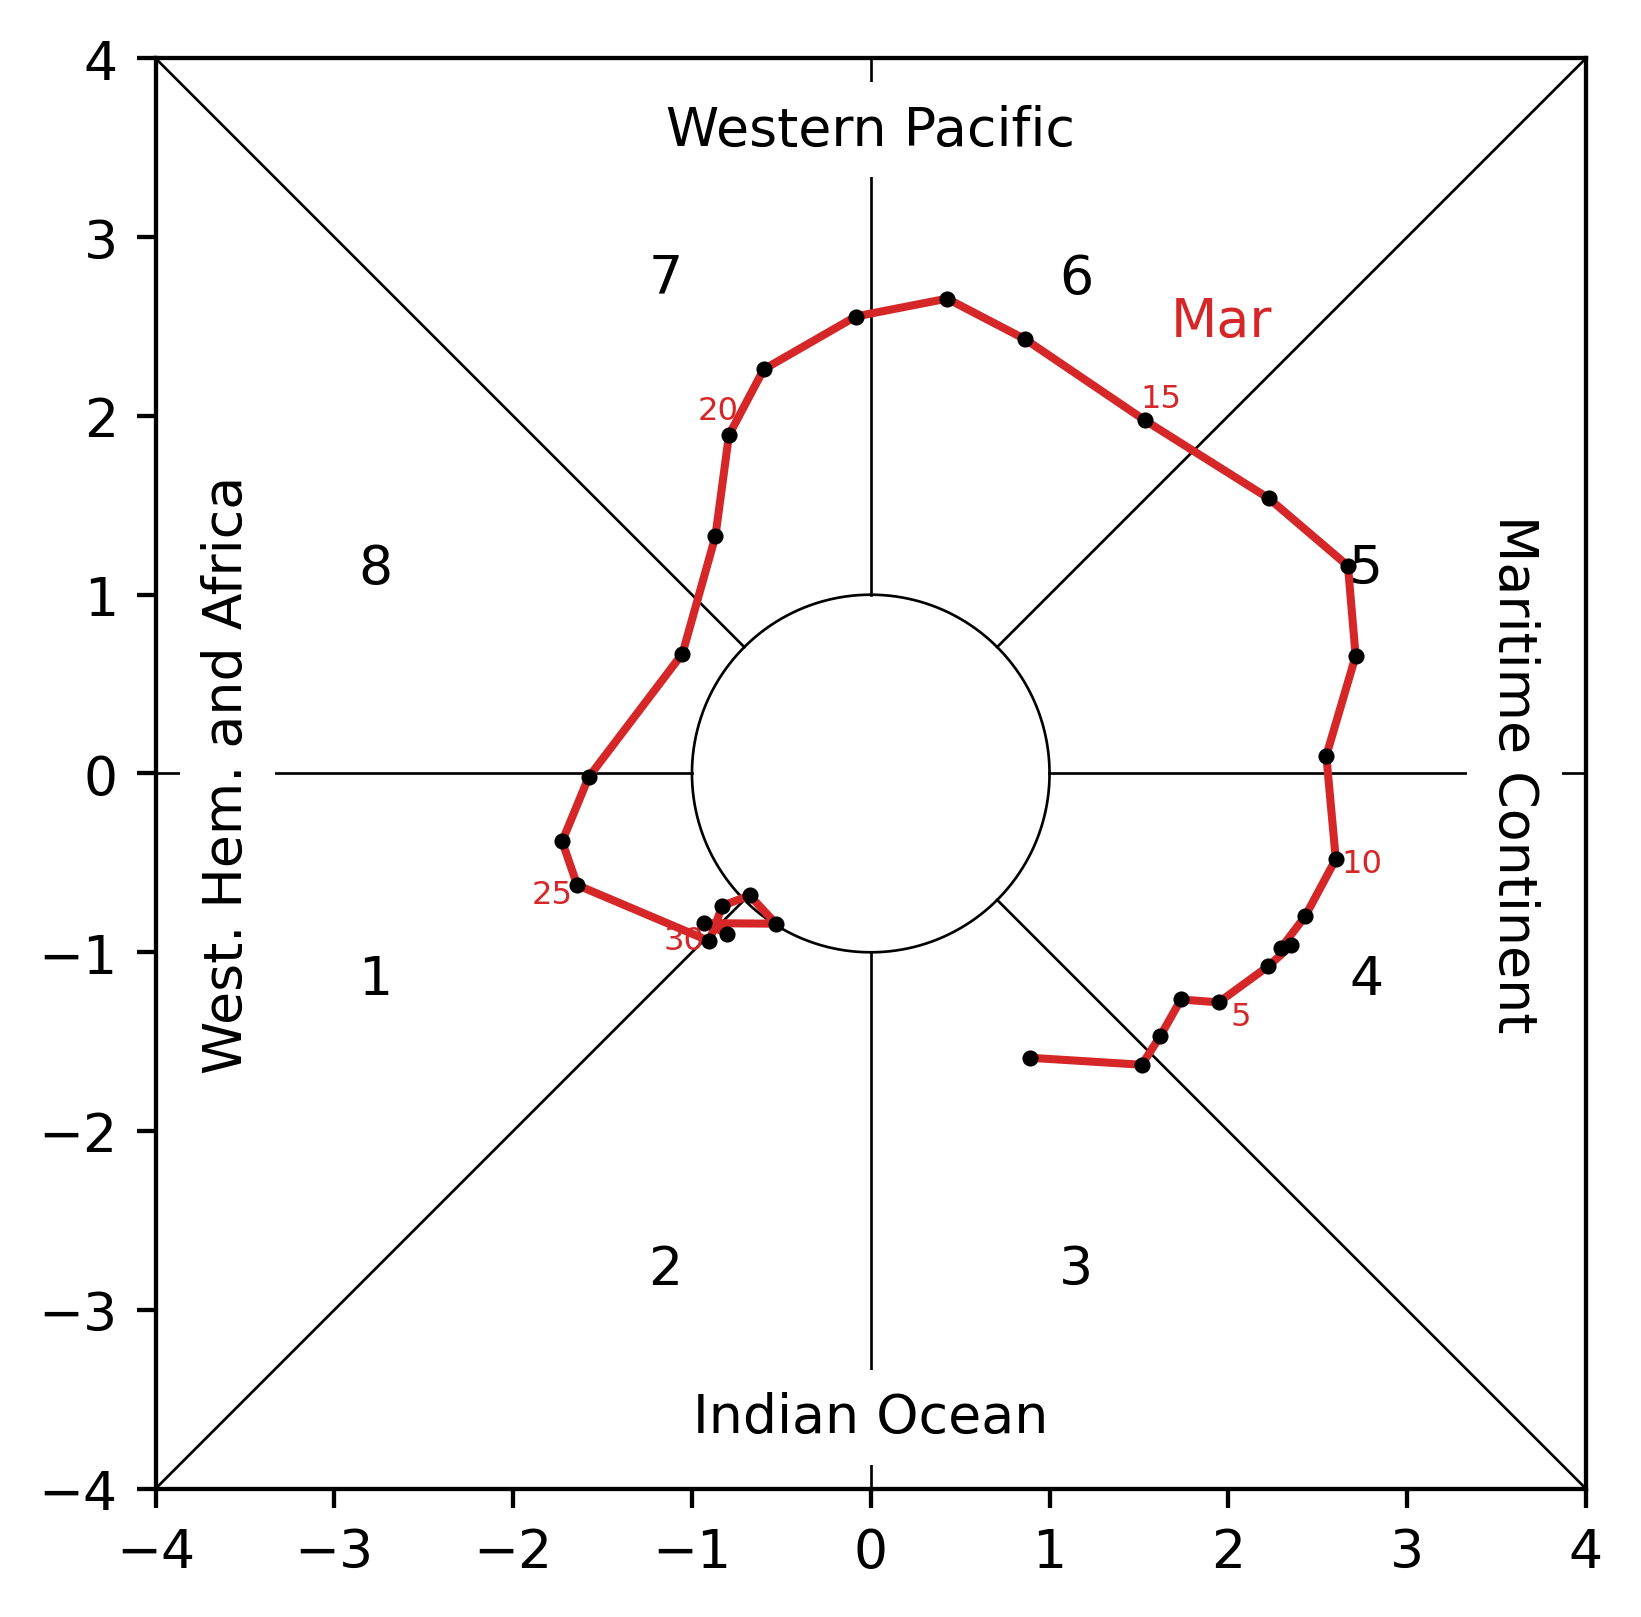
MJO: Madden-Julian Oscillation
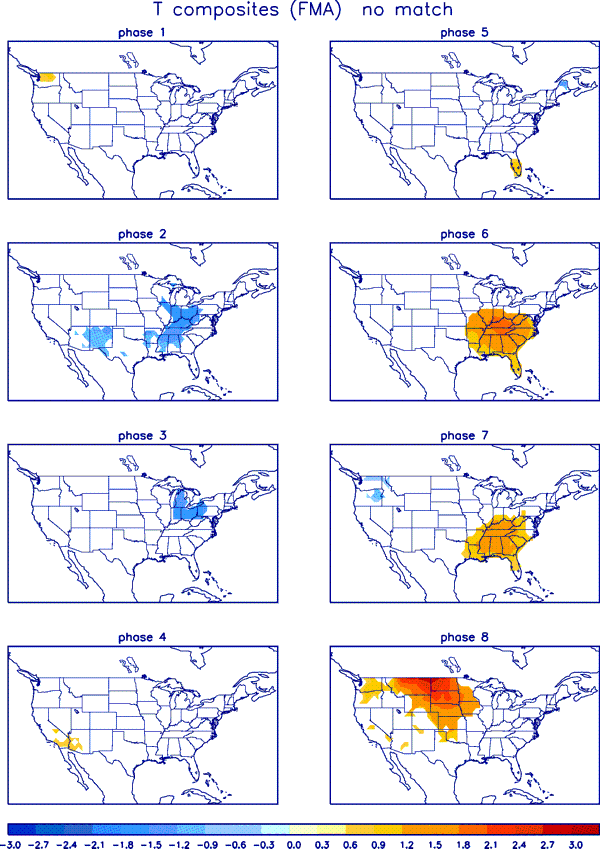
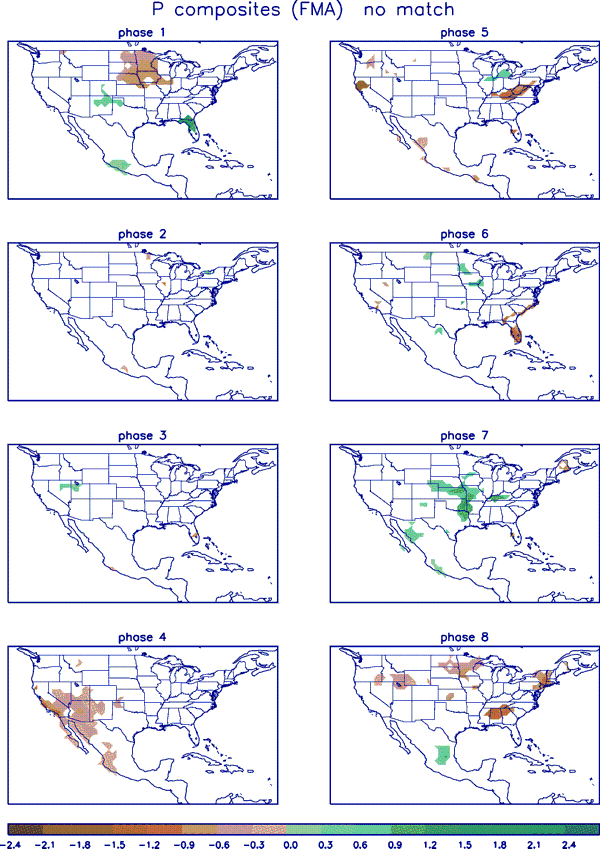
- Description: The MJO is the biggest source of subseasonal (20-60 day) tropical variability. It typically develops as a large envelope of tropical thunderstorms over the Indian Ocean that then moves eastward. Like ENSO, the MJO's effects on tropical rainfall is so strong that it can alter the atmospheric circulation around the globe. The thunderstorms decay when they cross the Pacific, but the associated winds can often continue across the Western Hemisphere to initiate the next MJO in the Indian Ocean. The MJO is episodic, meaning that it is not always active. The MJO index identifies both the MJO's amplitude and the longitude of its strongest rainfall. MJO amplitude is represented by the distance from the center of the figure with values outside the circle are considered active. The eight phases around the circle indicate the MJO's location.
- Status: The MJO index began March in phase 3 and a strong MJO moved through all phases during March, ending the month in phase 2.
- Teleconnections (influence on weather): During March, despite the strong MJO, the observed temperature patterns across the U.S. did not align well with those typically seen during the corresponding MJO phases. During the end of the month MJO phase 1 was observed, which corresponds to wetter than normal conditions over the southeast and southern Rockies, which was observed.
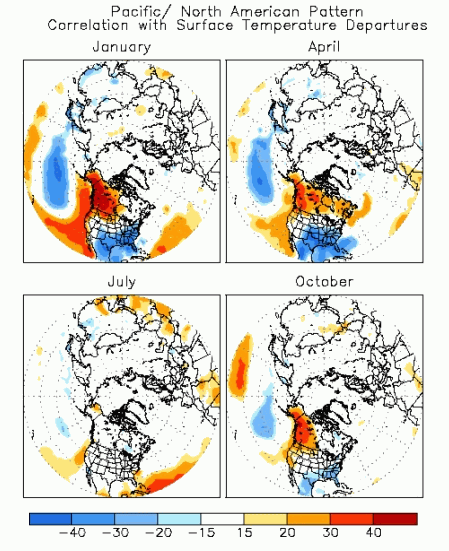
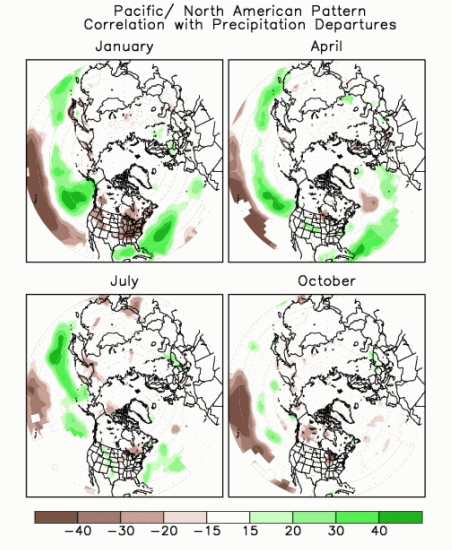
PNA: Pacific/North American Pattern
- Description: The PNA teleconnection pattern is associated with strong fluctuations in the strength and location of the East Asian jet stream. PNA-related blocking of the jet stream flow in the Pacific can affect weather downstream over North America, especially the West and especially in the winter half of the year.
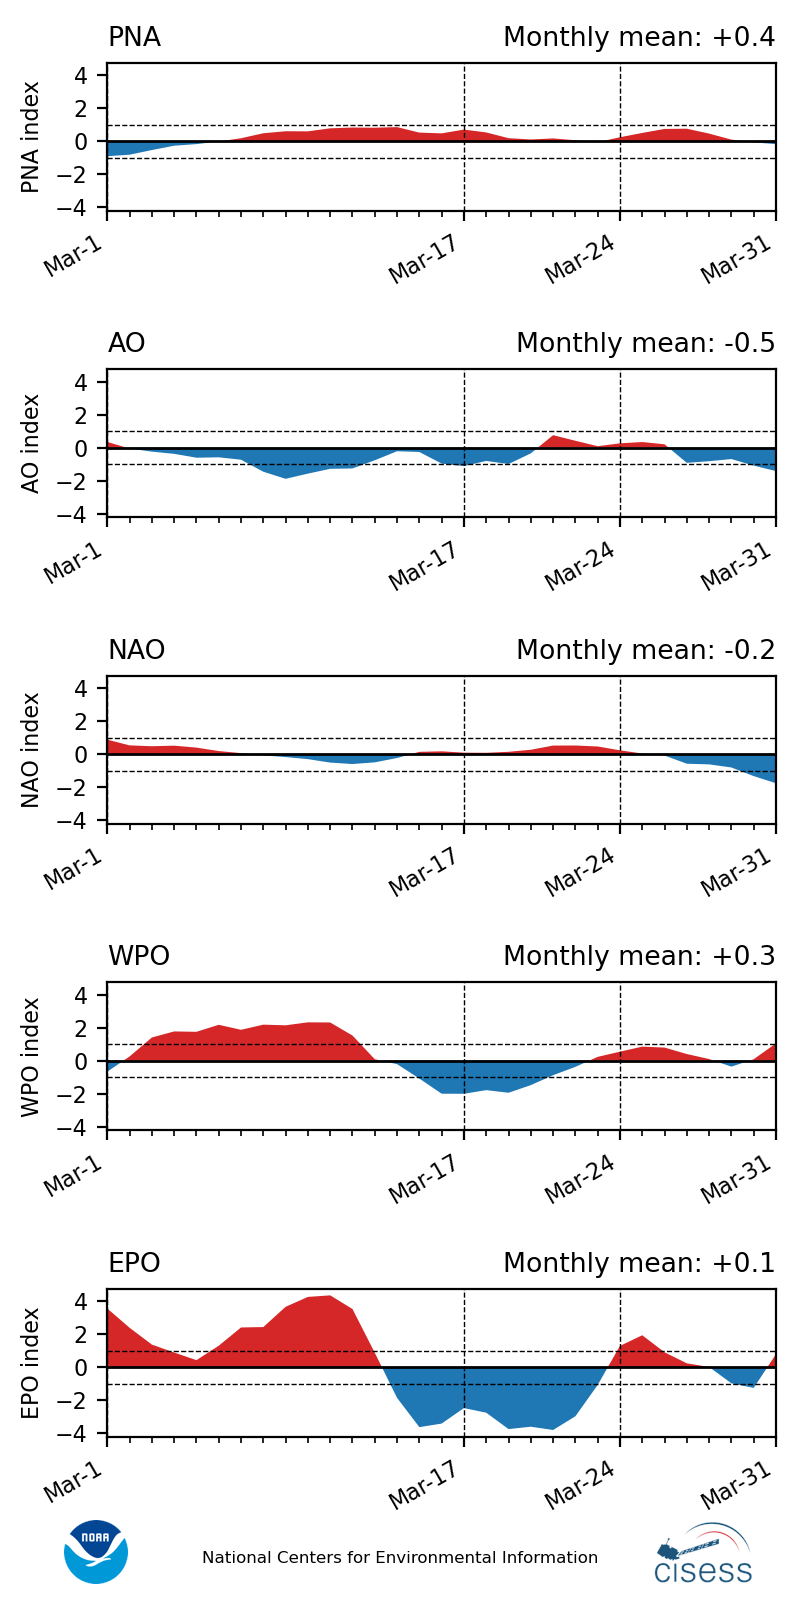
- Status: The daily PNA index was weakly positive during the majority of March, with a brief weakly negative period at the beginning of the month. The monthly mean was +0.4.
- Teleconnections (influence on weather): The positive PNA generally favors warmer than normal conditions for the Pacific Northwest and cooler for the Southeast. These patterns were generally not observed during March. The positive PNA also favors wetter than normal conditions for the southern Rockies and eastern U.S. These conditions were partially observed during the month, especially during the end of the month.
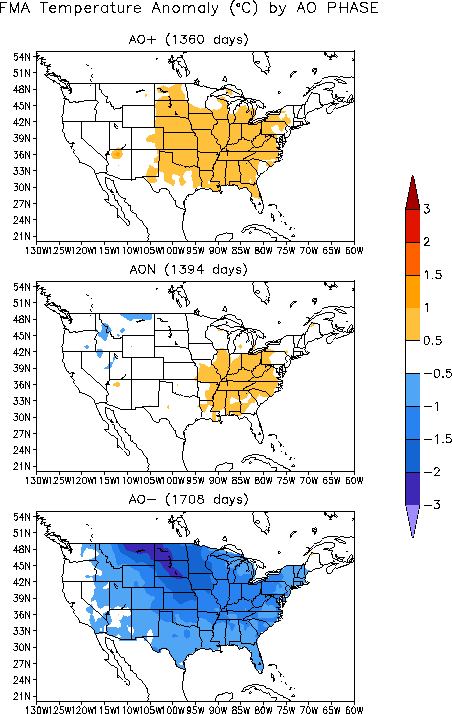
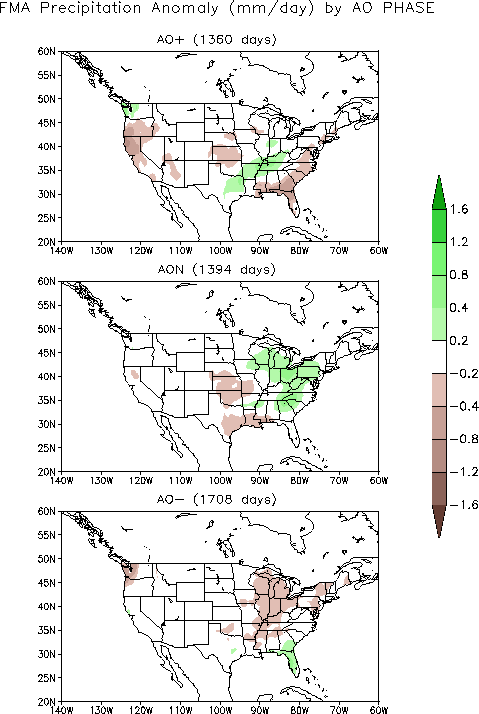
AO: Arctic Oscillation
- Description: The AO teleconnection pattern generally measures the pressure difference between the low pressure over the North Pole and the higher pressures in the subtropical ridges. This pressure difference is larger during a positive AO, resulting in a stronger midlatitude jet. When the AO is negative, the jet is weaker and will have larger troughs and ridges.
- Status: The daily AO index began the month negative, was weakly positive during the third quarter of the month, and returned to being negative at the end of the month. The monthly mean was -0.5.
- Teleconnections (influence on weather): The negative AO is typically associated with cool anomalies over much of the U.S., which were observed during the second half of the month. During the early part of the month warmer than normal temperature conditions were experienced over large portions of the U.S., which was opposite to the typical patterns experienced during a negative AO. Neutral AO conditions were generally observed during the middle of the month. Neutral AO conditions tend to lead to wetter than normal conditions over the eastern U.S. and drier conditions over the central U.S. Wetter conditions were observed over the eastern U.S. during March, with drier conditions across the central Plains during the middle of the month corresponding to the weak/neutral AO observed during the month.
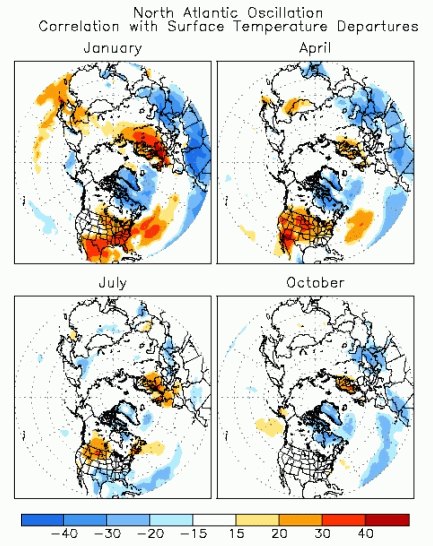
NAO: North Atlantic Oscillation
- Description: The NAO teleconnection pattern relates the pressure over the sub-polar low near Greenland and Iceland with the subtropical high over the Central Atlantic. It significantly affects the weather on both sides of the Atlantic.
- Status: The daily NAO index was near neutral for the majority of March, but transitioned to negative during the end of the month. The monthly mean was -0.2.
- Teleconnections (influence on weather): The NAO is positively correlated with temperatures over most of the U.S. during March. The negative NAO was consistent with the cool conditions seen during the end of March.
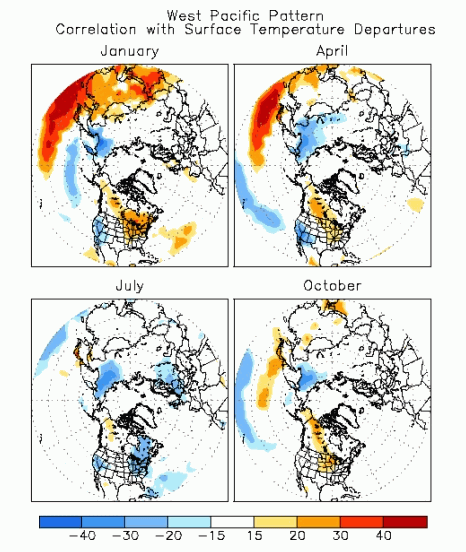
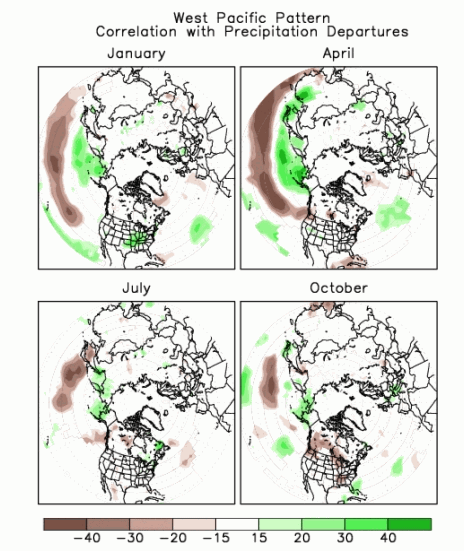
WPO: West Pacific Oscillation
- Description: The WPO teleconnection pattern is a primary mode of low-frequency variability over the North Pacific and reflects zonal and meridional variations in the location and intensity of the East Asian jet stream in the western Pacific.
- Status: The daily WPO index was strongly positive during the beginning of March, negative during the middle of the month, and weakly positive during the end of the month. The monthly mean was +0.3.
- Teleconnections (influence on weather): The positive WPO is typically associated with warmer temperatures over the northern and central U.S., with cooler conditions over the southwestern U.S. This pattern was observed during the first half of March. The positive WPO is also associated with wetter conditions over parts of the western U.S. The positive WPO may have contributed to the rainfall over the Rockies during the month of March.
EPO: East Pacific Oscillation
- Description: The EPO pattern identifies variations in the strength and location of the eastern Pacific jet stream. During the positive phase, the jet is stronger and shifted southward. The negative phase is associated with an Alaskan ridge that weakens the jet. The EPO is closely related to the East Pacific–North Pacific (EP–NP) teleconnection pattern, although the two are defined with opposite signs.
- Status: The daily EPO index was strongly positive during the first third of the month, strongly negative during the middle third, and oscillating during the final third of March. The monthly mean was +0.1.
- Teleconnections (influence on weather): The positive phase of the EPO favors warmer than normal temperatures across the northern and eastern U.S. The observed patterns matched the positive EPO patterns across the northern and eastern U.S. during the beginning of the month. During the middle of the month, the negative EPO could have played a role in the shift to cooler temperatures over the eastern U.S.