Summary Information
The Monthly Report Summary Information is a synopsis of the collection of national and global summaries released each month.
« National Summary Information 2016Full Report »
National Summary Information for December 2016
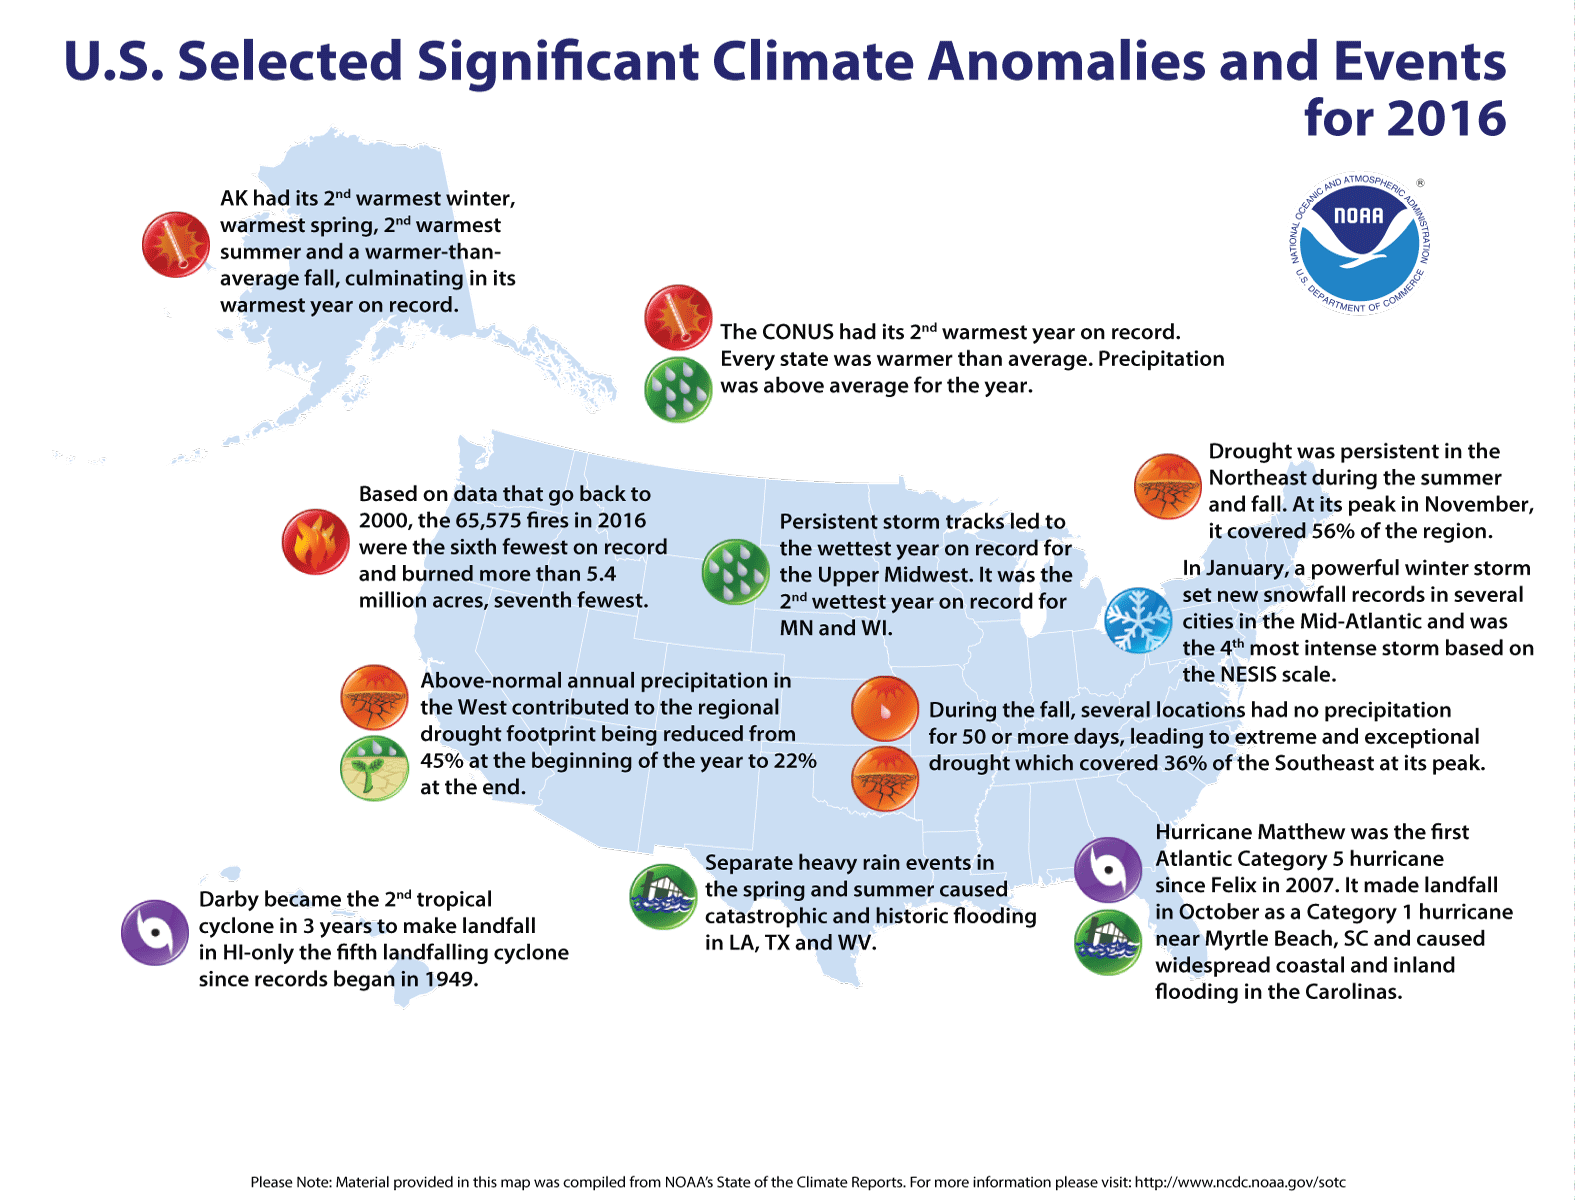
US had 2nd warmest year on record in 2016
Average drought coverage was smallest since 2010
15 "Billion-Dollar Disasters" was second-highest on record,
with four inland flooding events
The average annual temperature for the contiguous U.S. was 54.9°F, which was 2.9°F above the 20th century average. This was the second warmest year of the 122 years on record, behind 2012 (55.3°F), and the 20th consecutive warmer-than-normal year for the U.S. (1997 through 2016).
During the year, the U.S. experienced 15 weather and climate disasters with losses exceeding $1 billion, causing a total of $46.0 billion in damages. This was the second highest number of billion-dollar events in the 37-year record (1980-2016), one less than the 16 that occurred in 2011. Four of these were inland flooding events not associated with named tropical storms, doubling the previous record for number of billion-dollar inland flood events in one year, which occurred several years, most recently in 2015.
This annual summary from NOAA's National Centers for Environmental Information is part of the suite of climate services NOAA provides to government, business, academia and the public to support informed decision-making.
Significant Climate Events for 2016
Annual Temperature
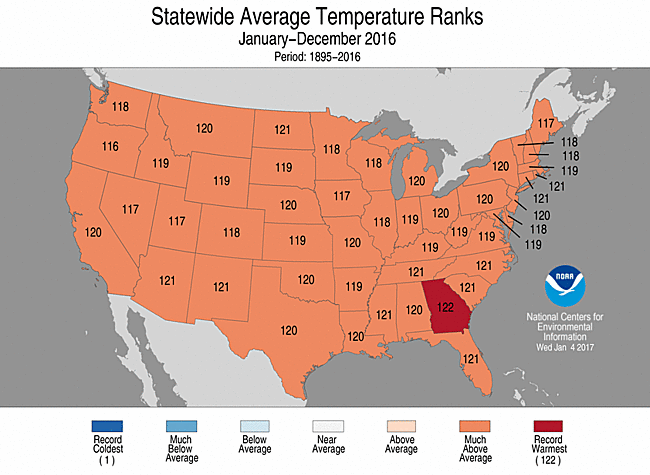
2016 Statewide Temperature Ranks (top)
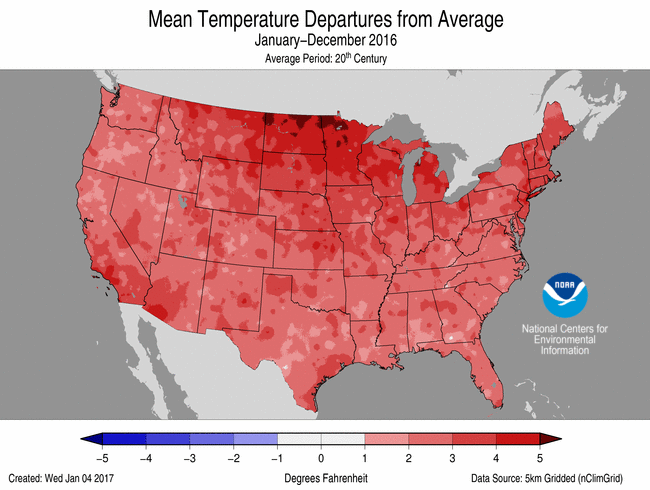
and Grid Temperature Anomalies Map (bottom)
- The year was notable for its widespread warmth, with virtually all states having annual average temperatures in the top 10 percent on record.
- Alaska, the nation's largest state, was record warm, with an average annual temperature of 31.9°F. This was 1.6°F warmer than the previous record, set in 2014.
- The Southeast experienced its warmest year on record, as did the state of Georgia.
- Nationally, the average minimum (low) temperature was 43.1°F, the warmest on record, exceeding the previous value (42.9°F in 2012) by about 0.2°F. Six states were warmest on record for minimum temperature.
- The average maximum (high) temperature was 66.7°F, the third warmest on record, exceeded only by those of 2012 and 1934.
Annual Precipitation and Drought
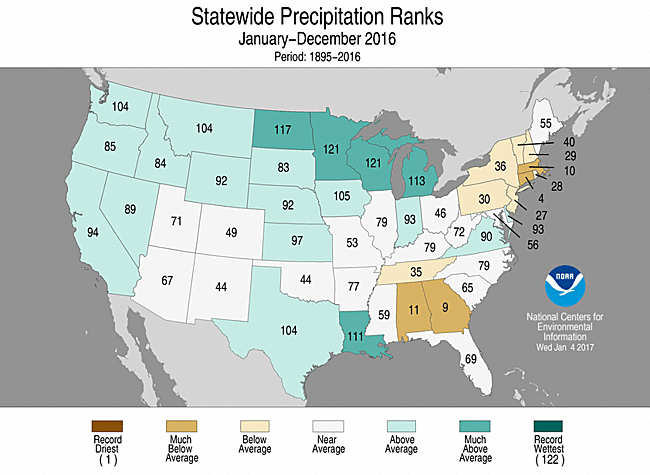
2016 Statewide Precipitation Ranks (top)
and Grid Precipitation Anomalies Map (bottom)
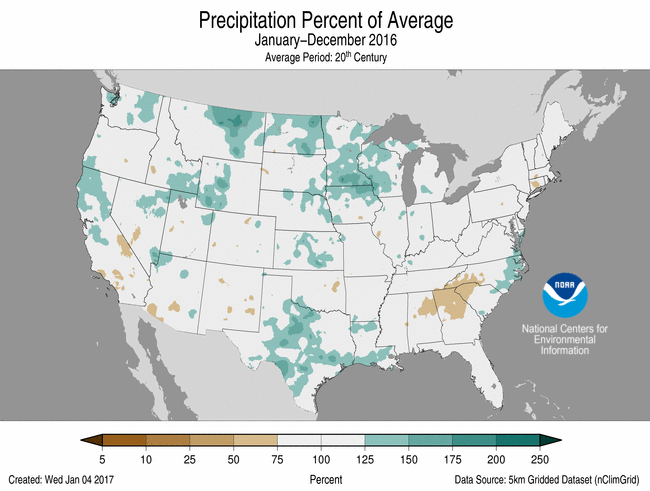
- The contiguous U.S. average annual precipitation was 31.70 inches, which is 1.76 inches above the long-term average. This made 2016 the 24th wettest year on record for the nation, and the fourth consecutive year with above-average precipitation.
- Generally, the coastal Pacific Northwest was wetter than average for the year, as was the ArkLaTex region and the Upper Midwest. The Northeast and the Southeast were generally dry, with the exception of coastal portions of the Carolinas and Virginia, which received significant rains associated with the remnants of tropical systems Hermine and Matthew.
- On average, drought generally improved in the West, especially early in the year. East of the Mississippi, drought intensified and expanded in two distinct areas during the summer: one in southern New England and adjacent parts of the Northeast and one in the Southern Appalachians and adjacent parts of the Southeast. By year's end, the nation's drought situation largely centered on these areas.
- The average drought coverage for the year, as assessed in the U.S. Drought Monitor, was 18.95 percent of the contiguous U.S., the smallest since 2010. The smallest footprint during 2016 was 12.41 percent in March, following significant improvements in the West. The largest drought coverage was 31.46 percent in late November, concurrent with the peak of the eastern droughts.
- The Upper Midwest had its wettest year on record, averaging 36.57 inches across the region. This very slightly exceeded its previous record, set in 2010, by 0.03 inch. Minnesotaand Wisconsin each had their second wettest year on record.
- The Northeast and Southeast as a whole were characterized as "Below Average", or in their driest third of history. Connecticut had its fourth driest year, and Georgia its ninth driest.
Notable and Extreme Events
- In 2016, the U.S. experienced four inland flooding events with losses exceeding $1 billion each and cumulatively caused about $16 billion in losses. This was the first year since 1997 that inland flooding was the costliest disaster type of the seven categories tracked, and the first time that more than two inland flooding events caused losses exceeding $1 billion each. NOAA's record of Billion-Dollar Weather and Climate Disasters dates to 1980 and is adjusted for inflation. (see also a blog post on climate.gov regarding trends in billion-dollar disasters)
- The U.S. Climate Extremes Index (USCEI) for 2016 was 95 percent above average, the third highest value on record, behind 1998 and 2012. On the national scale, extremes in both warm maximum temperatures (second highest on record) and minimum temperatures (highest on record) largely drove the USCEI value. The USCEI is an index that tracks extremes (occurring in the upper or lower 10 percent of the record) in temperature, precipitation, land-falling tropical cyclones and drought across the contiguous U.S.
December by the Numbers
Temperature
December Statewide Temperature Ranks (top)
and Grid Temperature Anomalies Map (bottom)
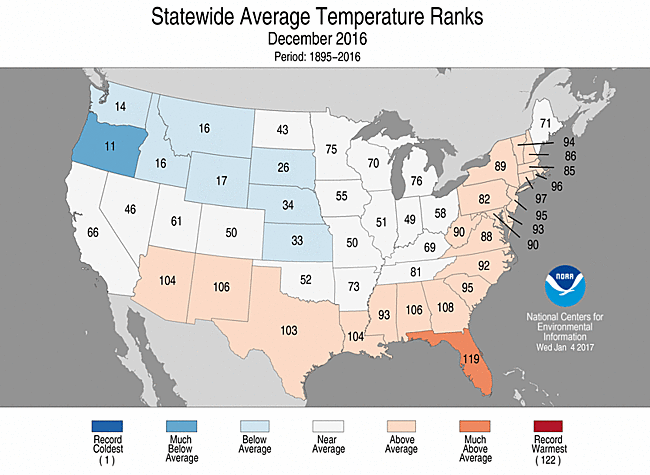
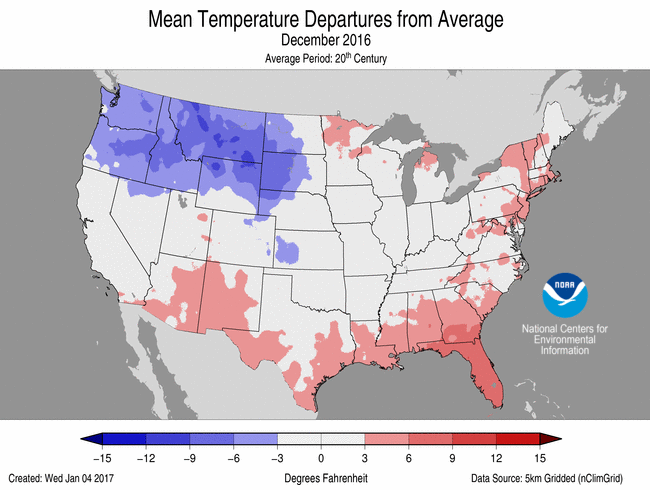
- The December average temperature for the contiguous U.S. was 32.9°F, near the long-term average for the month.
- The northwestern quarter of the contiguous U.S. was generally cooler than average for the month, while the southern U.S. and the Atlantic Coast states were warmer than average. Florida had its fourth warmest December on record, while Oregon had its 11th coolest.
- Based on NOAA's Residential Energy Demand Temperature Index (REDTI), the contiguous U.S. temperature-related energy demand during December was 44.4, the 40th lowest value of the 122-year record, owing largely to warmer-than-normal temperatures in the more populated eastern half of the country.
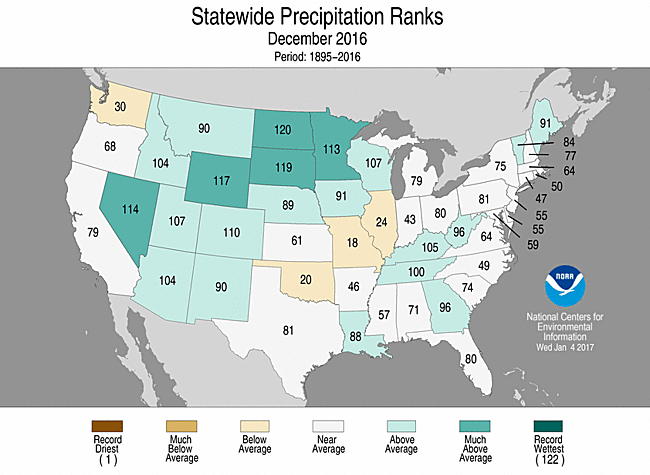
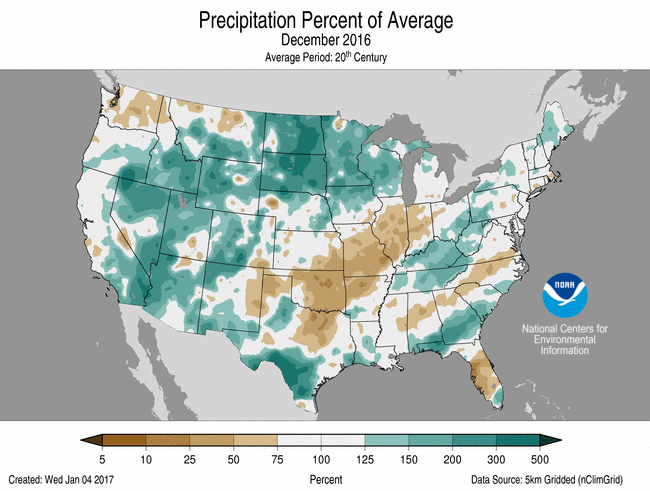
- December precipitation averaged to 2.69 inches across the contiguous U.S., which is 0.34 inch above the long-term average and technically is considered 'Above Average' or in the top one-third of Decembers in history.
- Wetter-than-normal conditions prevailed in December across the Intermountain West, northern Plains and parts of the Ohio Valley. Drier-than-normal conditions were observed in parts of the Southern Plains and Midwest.
- Drought coverage contracted from 31.46 percent of the contiguous U.S. at the end of November to 24.04 percent as analyzed on January 3, 2017. This is one of the more significant five-week reductions of drought coverage in the record. The improvements were largely in the southeastern U.S., from the Appalachian Plateau to the Gulf Coast.
Precipitation and Drought
December Statewide Precipitation Ranks (top)
and Grid Precipitation Anomalies Map (bottom)
U.S. State Climate Summaries
- Today NOAA is also releasing a set of climate summaries for all 50 U.S. states. The summaries, which focus on characteristics of the physical climate and coastal issues in accordance with NOAA's mission, include three Key Messages highlighting important trends and projections, seven to ten figures presenting data on key climate variables, and narrative text providing details and context on observed trends, projected changes, and selected climate impacts relevant to that state.
This temperature and precipitation analysis is based on data back to 1895, resulting in 122 years of data. Data for 2016 should be considered preliminary. The most up-to-date temperature and precipitation data is available through NCEI's Climate at a Glance.
For extended analysis of regional temperature and precipitation patterns, as well as extreme events, please see our full report that will be released on January 09th.