Monthly Report Summary Information
The Monthly Report Summary Information is a synopsis of the collection of national and global summaries released each month.
National Summary Information - August 2016
See Full Report
For extended analysis of regional temperature and precipitation patterns,as well as extreme events, please see our full report that will be released on September 13th.
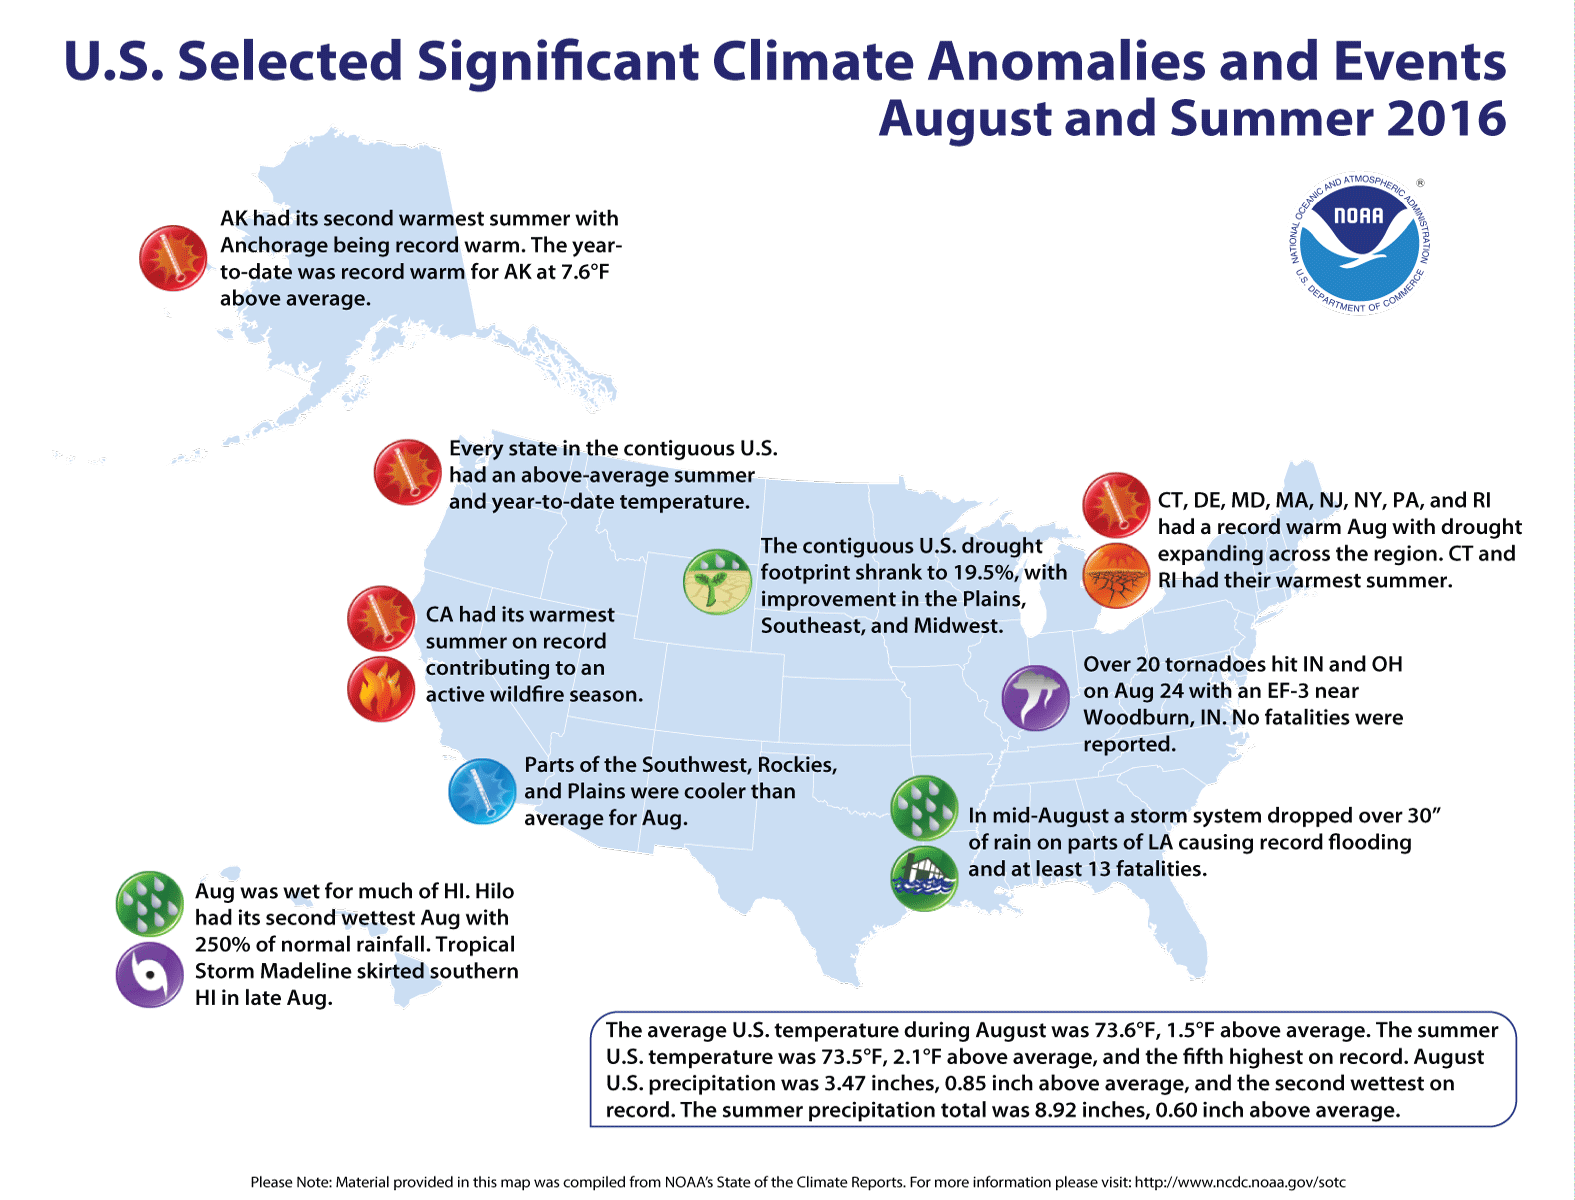
Significant climate events for August 2016
U.S. experiences fifth warmest summer
Lower 48 also had third warmest year to date, warmer than average August
The summer (June-August) temperature for the contiguous U.S. was 73.5°F, or 2.1°F above the 20th century average, tying 2006 as the fifth warmest in the 122-year period of record. The August temperature was 73.6°F, 1.5°F above the 20th century average, making it the 17th warmest on record. During August, record warmth was observed across the Northeast with below-average temperatures in the Southwest. The year-to-date (January-August) contiguous U.S. average temperature was 56.7°F, 2.8°F above average. Alaska continued to be record warm for the first eight months of 2016.
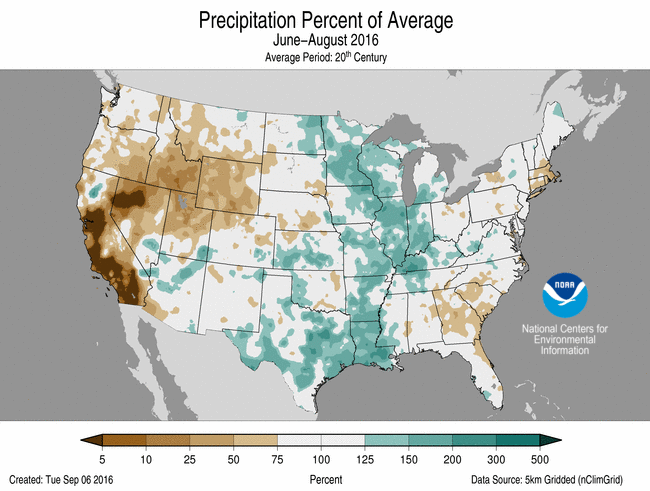
The summer (June-August) precipitation total for the contiguous U.S. was 8.92 inches, 0.60 inch above average, and tied 1923 as the 24th wettest in the 122-year period of record. The August precipitation total for the contiguous U.S. was 3.47 inches, 0.85 inch above the 20th century average, and the second wettest on record. Record rainfall was observed across parts of the Midwest and in Louisiana where historic flooding devastated parts of the state. The year-to-date (January-August) contiguous U.S. precipitation total was 22.03 inches, 1.32 inch above average, and the 25th wettest.
This analysis of U.S. temperature and precipitation is based on data back to January 1895, resulting in 122 years of data.
Supplemental August/summer 2016 Information
- Summer station temperatures
- Summer station precipitation totals
- Summer 2016 record setters
- Summer 100-degree days
- August/summer temperature and precipitation grid rank maps
- Summer dew points
- Regional warmest summers
U.S. climate highlights: summer (June-August)
Temperature
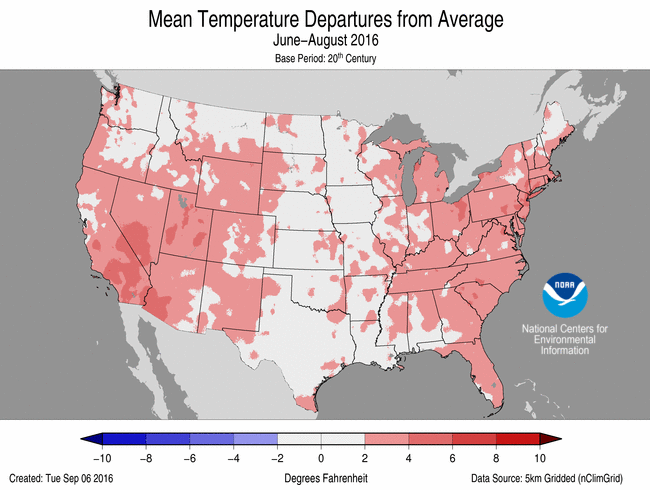
Jun-Aug Temperature Departure from Average
(top) and Precipitation Percent of Average (bottom)
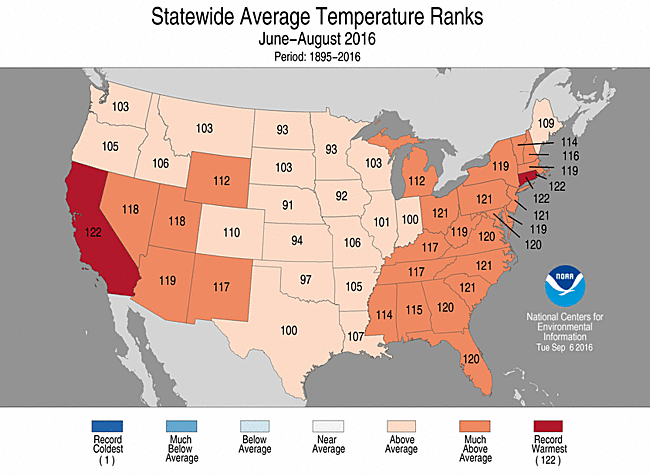
- Above-average temperatures spanned the nation during summer. Every state across the contiguous U.S., had a statewide temperature that was above average. Twenty-nine states across the West and in the East were much warmer than average.
- California, Connecticut and Rhode Island each had their warmest summer on record. The California statewide average temperature was 75.5°F, 3.3°F above average, the Connecticut statewide average temperature was 71.9°F, 3.7°F above average, and the Rhode Island statewide average temperature was 71.6°F, 3.7°F above average.
- Alaska observed its second warmest summer in its 92-year record at 53.6°F, 3.0°F above average. Only the summer of 2004 was warmer with a statewide temperature value of 55.9°F. Several locations across the state were record warm including Anchorage, Kenai, King Salmon and Yakutat.
Precipitation
- Above-average precipitation was widespread across the Midwest and Lower Mississippi Valley where eight states were much wetter than average.
- Below-average precipitation was observed across the West, Southeast and Northeast where six states were much drier than average. No state had a summer precipitation total that was record wet or dry.
Extremes
- The U.S. Climate Extremes Index (USCEI) for the summer was 15 percent above average and the 22nd highest value on record. On the national scale, extremes in warm maximum and minimum temperatures were much above average. The USCEI is an index that tracks extremes (falling in the upper or lower 10 percent of the record) in land-falling tropical cyclones, temperature, precipitation and drought across the contiguous U.S.
U.S. climate highlights: August
Temperature

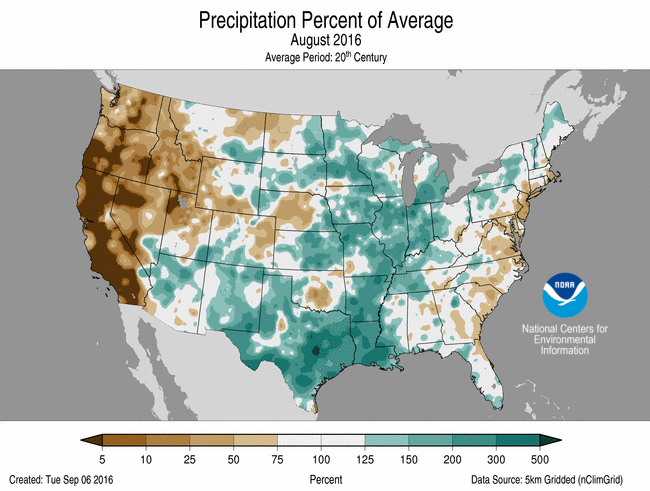
August 2016 Temperature Departure from Average
(top) and Precipitation Percent of Average (bottom)
- Above-average temperatures were observed along both coasts. Twenty-four states were much warmer than average, eight of which — Connecticut, Delaware Maryland, Massachusetts, New Jersey, New York Pennsylvania and Rhode Island — were record warm. Alaska had its third warmest August with a statewide temperature 3.8°F above average.
- Below-average temperatures were observed for parts of the Great Plains, Rocky Mountains and Southwest. Above-average precipitation across those regions suppressed daytime temperatures.
Precipitation
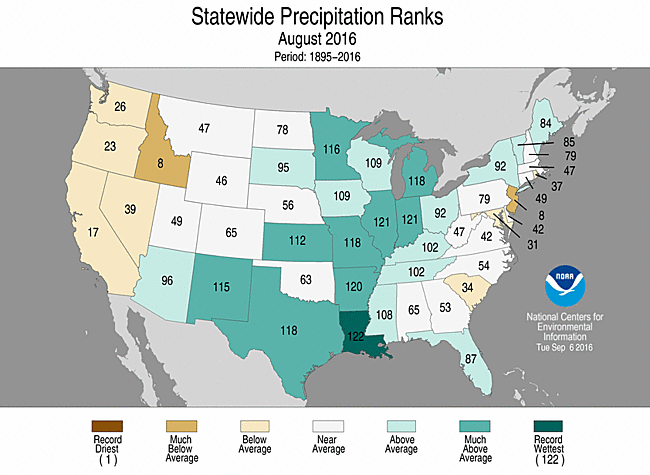
- The contiguous U.S. precipitation total of 3.47 inches was second only to 1977. Record and near-record precipitation was observed across parts of the Southwest, Southern Plains and Midwest. Ten states had monthly precipitation totals that were much above-average with the Louisiana precipitation total record high. The Louisiana statewide precipitation total was 12.91 inches, 8.27 inches above average, and surpassed the previous record of 9.71 inches in 1948.
- In mid-August, a nearly stationary low pressure system dumped torrential rainfall across southern Louisiana causing record flooding for large parts of the state. Precipitation totals over 20 inches were widespread with localized totals exceeding 30 inches. The U.S. Climate Reference Network (USCRN) station at Lafayette, Louisiana received 22.89 inches on the 11th and 12th, setting a new record for highest two-day precipitation total for any USCRN station in the contiguous U.S. The record flooding contributed to at least 13 fatalities.
- Below-average precipitation was observed across parts of the East Coast and the West. Dry conditions continued in the West contributed to ideal wildfire conditions, with over 100 homes destroyed by wildfires in California where the Chimney and Blue Cut fires cumulatively charred over 82,000 acres.
- Several weather systems brought heavy precipitation to Hawaii during August, including Tropical Storm Madeline, which brushed southern parts of the state at the end of the month. Hilo observed 24.68 inches of precipitation, marking the fourth wettest August for the city. The rainfall helped to alleviate drought for most of the Big Island with only 5.8 percent of the state experiencing drought conditions by month's end.
- According to the August 30 U.S. Drought Monitor report, 19.5 percent of the contiguous U.S. was in drought, down about 1.6 percent compared to the beginning of August. Drought conditions worsened and expanded across parts of the Southeast, Northeast, and Northern Rockies. Drought reduction was observed across parts of the Great Plains, Southeast and Midwest.
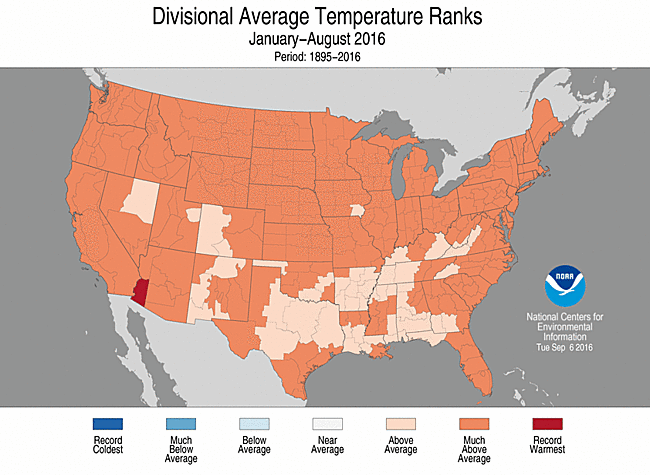
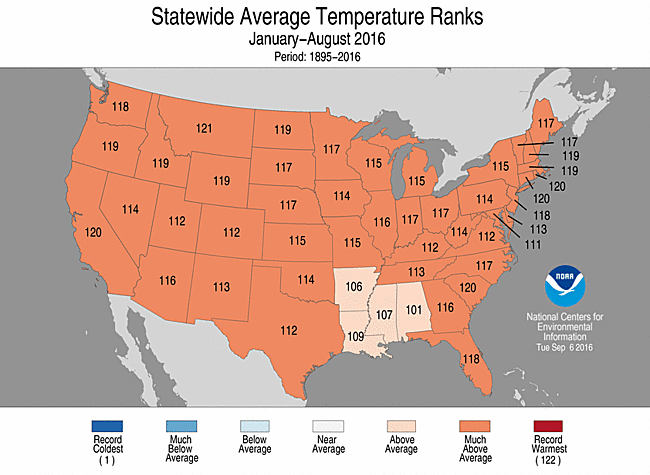
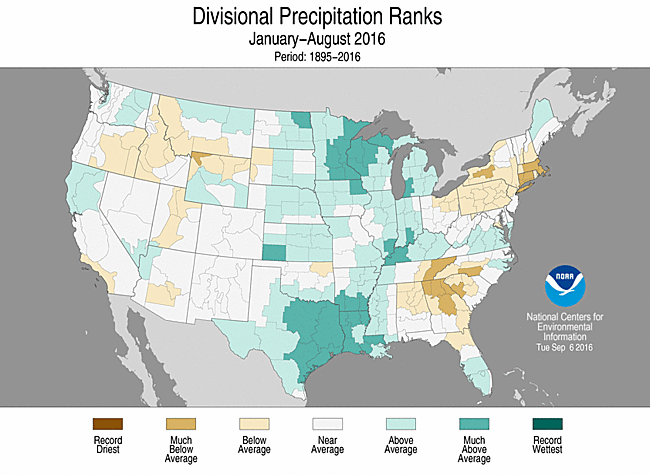
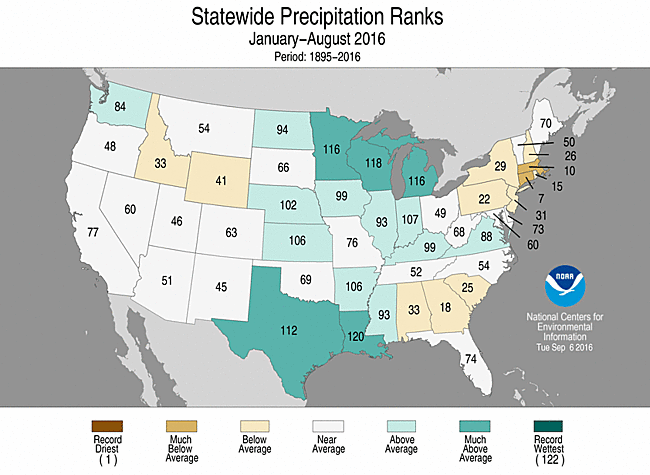
U.S. climate highlights: year-to-date (January-August)
Temperature
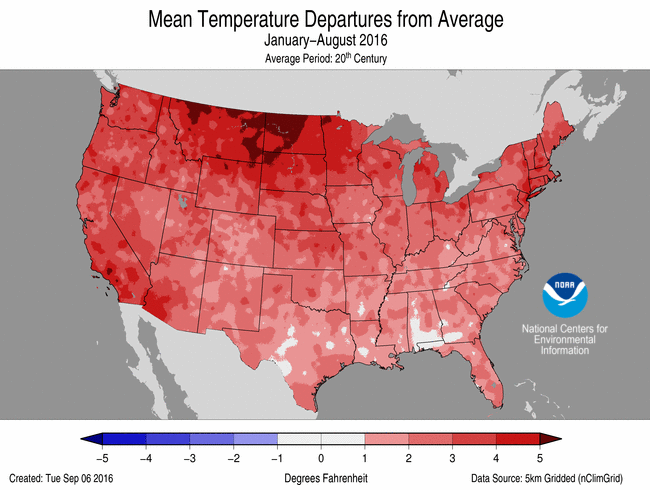
Jan-Aug Temperature Departure from Average
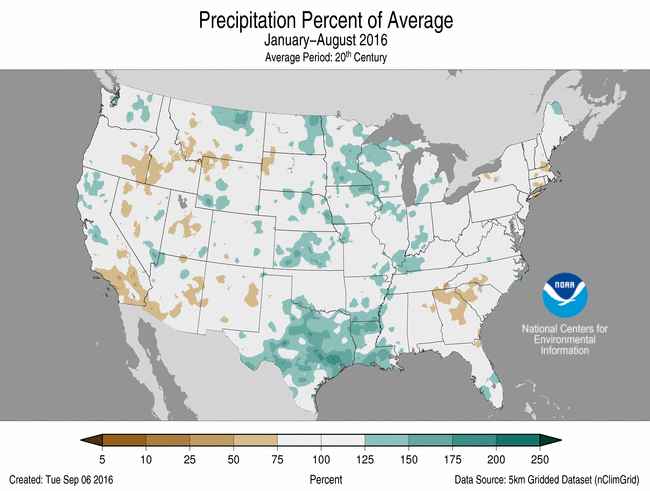
(top) and Precipitation Percent of Average (bottom)
- Much like summer, above-average temperatures spanned the contiguous U.S. for the year-to-date. Forty-five states observed much above average temperatures for the first eight months of the year, contributing to the third warmest year-to-date on record. Only 2006 and 2012 were warmer. No state in the contiguous U.S. had a record warm year-to-date.
- The Alaska year-to-date temperature was 36.4°F, 7.6°F above average, surpassing the previous record warm January-August of 1981 by 3.0°F. Record and near-record warmth engulfed Alaska for much of 2016.
Precipitation
- Above-average precipitation was observed across parts of the Great Plains, Lower Mississippi Valley, Midwest, Northwest and Mid-Atlantic, where five states were much wetter than average. Below-average precipitation fell across the Northern Rockies, Southeast and Northeast where two states were much drier than average. No state was record wet or dry for the year-to-date.
Extremes
- The USCEI for the year-to-date was 55 percent above average and the 10th highest value on record. On the national scale, extremes in warm maximum and minimum temperatures, the spatial extent of wetness and one-day precipitation totals were much above average.
For extended analysis of regional temperature and precipitation patterns, as well as extreme events, please see our full report that will be released on September 13th.