Monthly Report Summary Information
The Monthly Report Summary Information is a synopsis of the collection of national and global summaries released each month.
National Summary Information - October 2012
See Full Report
U.S. temperature and precipitation in October were near average
Sandy breaks records in East while severe drought continues in West
The average temperature for the contiguous U.S. during October was 53.9°F, 0.3°F below the long-term average, ending a 16-month streak of above-average temperatures for the lower 48 that began in June 2011.
The October nationally averaged precipitation total of 2.19 inches was slightly above the long-term average. The Northwest, Midwest, and Northeast were wetter than average, while below-average precipitation was observed across the Southern Rockies and the Central and Southern Plains. As of October 30, 60.2 percent of the contiguous U.S. was experiencing drought conditions with the most severe conditions in the Great Plains.

Significant climate events for October 2012.
Click image to enlarge, or click here for the National Overview.
Note: The October Monthly Climate Report for the United States has several pages of supplemental information and data regarding some of the exceptional events from the month and season.
Post-Tropical Cyclone Sandy
- Sandy made landfall near Atlantic City, N.J. on October 29 after it transitioned from a tropical to a post-tropical cyclone. The storm had maximum sustained winds of 80 miles per hour and a central minimum pressure of 946 millibars at landfall. This preliminary pressure reading was potentially a record low for the Northeast coast, and is pending further review. Sandy's large size, with tropical storm force winds extending nearly 500 miles from the center, led to more than 100 fatalities, large-scale flooding, wind damage, and mass power outages in the Mid-Atlantic and Northeast.
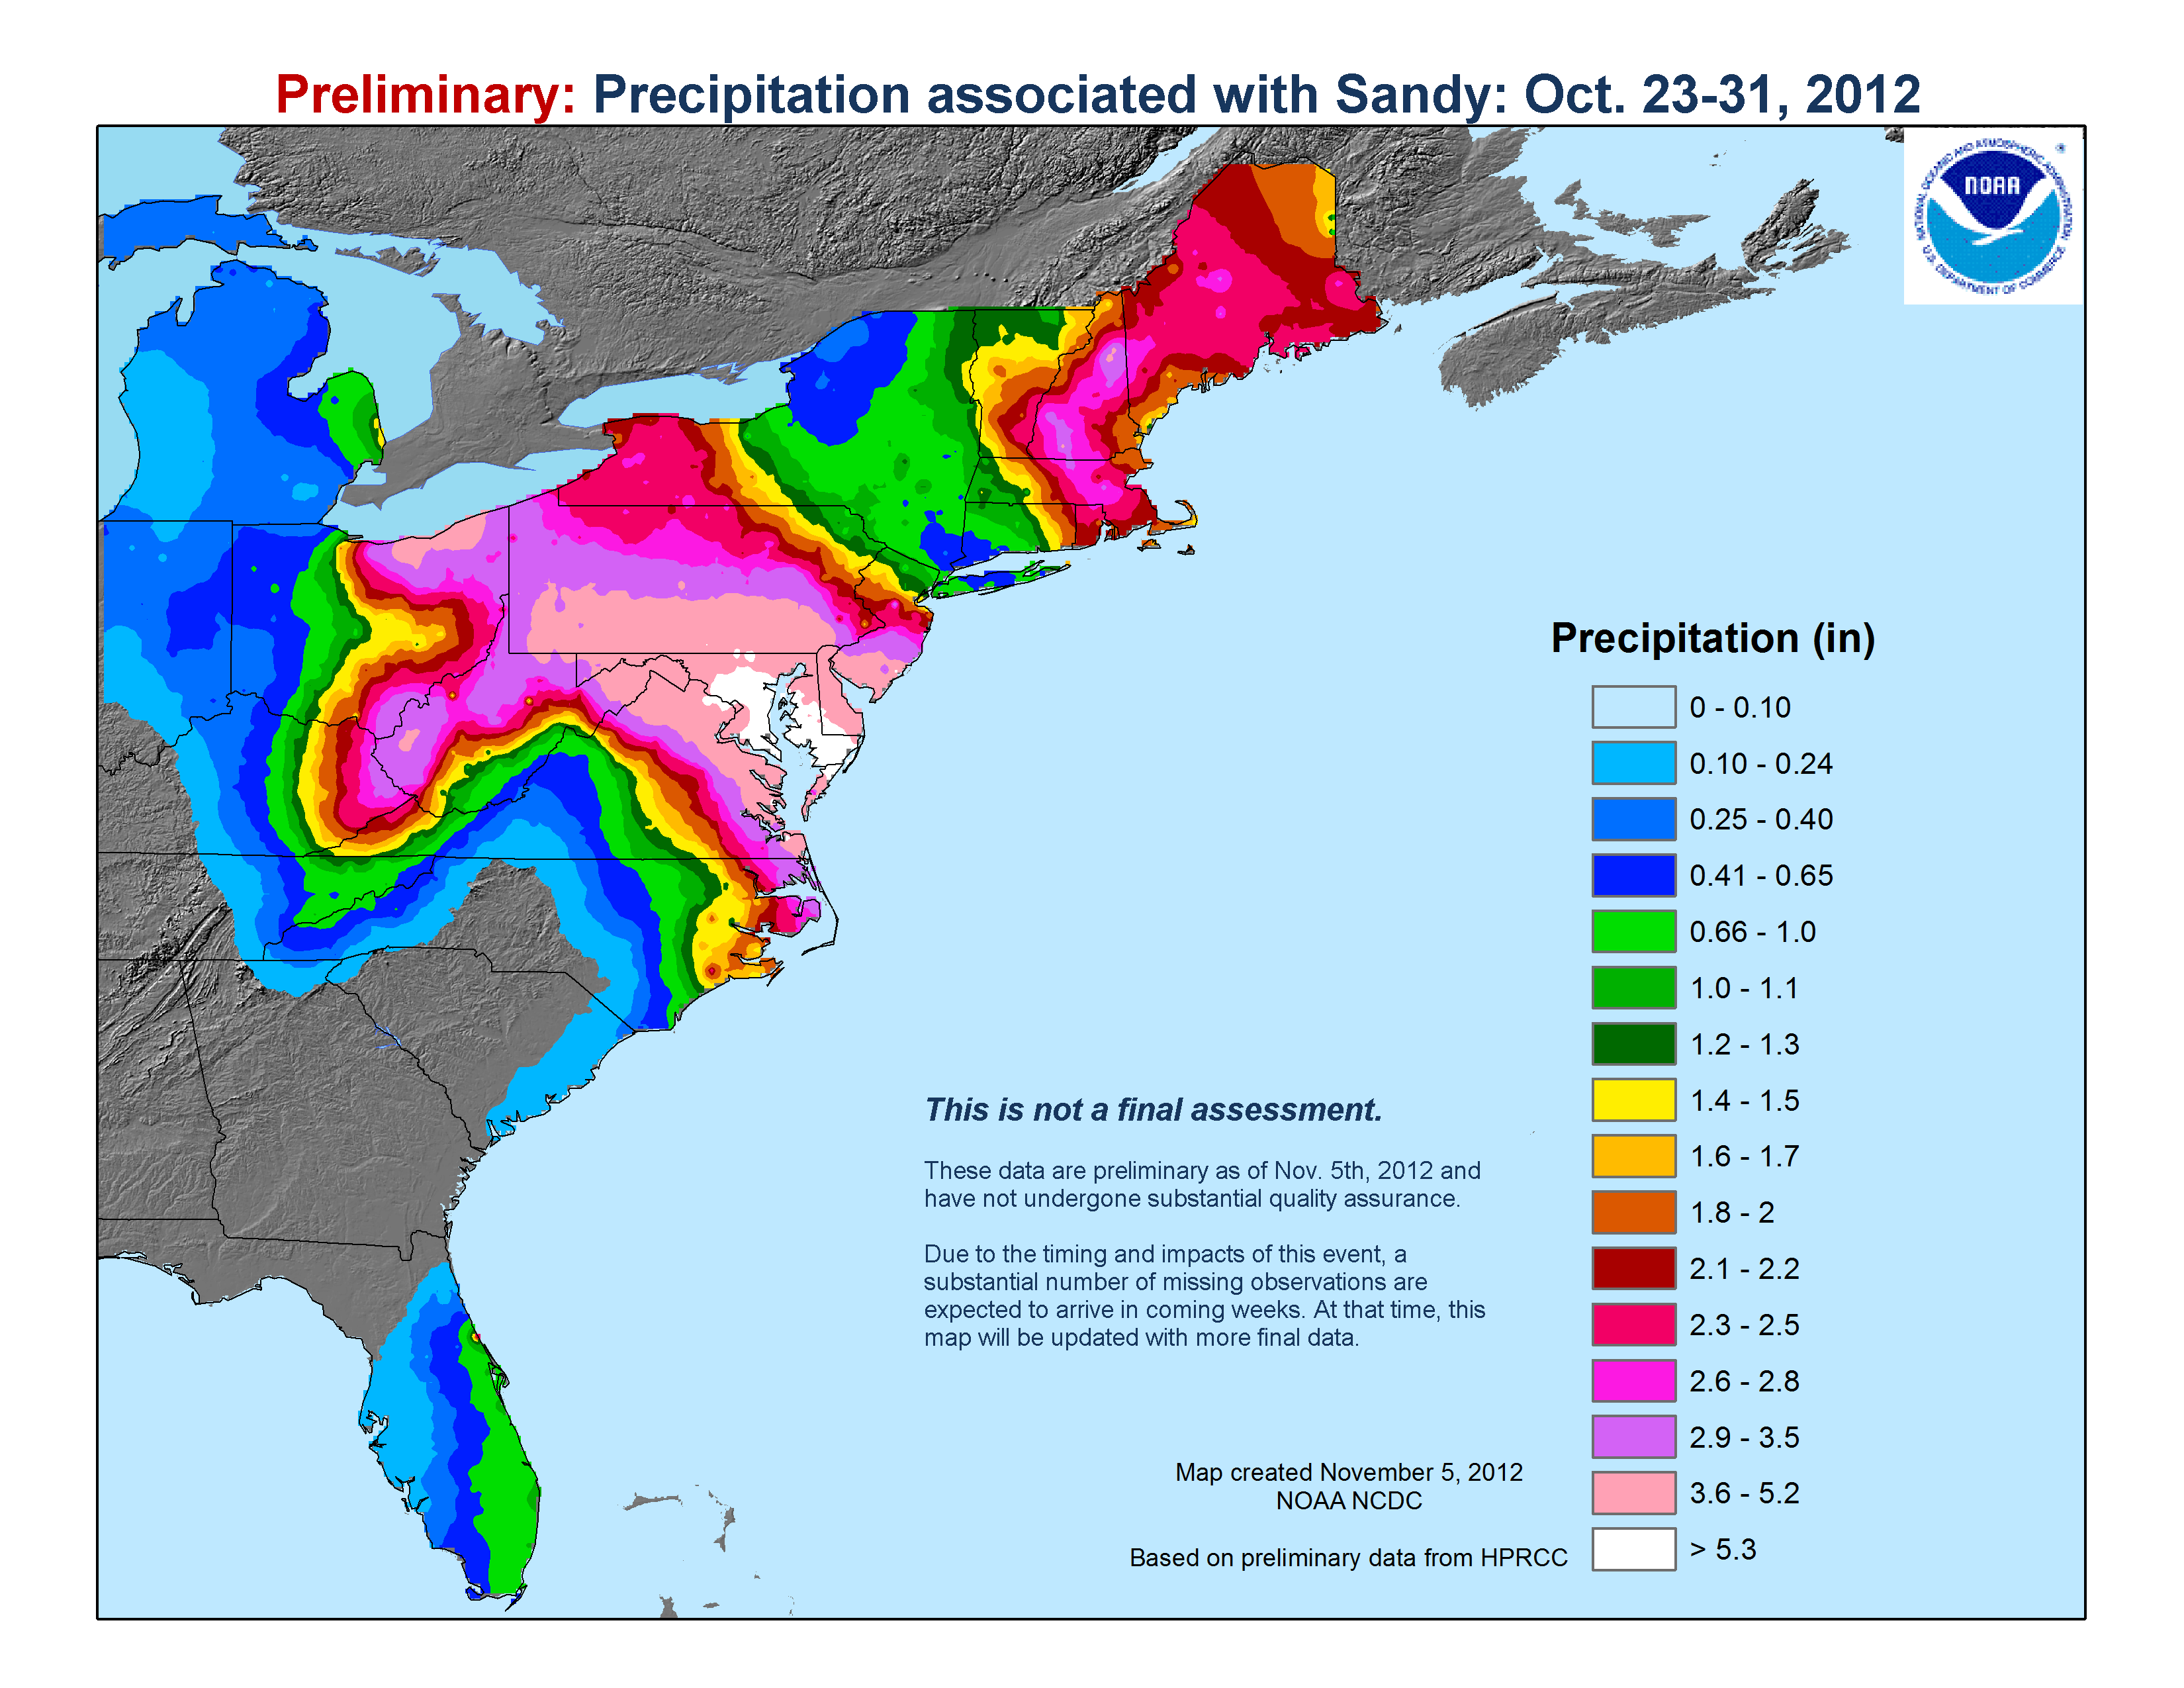
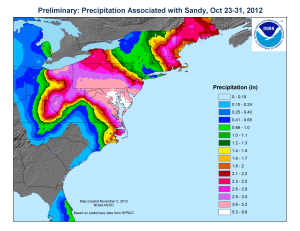 Precipitation associated with Sandy (preliminary)
- Sandy brought large storm surge and high water levels to much of the coastal Northeast with New Jersey, New York and Connecticut particularly hard hit. The 13.88-foot observed water level at The Battery in New York City was an all-time record for the location, smashing the previous record set in 1960 during Hurricane Donna by more than three feet. The Delaware River in Philadelphia also reached a new record high water level of 10.6 feet, surpassing the previous record of 10.5 feet which was set in April 2011 from record rainfall. This new record was due to a combination of heavy precipitation and storm surge.
- Sandy also brought blizzard conditions to the Central and Southern Appalachians, where over a foot of snow fell in six states from North Carolina to Pennsylvania, shattering all-time October monthly and single storm snowfall records. Snowfall totals across the highest elevations approached three feet.
U.S. climate highlights: October
-
Below-average temperatures stretched from the Canadian border to the Gulf of Mexico during October with 19 states having monthly temperatures below their 20th century averages. The Southwest and the Northeast were the only two areas of the country with above average temperatures.

 October 2012 Statewide Temperature (top) and Precipitation (bottom) ranks
- Wetter-than-average conditions stretched from the Northwest, through the Northern Plains, into the Midwest and the Northeast. Washington, Michigan, Ohio, Maryland, Delaware, New Jersey and Maine had October precipitation totals among their ten wettest. Below-average precipitation was observed across the Southern Rockies and Central and Southern Plains. Texas had its ninth driest October on record.
- The U.S. Drought Monitor from October 30th, 2012 showed 60.2 percent of the contiguous U.S. experiencing moderate-to-exceptional drought, smaller than the 64.6 percent at the beginning of October. Drought conditions improved slightly across parts of the Midwest and Central Plains, while drought conditions worsened across the Northern Rockies.
U.S. climate highlights: year-to-date (January-October)
- The January-October period was the warmest first ten months of any year on record for the contiguous U.S. The national temperature of 58.4°F was 3.4°F above the 20th century average, and 1.1°F above the previous record warm January-October of 2000. During the 10-month period, 21 states were record warm and an additional 25 states had year-to-date temperatures among their ten warmest. Only Washington had a statewide temperature near average for the period.
- January-October 2012 was the 16th driest such period on record for the contiguous U.S. with a precipitation total 1.9 inches below the average of 24.78 inches.
- Drier-than-average conditions were present from the Southwest, through the Rockies, across the Plains and into the Midwest. Nebraska and Wyoming were both record dry for the period. Nebraska's statewide precipitation total of 11.92 inches was 9.4 inches below average, while Wyoming's precipitation of 6.57 inches was 5.2 inches below average.
- The Gulf Coast, parts of the Northeast and the Pacific Northwest were wetter than average during January-October. Washington's year-to-date precipitation total was 33.23 inches, 7.36 inches above average, and the fourth wettest January-October on record.
- The U.S. Climate Extremes Index (USCEI), an index that tracks the highest and lowest 10 percent of extremes in temperature, precipitation, drought and tropical cyclones across the contiguous U.S., was nearly twice the average value during the January-October period, and marked the second highest USCEI value for the period. Extremes in warm daytime temperatures, warm nighttime temperatures, and the spatial extent of drought conditions contributed to the record high USCEI value.

This graphic shows the calendar-year temperature outcomes based upon observed January-through-October temperatures, and eight historical scenarios for October-through-December. Click here for more information.