Monthly Report Summary Information
The Monthly Report Summary Information is a synopsis of the collection of national and global summaries released each month.
National Summary Information - September 2012
See Full Report
Please Note: the US national ('CONUS') temperatures associated with the September 2012 release were initially incorrect. NCDC personnel used an incorrect base period as the basis of their calculation. This error was corrected on October 19, 2012. The general character of monthly temperature anomalies (departures from normal) and associated trends were not affected by this error, as it applied equally to all Septembers on the record. The slight changes in the anomalies and associated ranks with the October 19 correction are reflective of late-arriving data, and are typical. The statistics in this report were updated on October 19, 2012.
Contiguous U.S. experiences warmer than average September
Record and near-record dryness across the Northern Plains and Northwest created ideal wildfire conditions during September.
The average temperature for the contiguous U.S. during September was 66.3°F, 1.5°F above the long-term average, marking the 18th warmest such month on record. September 2012 marks the 16th consecutive month with above average temperatures for the Lower 48.
The September nationally-averaged precipitation total of 2.40 inches was slightly below the long-term average. The Northern Plains, Northern Rockies, and Northwest were record and near-record dry for the month. Much above-average precipitation was observed in the Ohio Valley. As of October 2nd, 64.6 percent of the contiguous U.S. continued to experience drought conditions.
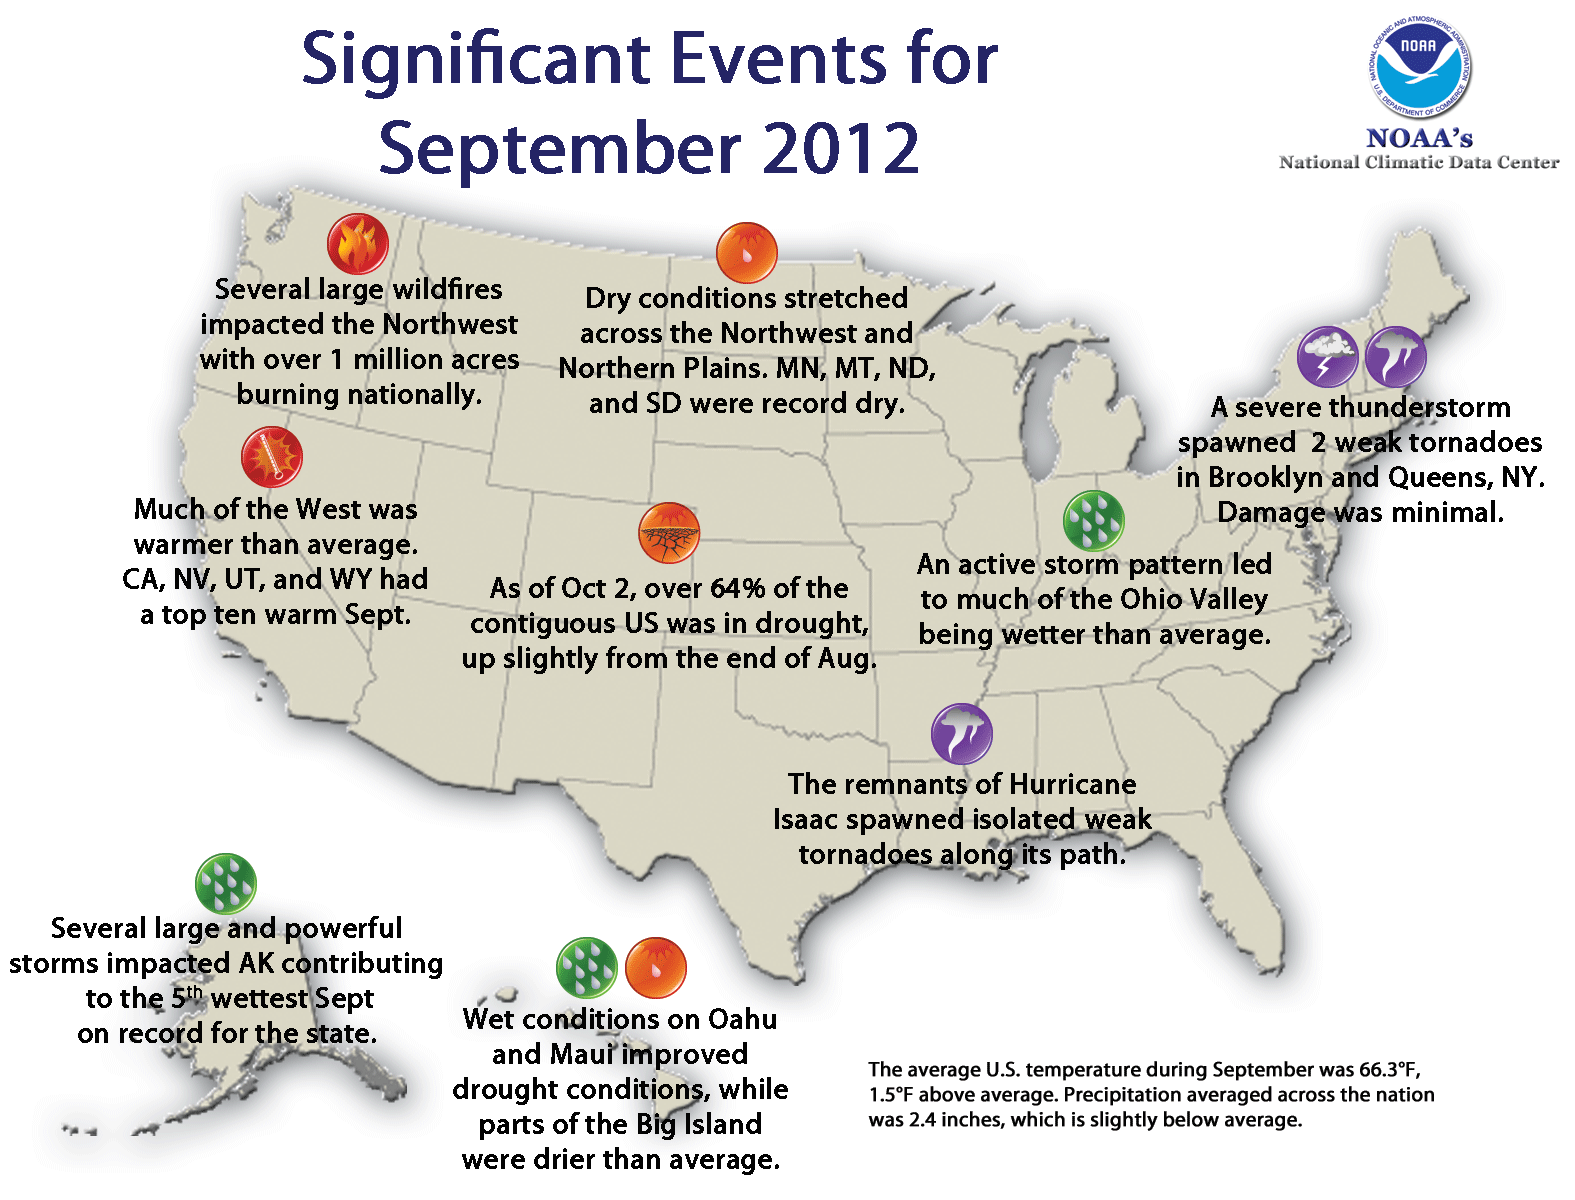
Significant climate events for September 2012.
Click image to enlarge, or click here for the National Overview.
Note: The September Monthly Climate Report for the United States has several pages of supplemental information and data regarding some of the exceptional events from the month and season.
U.S. climate highlights: September
- Ohio Valley.

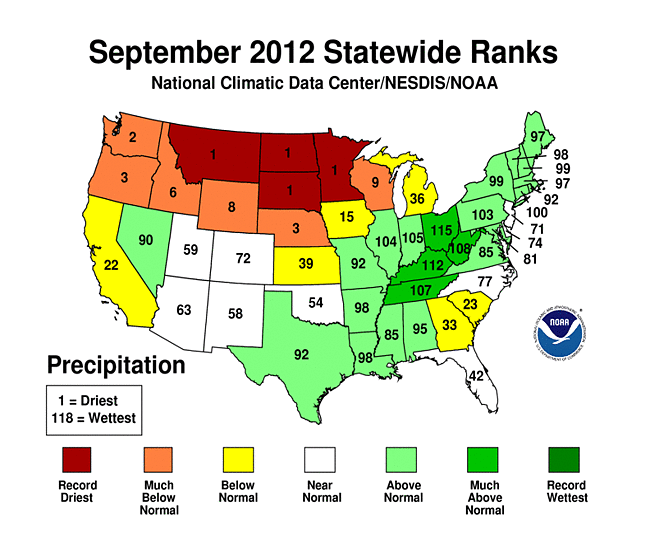 September 2012 Statewide Temperature (top) and Precipitation (bottom) ranks
- Record and near-record dry conditions were experienced from the Wisconsin, had precipitation totals among their ten driest.
- The Kentucky both had monthly precipitation totals ranking among their ten wettest.
- Several large extra-tropical cyclones affected Alaska during September, bringing heavy precipitation to the state. The Alaskan statewide average precipitation was 48 percent above the 30-year average, and ranked as the 5th wettest September in its 95-year period of record.
- According to the October 2, 2012 U.S. Drought Monitor, 64.6 percent of the contiguous U.S. was experiencing moderate-to-exceptional drought, slightly larger than the extent of drought at the end of August. The percent area of the nation experiencing exceptional drought, the worst category of drought, remained nearly constant at about 6 percent. Exceptional drought conditions improved across the Lower-Mississippi Valley and Ohio Valley, while drought conditions deteriorated across the Central and Northern Plains.
- The warm and dry conditions across the Northwest were associated with another month of above-average wildfire activity. Nationally, nearly 1.1 million acres burned during September, the 3rd most on record for the month. Idaho, Montana, Oregon, and Washington experienced the brunt of the large wildfire activity.
U.S. climate highlights: warm season (April-September)
- The contiguous U.S. warm season, defined as the six-month period from April-September, had temperatures that were record warm. The six-month average temperature of 67.6°F for the Lower 48 was 2.7°F above average. The previous warmest April-September occurred in 2006 when the nationally-averaged temperature was 67.0°F.
- The warm season brought Wyoming were both record warm with temperatures 4.2°F and 4.4°F above average, respectively.
- The April-September period was the 14th driest on record for the contiguous U.S. with a national precipitation total of 14.41 inches, 1.62 inches below average. Wyoming were both record dry for the period. Nebraska's statewide precipitation total of 9.24 inches was 8.16 inches below average, while Wyoming's precipitation total of 3.98 inches was 4.5 inches below average.
- The U.S. Climate Extremes Index (USCEI), an index that tracks the highest and lowest 10 percent of extremes in temperature, precipitation, drought and tropical cyclones across the contiguous U.S., was more than twice the average value during the warm season, and marked the highest USCEI value for the six-month period. Extremes in warm daytime temperatures, warm nighttime temperatures, and the spatial extent of extreme drought contributed to the record high USCEI value, based on data from 1910-2012.
U.S. climate highlights: year-to-date (January-September)
- The January-September period was the warmest first nine months of any year on record for the contiguous United States. The national temperature of 58.9°F was 3.8°F above the 20th century average, and 1.3°F above the previous record warm January-September of 2006. During the nine-month period, Washington had statewide temperatures near average for the period.
- January-September 2012 was the 11th driest such period on record for the contiguous U.S. with a precipitation total 1.98 inches below the average of 22.67 inches. The Wetter-than-average conditions were observed along the Gulf Coast and in the Pacific Northwest.
- The USCEI was more than twice the average value during the January-September period, and marked the highest USCEI value for the period. Extremes in warm daytime temperatures and warm nighttime temperatures contributed to the record high USCEI value.

This graphic shows the calendar-year temperature outcomes based upon observed January-through-September temperatures, and eight historical scenarios for October-through-December. Click here for more information.
U.S. climate highlights: 12-month Period (October 2011 - September 2012)
- The October 2011-September 2012 period was the warmest such 12-month period on record for the contiguous U.S., with an average temperature of 55.3°F, 3.3°F above average. This 12-month temperature average was the 3rd warmest of any 12-month period on record for the contiguous United States. The six warmest 12-month periods have all ended during 2012.