Monthly Report Summary Information
The Monthly Report Summary Information is a synopsis of the collection of national and global summaries released each month.
Global Summary Information - January 2014
See Full Report
January Global Temperature Fourth Highest on Record
According to NOAA scientists, the globally-averaged temperature over land and ocean surfaces for January 2014 was the highest since 2007 and the fourth highest for January since reliable record keeping began in 1880. It also marked the 38th consecutive January and 347th consecutive month (almost 29 years) with a global temperature above the 20th century average. The last below-average January global temperature was January 1976 and the last below-average global temperature for any month was February 1985.
Most areas of the world experienced warmer-than-average monthly temperatures, with the most notable warmth across Alaska, western Canada, southern Greenland, south-central Russia, Mongolia, and northern China. Parts of southeastern Brazil and central and southern Africa experienced record warmth, contributing to the warmest January Southern Hemisphere land temperature departure on record at 2.03°F (1.13°C) above the 20th century average. Temperature departures were below the long-term average across the eastern half of the contiguous U.S, Mexico, and much of Russia. However, no regions of the globe were record cold.
January 2014 Global temperature highlights
- The combined average temperature over global land and ocean surfaces for January was the warmest since 2007 and the fourth warmest for January at 54.8°F (12.7°C), or 1.17°F (0.65°C), above the 20th century average of 53.6°F (12.0°C). The margin of error associated with this temperature is ± 0.14°F (± 0.08°C).
- The global land temperature was the highest since 2007 and the fourth highest on record for January, at 2.11°F (1.17°C) above the 20th century average of 37.0°F (2.8°C). The margin of error is ± 0.32°F (± 0.18°C).
- Spain experienced its warmest January since 1996 and the third warmest since national records began in 1961, with a temperature of 48.2°F (9°C) or 3.6°F (2°C) above the 1971–2000 average.
- France's nationally-averaged January 2014 temperature was 4.9°F (2.7°C) above the 1981–2010 average, tying with 1988 and 1936 as the warmest January on record.
- The January temperature in Switzerland was 4.3°F (2.4°C) above the 1981–2010 average—the fifth warmest since national records began 150 years ago.
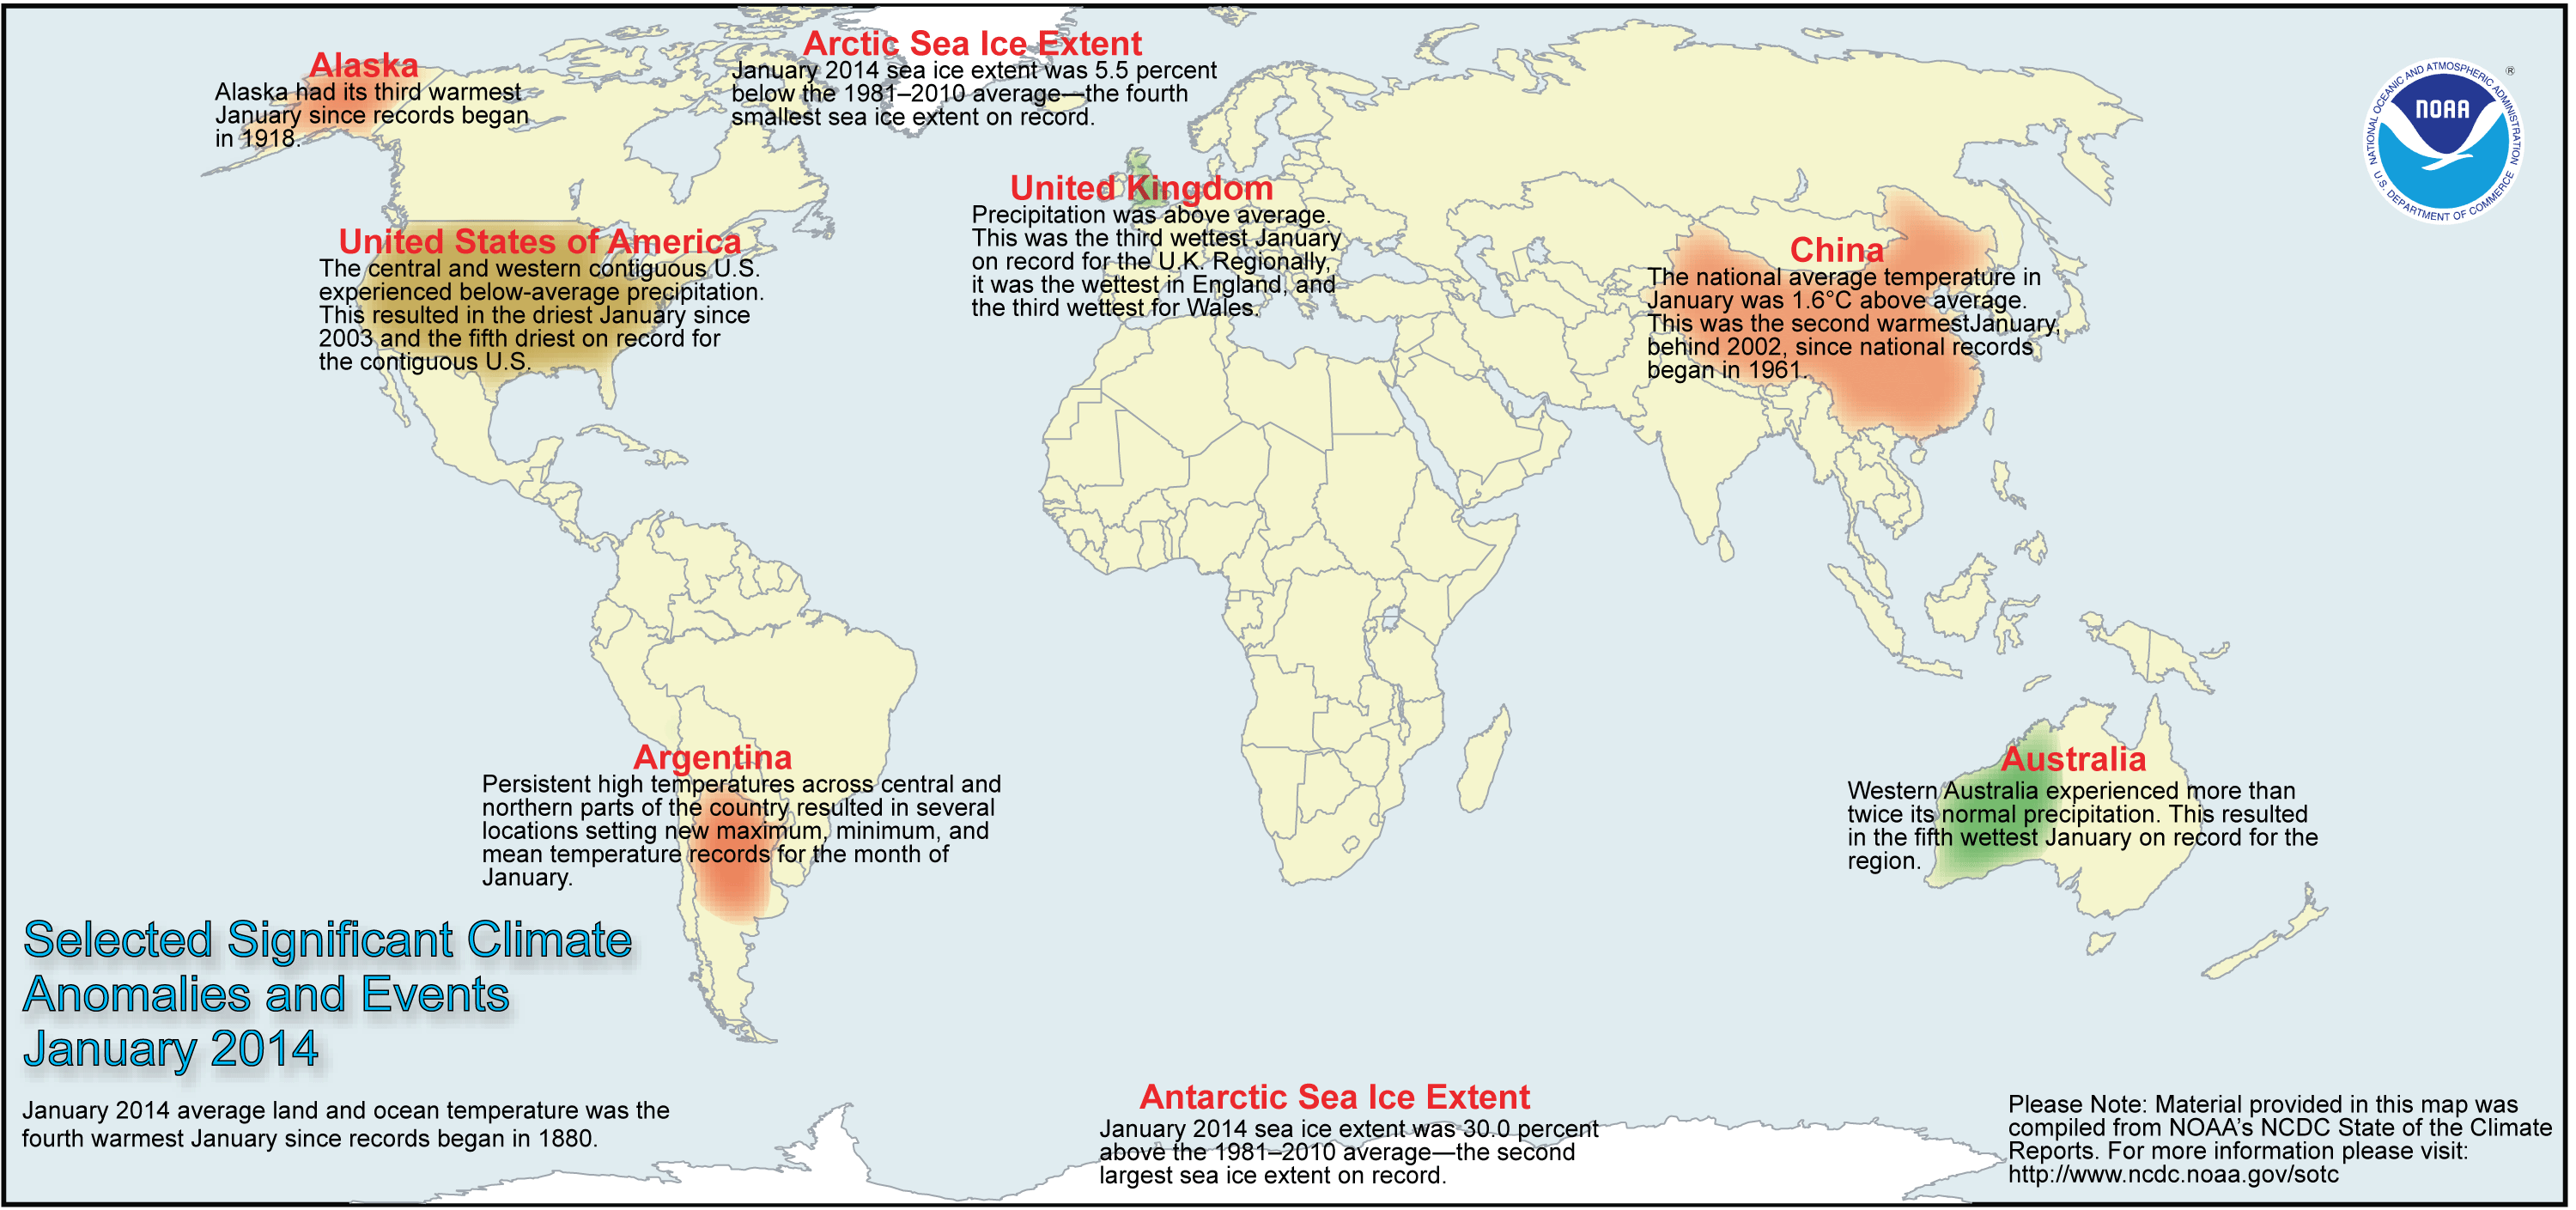
- China, as a whole, recorded an average temperature of 25.9°F (-3.4°C) or 2.9°F (1.6°C) above average during January 2014. This was the second highest January value, behind 2002, since national records began in 1961.
- Warm temperatures engulfed much of Australia during January 2014. Overall, the national average mean temperature was 1.64°F (0.91°C) above the 1961–1990 average. This was the 12th highest January since national records began in 1910. Regionally, the January 2014 temperature ranked among the top 10 warmest in Queensland, Victoria, and South Australia.
- For the ocean, the January global sea surface temperature was 0.83°F (0.46°C) above the 20th century average of 60.5°F (15.8°C), the highest since 2010 and seventh highest on record for January. The margin of error is ± 0.07°F (± 0.04°C).
- Neither El Niño nor La Niña conditions were present across the central and eastern equatorial Pacific Ocean during January. According to NOAA's Climate Prediction Center, neutral conditions are expected to continue through the Northern Hemisphere spring 2014.
Some temperature highlights include:
January 2014 Precipitation highlights
- Precipitation varied greatly around the globe during January. Much-drier-than-average conditions were present across southern and southwestern contiguous U.S., northeastern Brazil, parts of Chile, southern China, and parts of southeastern Australia and central Africa. Much-wetter-than-average conditions were observed across northern Argentina, northwestern Africa, central Russia, and the British Isles.
-
- Below-average precipitation dominated most of the central and western contiguous U.S. This resulted in the driest January since 2003 and the fifth driest on record.
- Precipitation was above average across the United Kingdom. The nation received 51 percent above average precipitation during January, marking the third-wettest January on record.
- Averaged nationally, precipitation was 17 percent above-average in Australia during January 2014. However, most of the precipitation was concentrated in Western Australia, which experienced more than twice its normal precipitation?the fifth wettest January on record for the region.
January 2014 snow and polar ice highlights
- According to data from the National Snow and Ice Data Center, the average January Arctic sea ice extent was 5.30 million square miles, 310,000 square miles (5.5 percent) below the 1981–2010 average of 5.61 million square miles. This was the fourth smallest January Arctic sea ice extent since satellite records began in 1979.
-
- The January Antarctic sea ice extent of 2.59 million square miles was 600,000 square miles (30.0 percent) above the 1981–2010 average of 1.99 million square miles. This was the second largest January Antarctic sea ice extent on record, behind only January 2008.
- The globally combined Arctic and Antarctic sea ice extent during January was 7.89 million square miles, 290,000 square miles (3.8 percent) above the 1981–2010 average of 7.60 million square miles. The global sea ice extent during January was the seventh largest since records began in 1979 and was the largest since 2008.
- According to climate analysis from the Rutgers Global Snow Lab using NOAA data, the Northern Hemisphere snow cover extent during January was 17.77 million square miles, 330,000 square miles (1.8 percent) below the 1981–2010 average of 18.10 million square miles, and the 10th smallest January snow cover extent in the 48-year period of record. This was the smallest January snow cover extent for the Northern Hemisphere since 2007. Both North American and Eurasian snow cover extents were below average.
 NOAA's National Centers for Environmental Information


