Monthly Report Summary Information
The Monthly Report Summary Information is a synopsis of the collection of national and global summaries released each month.
Global Summary Information - July 2013
See Full Report
July 2013 global temperatures sixth highest on record
The globally-averaged temperature for July 2013 was the sixth highest for July since record keeping began in 1880. July 2013 also marks the 37th consecutive July and 341st consecutive month with a global temperature above the 20th century average.
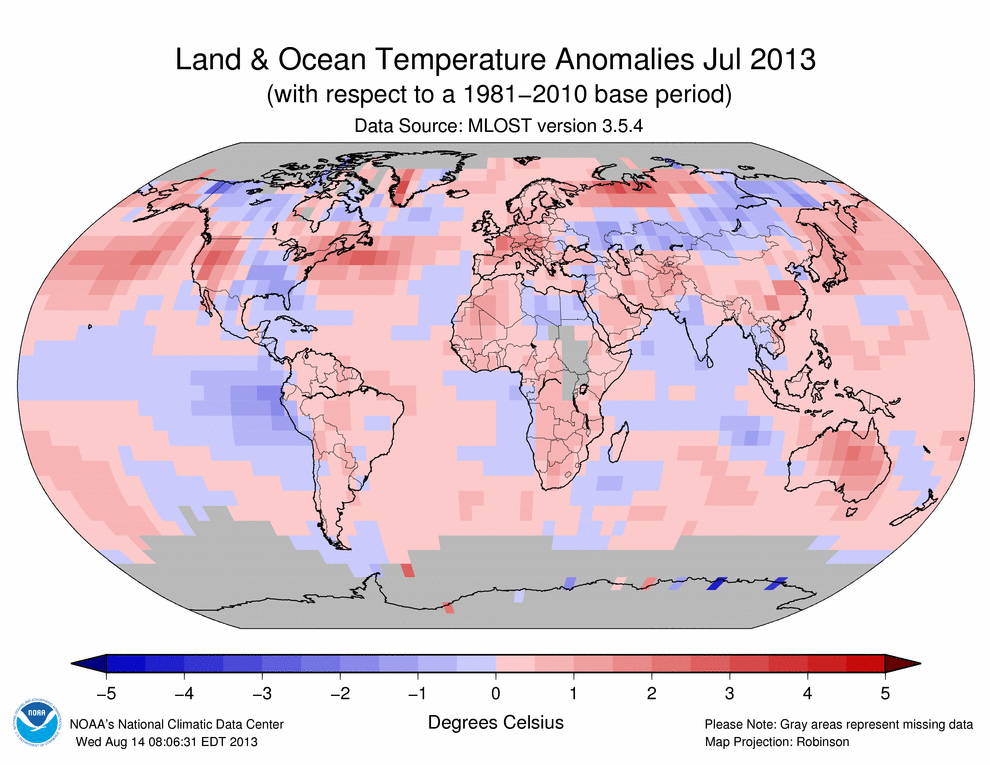
Many areas of the world experienced higher-than-average monthly temperatures, northern South America, the western and northeastern United States, much of Africa, western and central Europe, parts of southern Asia, and most of Australia. Parts of the central and southeastern United States, small regions across northern Canada, eastern Greenland, and parts of Mongolia and eastern Siberia were cooler than average. Far northwestern Canada and part of the eastern United States were much cooler than their long-term averages.
Global temperature highlights: July
- The combined average temperature over global land and ocean surfaces during July was the sixth highest on record for July, at 61.50°F (16.41°C) or 1.10°F (0.61°C) above the 20th century average. The margin of error associated with this temperature is ±0.22°F (0.12°C).
- July marked the 37th consecutive July and 341st consecutive month with a global temperature above the 20th century average. The last below-average July temperature was July 1976 and the last below-average temperature for any month was February 1985.
- The July global land temperature was the eighth highest on record, at 1.40°F (0.78°C) above the 20th century average of 57.8°F (14.3°C). The margin of error is ±0.32°F (0.18°C).
- Some national highlights are included below:
- The July temperature for Australia was 1.46°C (2.63°F) above the 1961–1990 average, marking the third warmest July since national records began in 1901.
- The United Kingdom had its third warmest July since records began in 1910, at 1.9°C (3.4°F) above the 1981–2010 average. Provisionally, it was the warmest July and second warmest month of any month on record (behind August 1995) for Northern Ireland.
- With records dating back to 1767, Austria reported its second warmest July, tied with July 1983 and behind only 2006, with the nationally-averaged temperature 2.2°C (4.0°F) above the 1981–2010 average. Upper Austria and Salzburg each set new state maximum temperatures on July 28th.
- The average July temperature across South Korea was the fourth highest for the month in the country's 41-year period of record, at 1.8°C (3.2°F) above the 1981–2010 average. The July minimum temperature was second highest on record for the month, at 2.1°C (3.8°F) above average.
- For the ocean, the July global sea surface temperature was 0.97°F (0.54°C), above the 20th century average of 61.5°F (16.4°C), the fifth highest for July on record. The margin of error is ±0.09°F (0.05°C).
- Continuing a pattern that has persisted for more than a year, neither El Niño nor La Niña conditions were present across the central and eastern equatorial Pacific Ocean during July, with near-average sea surface temperatures across the central and east-central equatorial Pacific and below-average sea surface temperatures in the eastern equatorial Pacific. According to NOAA's Climate Prediction Center, neutral conditions continue to be favored over the next few months.
Precipitation highlights: July
- As is typical, precipitation varied greatly around the globe during July. Much of the eastern and central United States, India, southeastern Asia, and parts of eastern Russia were wetter than average during July. Record dryness was present among regions that included part of central Europe, eastern Turkey, some scattered regions in western Africa, east central Brazil, and northern coastal Chile.
- The United Kingdom had its driest July since 2006, with rainfall 82 percent of the 1981–2010 average. Southwest England, East Anglia, and northwest Scotland were among the driest regions during the month.
- Austria observed its driest July since national precipitation records began in 1858, with just 35 percent of the 1981–2010 average. Several regions received only 5 to 20 percent of their typical July rainfall.
Polar ice highlights: July and Seasonal
- According to data from the National Snow and Ice Data Center, the average July Arctic sea ice extent was 3.26 million square miles, 483,000 square miles (12.85 percent) below the 1981–2010 average of 3.74 million square miles. This was the fifth smallest July Arctic sea ice extent since satellite records began in 1979. During July, the Arctic lost sea ice at an average rate of 41,000 square miles per day, the second fastest July ice loss on record, behind 2007.
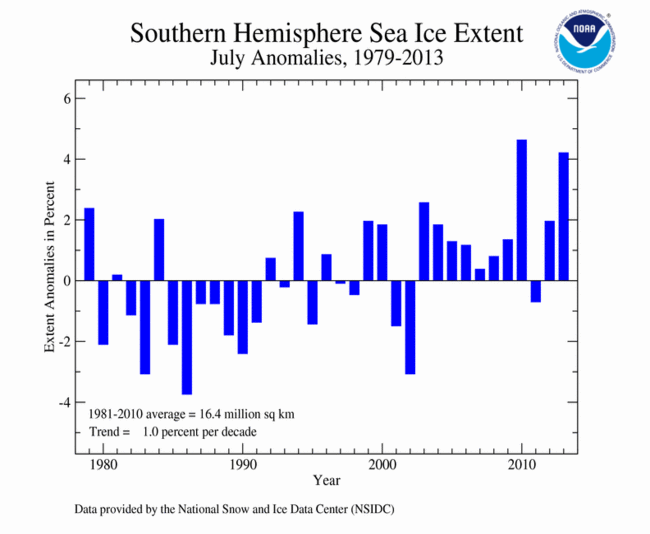
- The July Antarctic sea ice extent was 6.61 million square miles, 260,000 square miles (4.22 percent) above the 1981–2010 average of 6.35 million square miles. This marked the second largest July Antarctic sea ice extent on record. The largest July Antarctic sea ice extent on record occurred in 2010 at 6.64 million square miles.
- The globally combined Arctic and Antarctic sea ice extent during July was 9.87 million square miles, 220,000 square miles (2.2 percent) below the 1981–2010 average of 10.09 million square miles. This marked the 12th smallest July global sea ice extent in the 45-year period of record.
Global temperature highlights: Year-to-date
- TJanuary–July 2013 tied with 2003 as the sixth warmest such period on record, with a combined global land and ocean average surface temperature of 1.06°F (0.59°C) above the 20th century average of 56.9°F (13.8°C). The margin of error is ±0.20°F (0.11°C).
- The January–July worldwide land surface temperature was 1.73°F (0.96°C) above the 20th century average, the sixth warmest such period on record. The margin of error is ±0.38°F (0.21°C).
- The global ocean surface temperature for the year-to-date was 0.81°F (0.45°C) above average, the eighth warmest such period on record. The margin of error is ±0.09°F (0.05°C).
 NOAA's National Centers for Environmental Information


