Monthly Report Summary Information
The Monthly Report Summary Information is a synopsis of the collection of national and global summaries released each month.
Global Summary Information - July 2012
See Full Report
July 2012 global temperatures were fourth highest on record
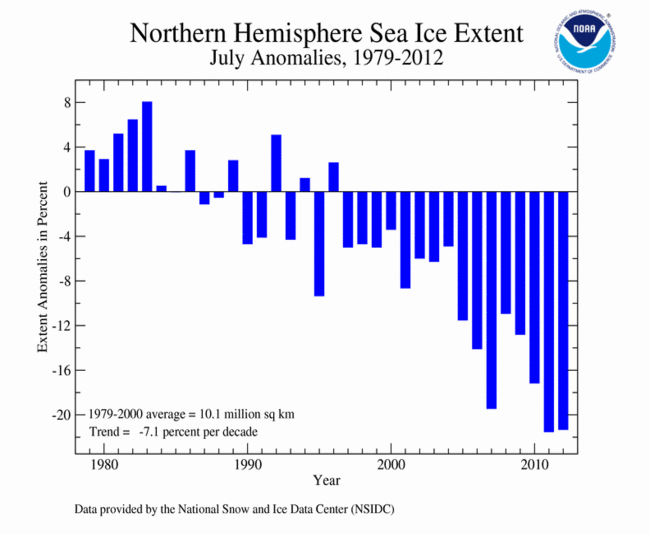
Arctic sea ice extent was second lowest July extent on record
The globally-averaged temperature for July 2012 marked the fourth warmest July since record keeping began in 1880. July 2012 also marks the 36th consecutive July and 329th consecutive month with a global temperature above the 20th century average.
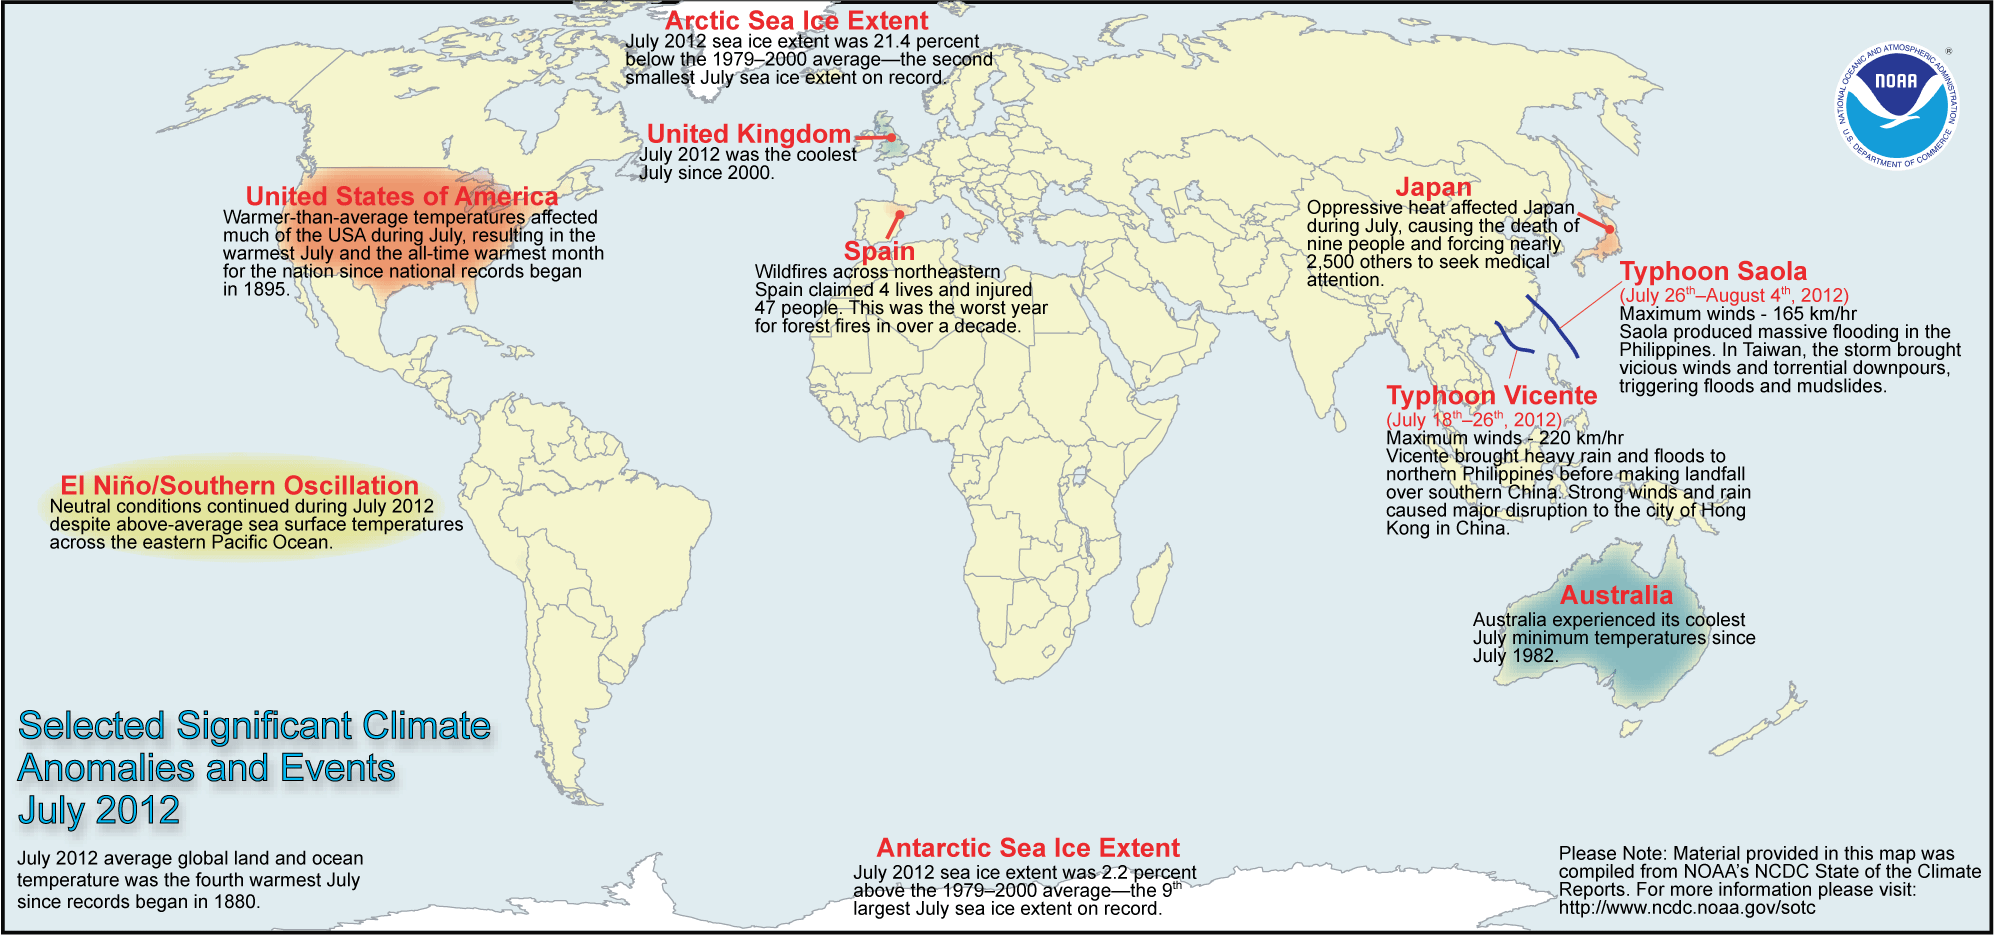
Most areas of the world experienced much higher-than-average monthly temperatures, including most of the United States and Canada. Meanwhile, Australia, northern and western Europe, eastern Russia, Alaska, and southern South America were notably cooler than average. In the Arctic, sea ice extent averaged 3.1 million square miles, resulting in the second lowest July sea ice extent on record.
The equatorial Pacific Ocean continued to reflect neutral El Niño-Southern Ocean (ENSO) conditions in July. However, according to NOAA's Climate Prediction Center, the El Niño warm ocean phase will likely develop between now and September. In addition to influencing seasonal climate outcomes in the United States, El Niño is often, but not always, associated with global temperatures that are above the average trend.
Global temperature highlights: July
- The combined average temperature over global land and ocean surfaces for July was the fourth highest on record for July, at 61.52°F (16.42°C) or 1.12°F (0.62°C) above the 20th century average. The margin of error associated with this temperature is ±0.16°F (0.09°C).
- July marked the 36th consecutive July and 329th consecutive month with a global temperature above the 20th century average. The last below-average temperature July was July 1976 and the last below-average temperature month was February 1985.
- The global land temperature tied with 2002 as the third warmest July on record, at 1.66°F (0.92°C) above the 20th century average of 57.8°F (14.3°C). The margin of error is ±0.23°F (0.13°C).
- Higher-than-average monthly temperatures were most notable across southeastern Europe and most the United States and Canada, while temperatures were much cooler than average in Australia, northern and western Europe, eastern Russia, Alaska, and southern South America.
-
- The average temperature for the contiguous U.S. during July was 3.3°F (1.8°C) above the 20th century average, marking the warmest July and all-time warmest month since national records began in 1895. The previous warmest month for the nation was July 1936 when the average U.S. temperature was 77.4°F (25.2°C) .
- The monthly temperature during July in the United Kingdom was 1.8°F (1.0°C) below the long-term average, making it the coolest July since 2000.
- While July daytime (maximum) average temperatures across Australia were close to the long-term average, the nighttime (minimum) temperatures were the coolest of the past 30 years, making it the eighth coolest July in the country's 63-year period of record at 1.73°F (0.96°C) below average. The state of Western Australia reported its coolest July minimum temperature on record at 3.08°F (1.71°C) below average.
- For the ocean, the July global sea surface temperature was 0.90°F (0.50°C) above the 20th century average of 61.5°F (16.4°C), or seventh warmest July on record. This was also the highest monthly global ocean temperature departure from average for any month since July 2010. The margin of error is ±0.07°F (0.04°C).
- Sea surface temperatures during July continued to rise and trend warmer than average across the central and eastern equatorial Pacific Ocean, the region where ENSO conditions are monitored. According to NOAA's Climate Prediction Center, El Niño conditions will likely emerge by September.

July 2012 Blended Land & Sea Surface Temperature Anomalies in °C
Polar ice highlights: July
- July 2012's Arctic sea ice extent averaged 3.1 million square miles, which was 21.4 percent below the 1979–2000 average. During the month, the Arctic lost a total of 1.2 million square miles of ice, resulting in the second smallest July Arctic sea ice extent on record.
- From July 8th to 12th, the area on Greenland's ice sheet that experienced some degree of melting rose from 40 percent to 97 percent, including at the highest elevations of the ice sheet. The melt coincided with a high pressure system that brought unusually warm air to the region. Typically, about half of the ice sheet experiences some summer melting and it is usually confined to lower elevations. Although the melt area is the largest since the beginning of the satellite era in 1979, according to NASA, ice core records indicate that this type of melting occurs about once every 150 years.
- Additionally, in northwestern Greenland, an iceberg roughly twice the size of Manhattan broke off the Petermann Glacier on July 16th. This is the second large-scale calving event this glacier has experienced since the start of the decade.
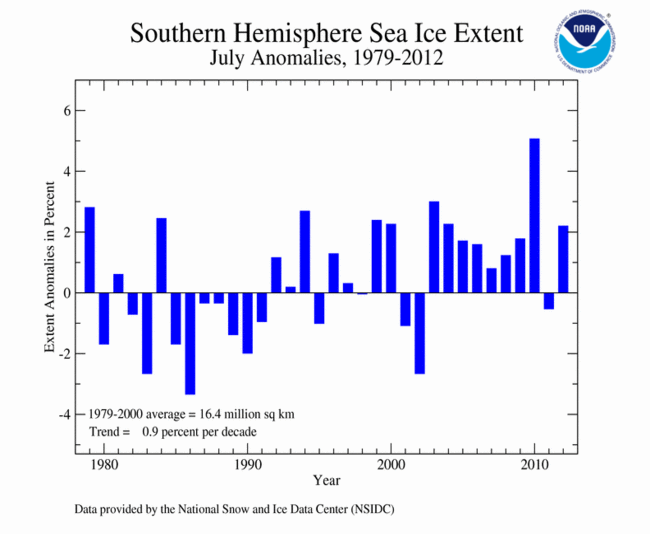
- On the opposite pole, Antarctic sea ice during July 2012 was 2.2 percent above average and ranked as ninth largest July extent in the 34-year period of record.
Precipitation highlights: July
- According to the U.S. Drought Monitor, as of July 31st, 62.9 percent of the contiguous U.S. was experiencing moderate to exceptional drought. The maximum value of 63.9 percent reached on July 24th is a record in the 13-year history of the USDM. The percent area of the country in the worst drought categories (extreme to exceptional drought) doubled, from 10 percent last month to 22 percent this month. The extreme dryness and above-average evapotranspiration due to excessive heat devastated crops and livestock from the Great Plains to Midwest.
- In India, the southwest monsoon season that began in early June brought deficient rainfall to much of the country through the end of July. From June 1st through August 1st, the first half of the monsoon season, total average seasonal rainfall was just 81 percent of the long term average with the northwest region of the country at a 65 percent of average deficit. In India, monsoon rainfall less than 90 percent of average constitutes drought.
- Record 24-hour rainfall of up to 20 inches (500 mm) was observed on Japan's southern island of Kyushu in mid-July. Subsequent flooding and landslides killed nearly two dozen residents.
Global temperature highlights: Year to Date
- Following the dissipation of La Niña in April, record to near-record warmth over land during May, June, and July and increasing ocean temperatures nudged 2012 into the top 10 warmest status for the first seven months of the year. The combined global land and ocean average surface temperature for the January–July period was 0.95°F (0.53°C) above the 20th century average of 56.9°F (13.8°C), marking the 10th warmest such period on record. The margin of error is ±0.16°F (0.09°C).
- The January-July worldwide land surface temperature was 1.58°F (0.88°C) above the 20th century average, marking the sixth warmest such period on record. The margin of error is ±0.38°F (0.21°C).
- The global ocean surface temperature for the year to date was 0.72°F (0.40°C) above average and ranked as the 11th warmest such period on record. This was the warmest monthly departure from normal since August 2010. The margin of error is ±0.07°F (0.04°C).
- In the upper atmosphere, satellite data revealed that the January–July temperature in the lower stratosphere was record coldest for the period, according to two separate analyses performed by the University of Alabama-Huntsville and Remote Sensing Systems.
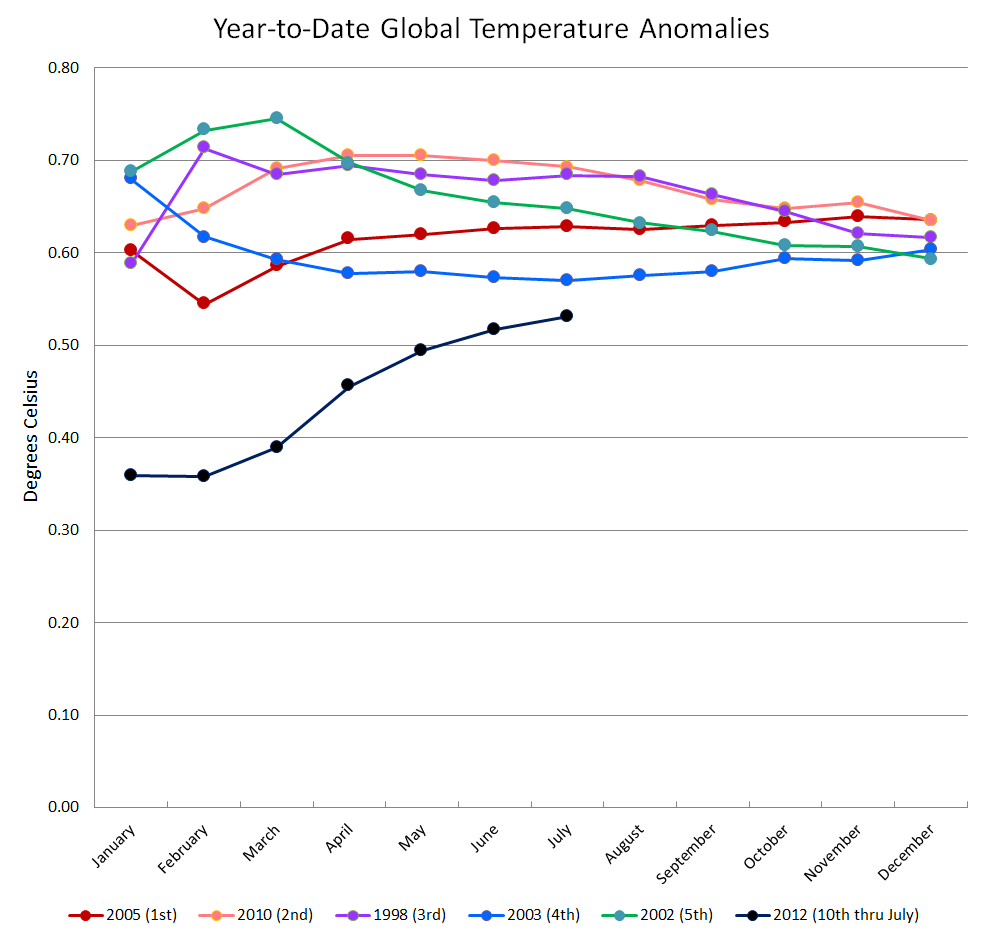
Year to date temperatures by month, with 2012 compared to the five warmest years on record