Monthly Report Summary Information
The Monthly Report Summary Information is a synopsis of the collection of national and global summaries released each month.
Global Summary Information - June 2012
See Full Report
June 2012 global temperatures were fourth highest on record
Arctic sea ice sees record June loss
The globally-averaged temperature for June 2012 marked the fourth warmest June since record keeping began in 1880. June 2012 also marks the 36th consecutive June and 328th consecutive month with a global temperature above the 20th century average.
Most areas of the world experienced much higher-than-average monthly temperatures, including most of North America and Eurasia, and northern Africa. Only Australia, northern and western Europe, and the northwestern United States were notably cooler than average. In the Arctic, record June sea ice loss occurred, resulting in the second lowest June sea ice extent on record.
The equatorial Pacific Ocean continued to reflect neutral El Niño-Southern Ocean (ENSO) conditions in June. However, according to NOAA's Climate Prediction Center, there is an elevated chance (55 percent) for the El Niño warm ocean phase to appear between now and September. In addition to influencing seasonal climate outcomes in the United States, El Niño is often, but not always, associated with global temperatures that are higher than normal.
Global temperature highlights: June
- The combined average temperature over global land and ocean surfaces for June was fourth highest on record for June, at 61.03°F (16.13°C) or 1.13°F (0.63°C) above the 20th century average. The margin of error associated with this temperature is ±0.13°F (0.07°C).
- June marked the 36th consecutive June and 328th consecutive month with a global temperature above the 20th century average. The last below-average temperature June was June 1976 and the last below-average temperature month was February 1985.
- For the second month in a row, the global land temperature was highest on record. The June record global land temperature was 1.93°F (1.07°C) above the 20th century average of 55.9°F (13.3°C). The margin of error is ±0.23°F (0.13°C).
- Above-average monthly temperatures occurred across much of the Northern Hemisphere while below-average temperatures occurred in parts of the Southern Hemisphere.
-
- Austria recorded its highest ever June temperature of 99.9°F (37.7°C) by a full degree Fahrenheit on June 30th in two locations: the capital city of Vienna and in German-Altenburg, Nope.
- The monthly temperature during June in the United Kingdom was 0.5°F (0.3°C) below the long-term average, making it the coolest June since 1991.
- Australia remained cooler than average due to the lingering effects of La Niña. Daytime (maximum) averaged temperatures were 0.49°F (0.27°C) below the long-term average while the nighttime (minimum) temperature had a greater departure of 1.69°F (0.94°C) below average.
- For the ocean, the June global sea surface temperature was 0.85°F (0.47°C) above the 20th century average of 61.5°F (16.4°C), or 10th warmest June on record. The margin of error is ±0.07°F (0.04°C).
- Neutral ENSO conditions continued across the equatorial Pacific Ocean during June as sea surface temperatures continued to rise. According to NOAA's Climate Prediction Center, there is a 55 percent chance that El Niño conditions will emerge during July–September 2012. In addition to influencing seasonal climate outcomes in the United States, El Niño is often, but not always, associated with global temperatures that are higher than temperatures in the neutral and La Niña phases.
June 2012 Blended Land & Sea Surface Temperature Anomalies in °C
Polar sea ice and precipitation highlights: June
- During June, the Arctic lost a total of 2.86 million square kilometers (1.10 million square miles) of sea ice, the largest loss on record for June since satellite records began in 1979. The average Arctic sea ice extent for the month was 9.8 percent below average, resulting in the second smallest June sea ice extent on record, behind 2010. The last three Junes (2010–2012) have been the three smallest in the period of record.
- On the opposite pole, Antarctic sea ice during June 2012 was 2.5 percent above average and ranked as 10th largest June extent in the 34-year period of record.
- The United Kingdom experienced its wettest June since national records began in 1910. England and Wales each tied with 1860 as the wettest June since their records began in 1766.
- Stockholm, Sweden received four times its average precipitation during June, making this month the city's wettest ever since records began in 1786.
- According to the U.S. Drought Monitor, as of July 3rd, 56.0 percent of the contiguous U.S. experienced drought conditions, marking the largest percentage of the nation experiencing drought conditions in the 12-year record of the U.S. Drought Monitor.


Global temperature highlights: Year to Date
- Following the dissipation of La Niña in April, record warmth over land during May and June and increasing ocean temperatures pushed 2012 near the top 10 warmest status for the first half of the year. The combined global land and ocean average surface temperature for the January–June period was 0.94°F (0.52°C) above the 20th century average of 56.3°F (13.5°C), marking the 11th warmest such period on record. The margin of error is ±0.16°F (0.09°C).
- The January-June worldwide land surface temperature was 1.57°F (0.87°C) above the 20th century average, marking the sixth warmest such period on record. The margin of error is ±0.38°F (0.21°C).
- The global ocean surface temperature for the year to date was 0.70°F (0.39°C) above average and ranked as the 12th warmest such period on record. This was the warmest monthly departure from normal since August 2010. The margin of error is ±0.07°F (0.04°C).
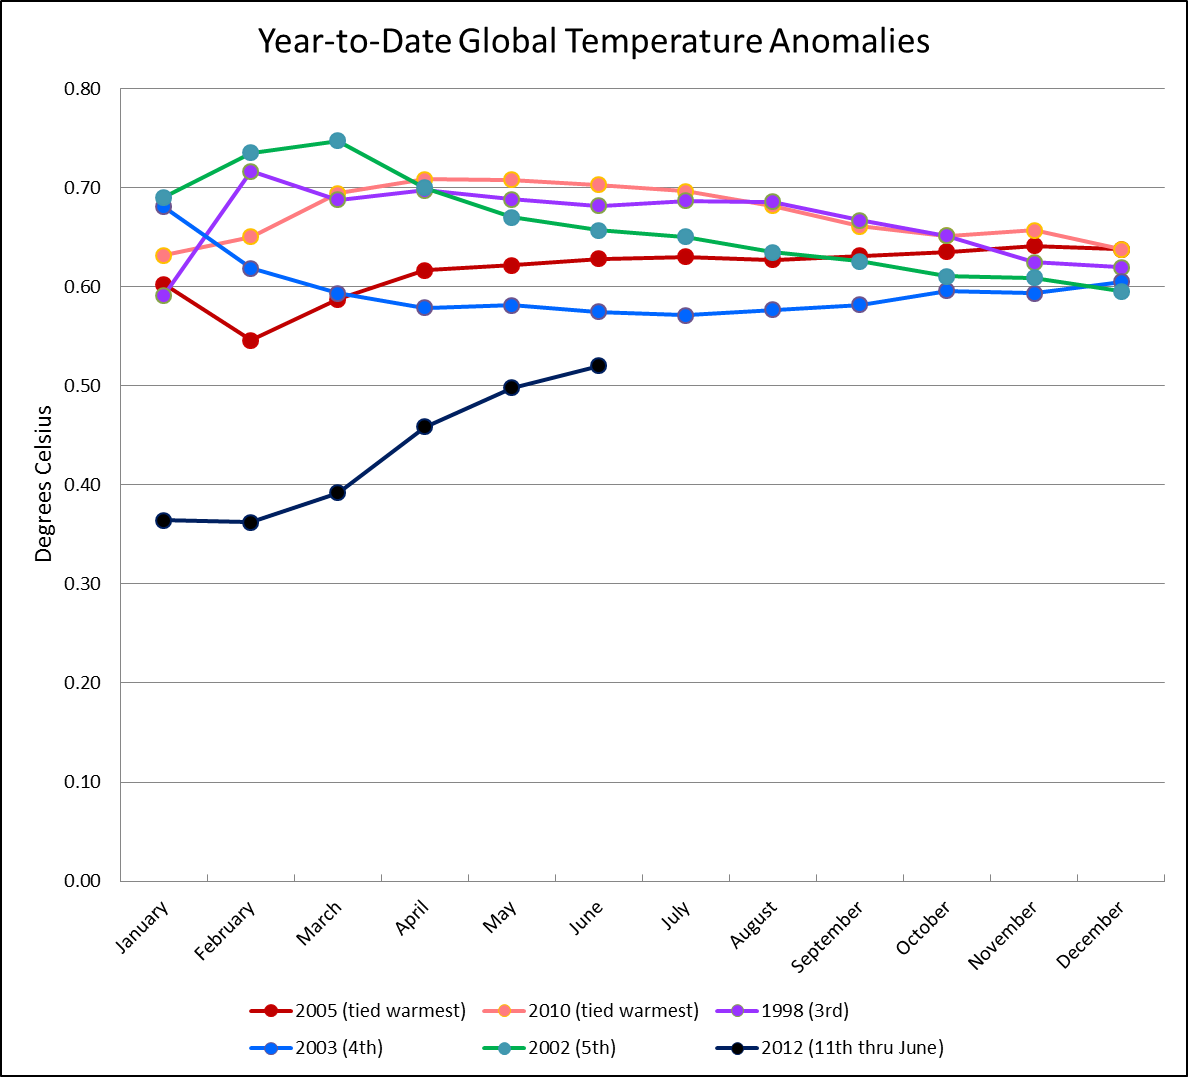
Year to date temperatures by month, with 2012 compared to the five warmest years on record