
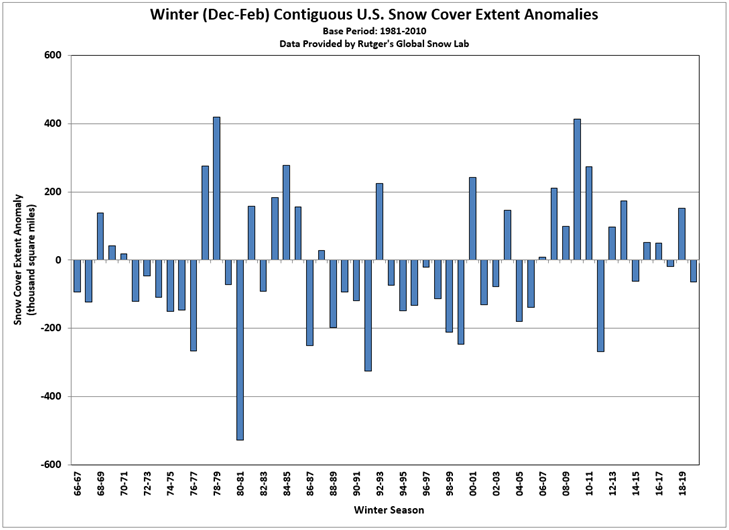
According to NOAA data analyzed by the Rutgers Global Snow Lab, the winter season (December 2019–February 2020), contiguous U.S. (CONUS) snow cover extent was 64,221 square miles below the 1981–2010 average and ranked as the 27th lowest in the 54-year period of record.
Snowfall during the 2019–2020 snow season was below average across the Sierra Nevada range, the coastal ranges, Cascades, the northern and central Plains, portions of the Great Lakes and across parts of the Mid-Atlantic and Northeast. In contrast, places such as Boulder, Colorado, experienced its snowiest season on record with 152 inches of snow. Caribou, Maine, also had significant snow during the 2019-2020 season receiving 146 inches and ranked ninth highest for any season on record.
December 2019 began with 41 percent of the CONUS covered by snow. By mid-month, snow cover peaked for December at 48.4 percent. Snow extended from the Intermountain West into the northern Plains and Great Lakes and from the central Plains to New England. Significant snow melt occurred near the beginning of January 2020, reducing the CONUS snow cover to 28 percent. A srong cold front traversed the continent mid-month and brought snowfall from the Texas Panhandle to New England and the maximum extent of snow for the month of February to 44 percent. Some of the coldest air of the season was felt across the northern Plains and Great Lakes during mid-February with temperatures 20 to 35 degrees below average. This air accompanied a cold front that brought snow accumulations from the central Plains to the Ohio Valley and into the Northeast. Snow cover rebounded back to 44 percent, matching the maximum extent of snow cover for the month.

Melting of winter and spring mountain snowpack provides a crucial summer water source across much of the western United States. The total annual water budget for agriculture and human use in the mountainous West is highly dependent on the amount of snow melt that will occur in spring and is proportional to the amount of snow on the ground, which can be approximated by a measure of the snow water equivalent (SWE).
By the end of March, SWE values were similar to those from the end of February, although precipitation received during March allowed for SWE values to increase across the Sierras, the Bitteroots, and the central Rockies. SWE conditions worsened across the Painted Desert of Arizona. Much of the West reported SWE values that were at least 75 percent of the median value and were above 100 percent across much of the Rockies.
For additional information on specific events please visit our Monthly Reports, Storm Events Database, and Billion-dollar Weather and Climate Disasters.