Overview | Notable Events | Seasonal Snowfall Totals
Overview:
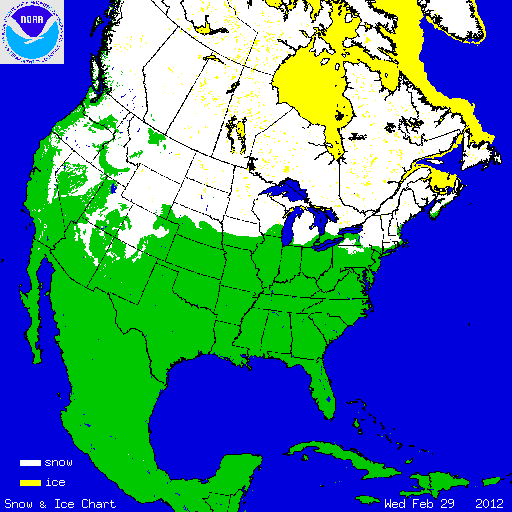
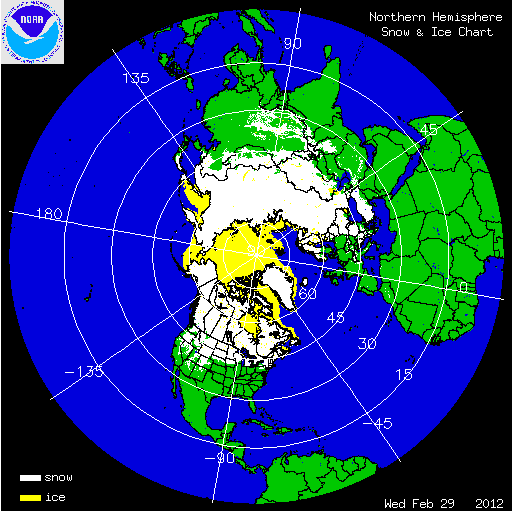
During February, the weather pattern brought above-average temperatures to much of the northern and eastern U.S., and below-average precipitation to much of the West and Eastern Seaboard. The middle of the country experienced above-average precipitation totals, but due to warmer-than-average conditions much of the monthly precipitation fell as rain, and not snow. The overall snow cover extent during the month was below average. At the beginning of the month, 19.2 percent of the contiguous U.S. was snow covered — parts of the Northeast, the western Great Lakes, parts of the Upper Midwest, and the high elevations of the West. Monthly snow coverage peaked on February 14th, at 47.7 percent, when a storm system brought very light snow accumulations from northern Texas into the Northeast. At the end of the month, 34.5 percent of the Lower 48 was snow covered — parts of the Northeast, the central and western Great Lakes, much of the Northern Plains, and the high terrain of the West.

According to data from the Rutgers Global Snow Lab, the monthly snow cover extent across the contiguous U.S. was approximately 1.0 million square miles, which was 139,200 square miles below the 1981-2010 average. The seasonal (December 2011-February 2012) snow cover extent for the contiguous U.S. was also much below average. The satellite-derived snow cover extent during the winter was approximately 237,000 square miles below the 1981-2010 average — the third smallest winter snow cover footprint in the 46-year satellite record. This marks the first winter since 2005-2006 with below-average snow cover for the country. Only the winter seasons of 1991-92 and 1980-81 had smaller snow cover extents.
At the end of the month, snowpack levels across a large portion of the West were lagging. Much of the high terrain of California, the Great Basin, and Arizona had snowpack totals less than 50 percent of normal. Below-average snowpack was also observed through much of the Central Rockies, stretching into parts of the Pacific Northwest. Near-average and slightly above-average snowpack was observed across Washington state and across the Northern Rockies of Idaho, Montana, and Wyoming.
Summary of Notable Snow Events:

A record-breaking snow storm impacted eastern Colorado and parts of Nebraska between February 2nd and 4th. The slow moving storm dropped 15.9 inches of snow in Denver, a new February snow storm record, surpassing the previous record of 14.1 inches set in February 1912. The 22.7 inches that fell in Boulder was also a February record. Snow accumulations greater than three feet were widespread across the region's highest terrain. Storms of this magnitude are more common in the region during the early spring months of March and April. As the storm moved off to the east it dropped upwards of a foot of snow across much of Nebraska. The 11.1 inches that accumulated in Lincoln, Nebraska was the fourth largest 24-hour snowfall on record for the city.

The potent storm system which spawned the severe weather outbreak across the south-central U.S. on February 28th and 29th brought heavy snowfall and blizzard conditions across the Northern Plains, Great Lakes, and into the Northeast. Snowfall totals exceeding one foot fell in a string of states from South Dakota to Maine. The heaviest snow fell across Minnesota and Wisconsin, where snow totals approached two feet, accompanied by winds gusting to 50 mph, creating blizzard conditions for several hours. The snow from this storm was one of the few snow events this season across many of the regions affected. Much of the Northern Plains, Great Lakes, and Northeast have been experiencing record and near-record snowfall deficits for the winter season.
Select City Snowfall Totals (Inches) - Winter (December-February) 2011/2012
Notes on selection criteria and data| City | State | Winter Normal (1981-2010) | Winter Total (2011/2012) | Departure | Percent of Normal | Minimum (Year) | Maximum (Year) |
|---|---|---|---|---|---|---|---|
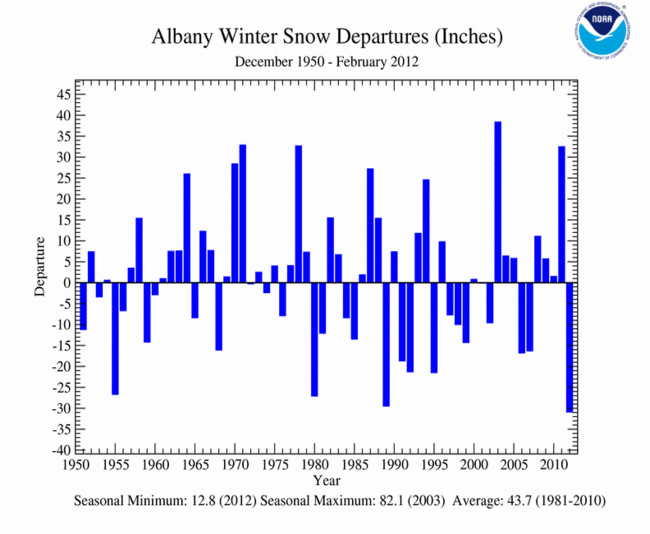
| Albany | NY | 43.7 | 12.8 | -30.9 | 29 | 12.8 (2012) | 82.1 (2003) |
| Amarillo | TX | 11.3 | 9.2 | -2.1 | 81 | 0.3 (2006) | 35.4 (2001) |
| Billings | MT | 22.8 | 22.3 | -0.5 | 98 | 5.5 (1992) | 66.4 (1978) |
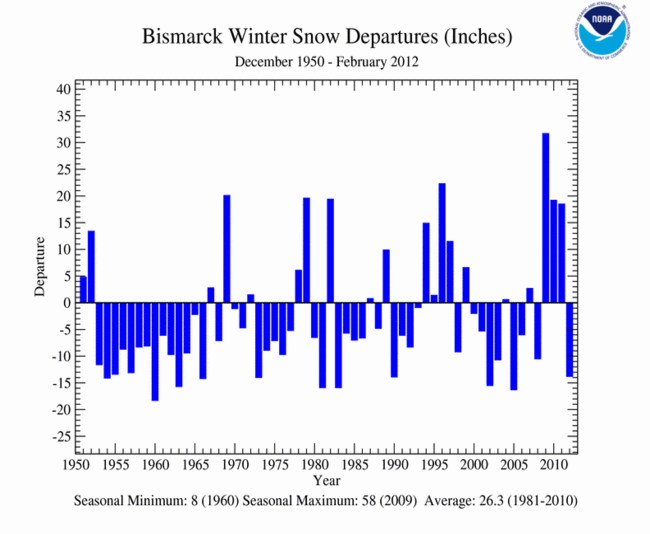
| Bismarck | ND | 26.3 | 12.5 | -13.8 | 48 | 8.0 (1960) | 58 (2009) |
| Boise | ID | 14.9 | 6.1 | -8.8 | 41 | 0.3 (1992) | 34.9 (1984) |
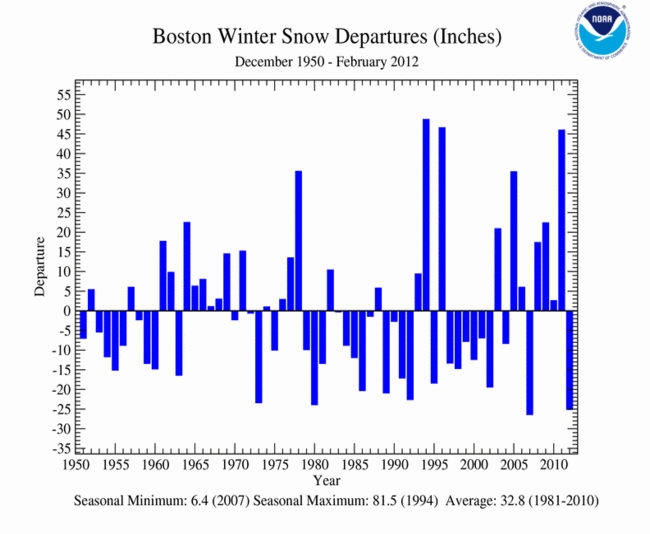
| Boston | MA | 32.8 | 7.7 | -25.1 | 23 | 6.4 (2007) | 81.5 (1994) |
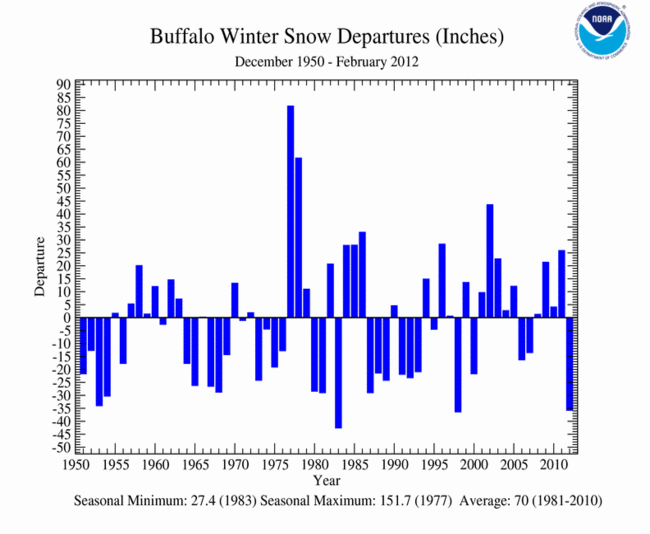
| Buffalo | NY | 70.0 | 34.2 | -35.8 | 49 | 27.4 (1983) | 151.7 (1977) |
| Burlington | VT | 55.4 | 26.7 | -28.7 | 48 | 20.6 (1980) | 103.4 (2008) |
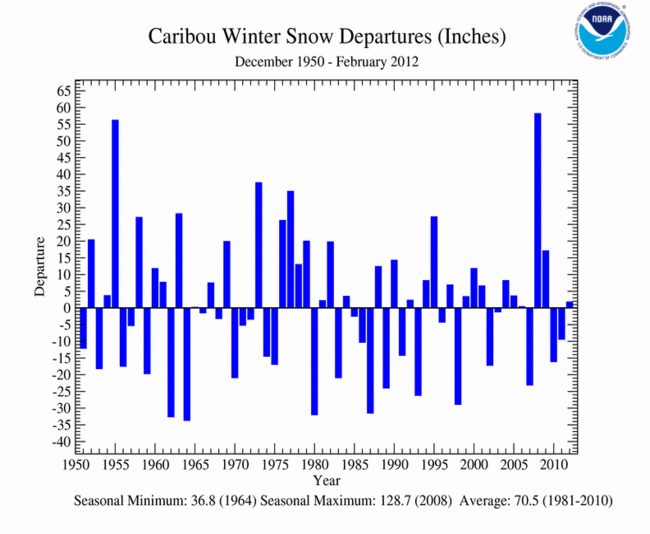
| Caribou | ME | 70.5 | 72.3 | 1.8 | 103 | 36.8 (1964) | 128.7 (2008) |
| New York (Central Park) | NY | 20.6 | 4.5 | -16.1 | 22 | 0.5 (1998) | 60.9 (2011) |
| Cheyenne | WY | 22.2 | 24.3 | 2.1 | 109 | 4.5 (1977) | 61.8 (1980) |
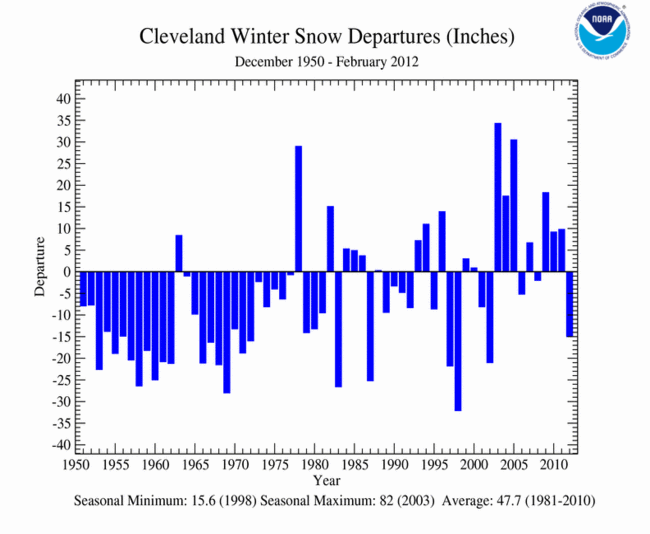
| Cleveland | OH | 47.7 | 32.7 | -15.0 | 69 | 15.6 (1998) | 82 (2003) |
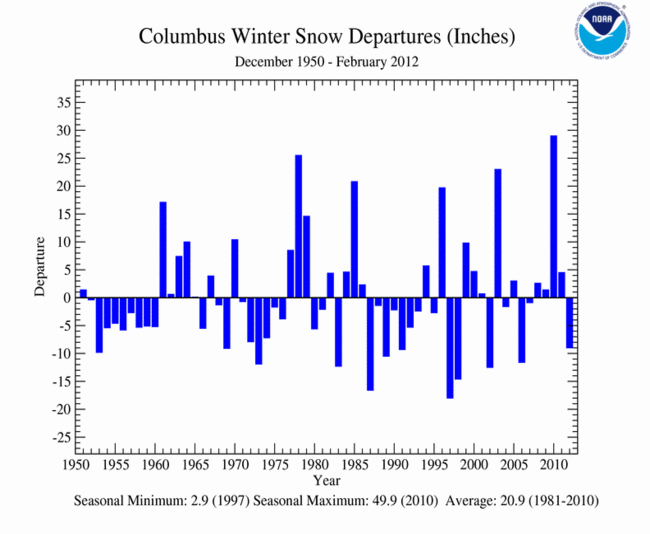
| Columbus | OH | 20.9 | 11.9 | -9.0 | 57 | 2.9 (1997) | 49.9 (2010) |
| Concord | NH | 44.5 | 13.8 | -30.7 | 31 | 13.8 (2012) | 100.5 (2008) |
| Des Moines | IA | 25.2 | 16.9 | -8.3 | 67 | 6.5 (1966) | 61.2 (2010) |
| Duluth | MN | 49.5 | 32.9 | -16.6 | 66 | 15.7 (2003) | 87.5 (1969) |
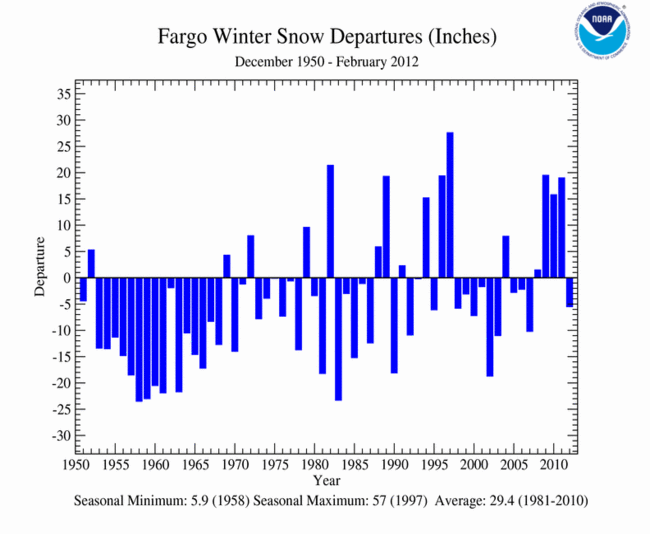
| Fargo | ND | 29.4 | 23.9 | -5.5 | 81 | 5.9 (1958) | 57 (1997) |
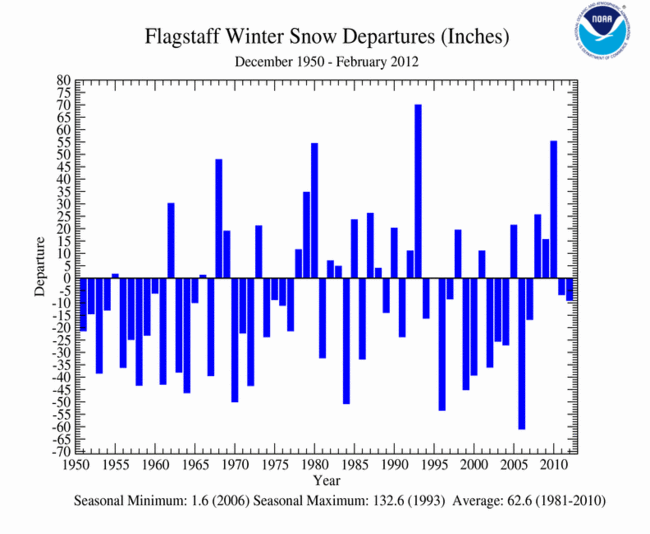
| Flagstaff | AZ | 62.6 | 53.6 | -9.0 | 86 | 1.6 (2006) | 132.6 (1996) |
| Grand Junction | CO | 13.0 | 5.4 | -7.6 | 42 | 2.3 (1961) | 40.4 (1957) |
| Indianapolis | IN | 22.0 | 8.9 | -13.1 | 40 | 2.9 (1973) | 51 (1982) |
| International Falls | MN | 40.8 | 37.2 | -3.6 | 91 | 15.5 (1960) | 81.8 (2009) |
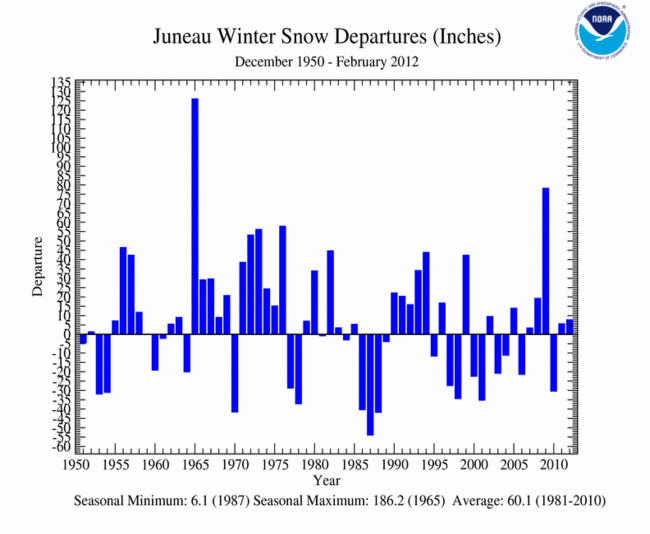
| Juneau | AK | 60.1 | 67.9 | 7.8 | 113 | 6.1 (1987) | 186.2 (1965) |
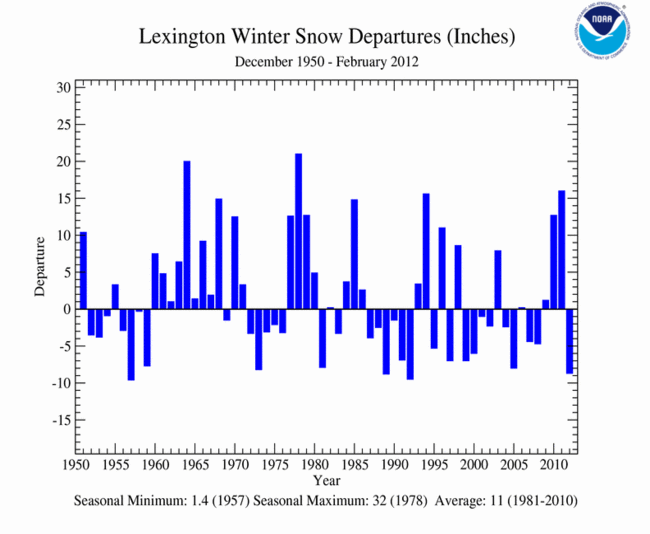
| Lexington | KY | 11.0 | 2.3 | -8.7 | 21 | 1.4 (1957) | 32 (1978) |
| Madison | WI | 37.0 | 23.2 | -13.8 | 63 | 3.1 (1961) | 88.3 (2008) |
| Medford | OR | 3.4 | 2.4 | -1.0 | 71 | 0 (2003) | 22.5 (1965) |
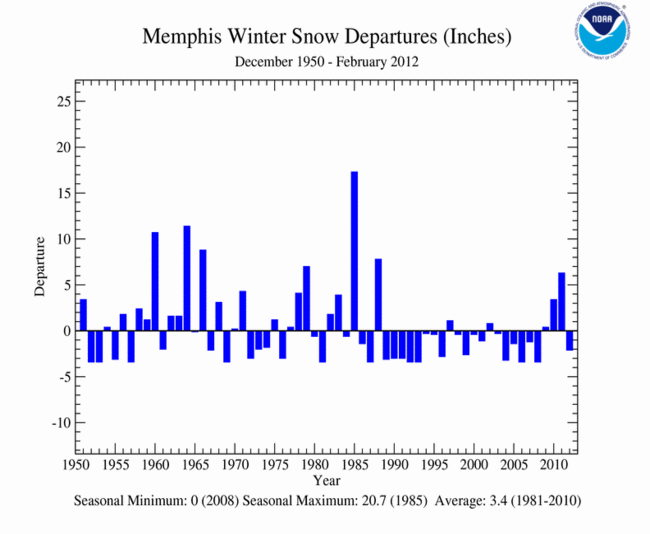
| Memphis | TN | 3.4 | 1.3 | -2.1 | 38 | 0 (2008) | 20.7 (1985) |
| Midland | TX | 4.2 | 19.5 | 15.3 | 464 | 0 (2009) | 19.5 (2012) |
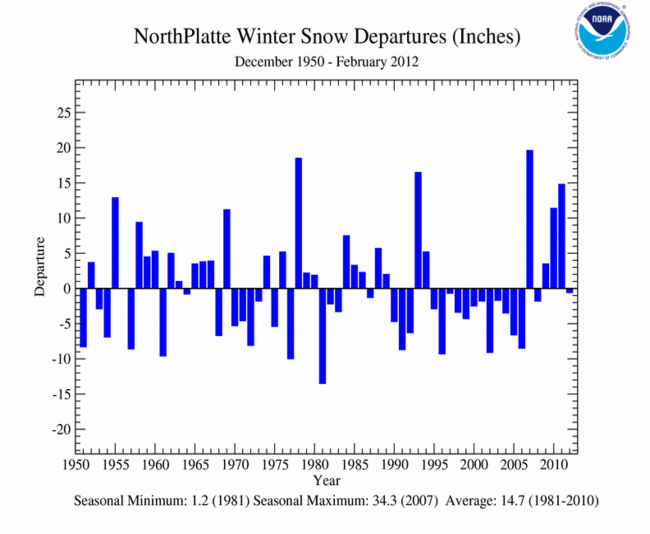
| North Platte | NE | 14.7 | 14.1 | -0.6 | 96 | 1.2 (1981) | 34.3 (2007) |
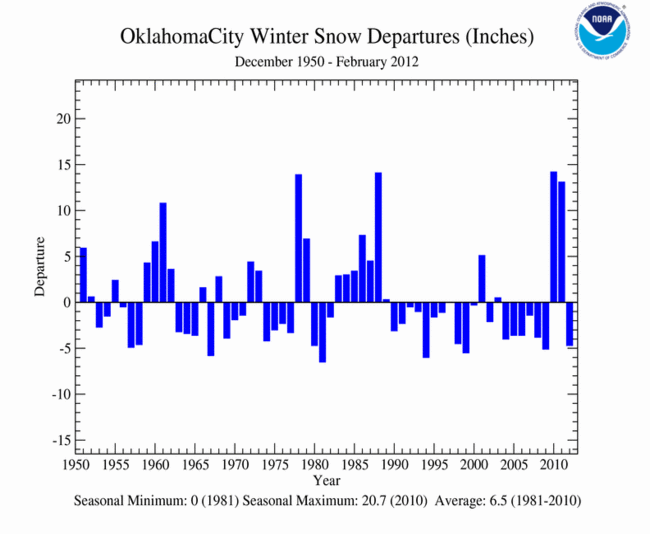
| Oklahoma City | OK | 6.5 | 1.8 | -4.7 | 28 | 0 (1981) | 20.7 (2010) |
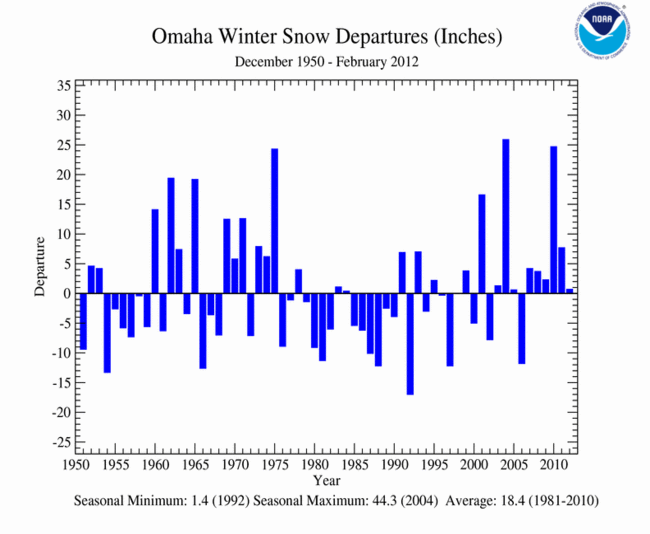
| Omaha | NE | 18.4 | 19.1 | 0.7 | 104 | 1.4 (1992) | 44.3 (2004) |
| Philadelphia | PA | 18.7 | 3.7 | -15.0 | 20 | 0 (1973) | 78.7 (2010) |
| Pittsburgh | PA | 30.4 | 29.3 | -1.1 | 96 | 11.9 (1974) | 76.9 (2010) |
| Portland | ME | 44.4 | 23.5 | -20.9 | 53 | 19.0 (1980) | 107.6 (1971) |
| Washington (Reagan) | DC | 12.7 | 2 | -10.7 | 16 | 0.1 (1998) | 56.1 (2010) |
| Roanoke | VA | 15.4 | 5.9 | -9.5 | 38 | 0.1 (1976) | 55.5 (1996) |
| Salt Lake City | UT | 36.4 | 14.3 | -22.1 | 39 | 8.8 (1963) | 80.4 (1993) |
| Sault Ste Marie | MI | 85.1 | 63.7 | -21.4 | 75 | 31.0 (1998) | 161.6 (1996) |
| Sioux Falls | SD | 22.8 | 15.5 | -7.3 | 68 | 2.7 (1987) | 89.2 (1969) |
| Spokane | WA | 32.8 | 23.6 | -9.2 | 72 | 9.0 (2010) | 82.8 (2009) |
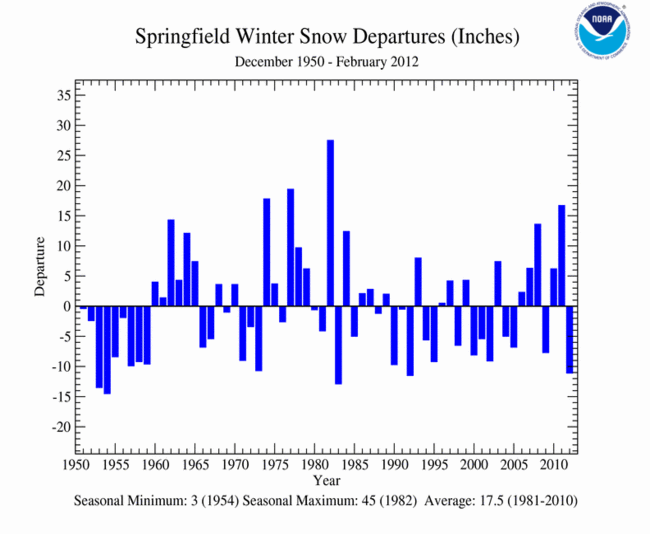
| Springfield | MO | 17.5 | 6.4 | -11.1 | 37 | 3.0 (1954) | 45 (1982) |
| St Louis | MO | 14.3 | 6.3 | -8.0 | 44 | 0.5 (1954) | 43.9 (1978) |
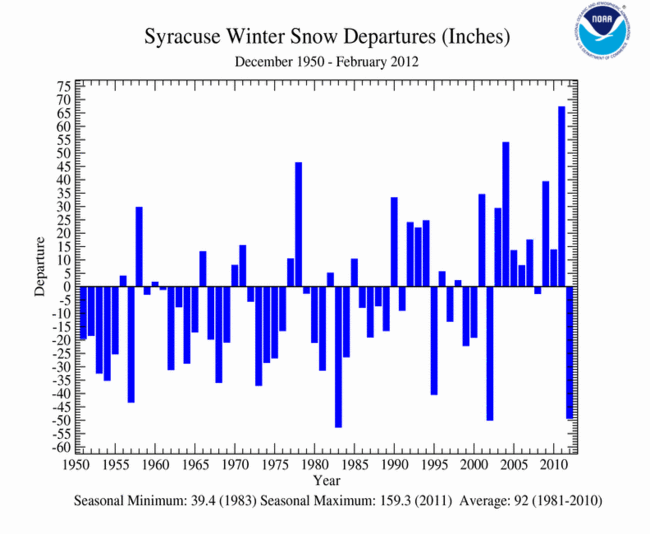
| Syracuse | NY | 92.0 | 42.7 | -49.3 | 46 | 39.4 (1983) | 159.3 (2011) |
| Topeka | KS | 14.6 | 2 | -12.6 | 14 | 0.1 (1992) | 38.1 (1993) |