The two satellite-derived animations above show the daily snow cover across the Northern Hemisphere (left map) and North America (right map) throughout February 2006. By clicking on the images, the change in sea-ice extent across parts of the Arctic can be seen through the month as well as several significant snowfall events across the U.S. and Europe, including a significant US East Coast storm on the 11th and 12th. February temperatures were near average for the US, while much warmer than average temperatures occurred in Alaska. Information on snow extent will be available later in the month. Sea-ice for the Great Lakes was still largely absent.
More information on significant winter weather and other hazards can be found on NCDC's Hazards page.
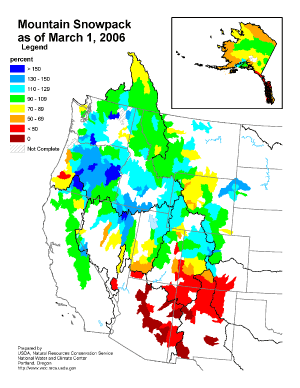
The map to the left depicts percent of average snowpack in the West and Alaska as of March 1st. The snowpack is less than 50% of average across much of the Southwest causing rising concern over spring water supply, which primarily results from melting snow. Abundant snowfall accumulated in parts of the northwest through the winter as Pacific storms impacted the region during December and January. More information on February severe winter weather can also be found on NCDC's Hazards page. Alaska had mostly below average snowpack, partly as a result of warmer-than-average temperatures across the state during December and February and drier than average conditions in January.
 NOAA's National Centers for Environmental Information


