National Overview

November Highlights
November Temperature
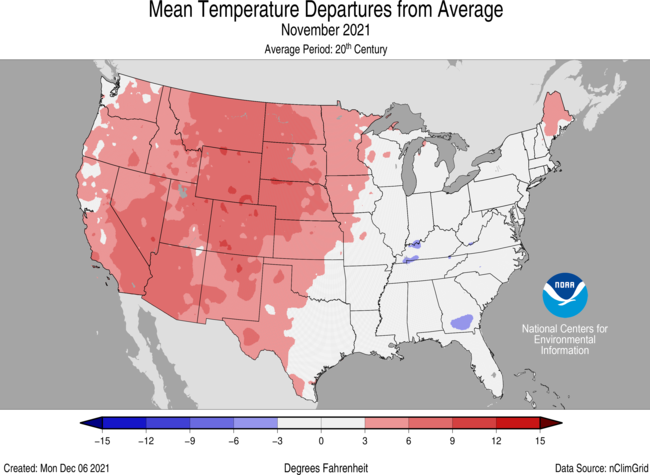
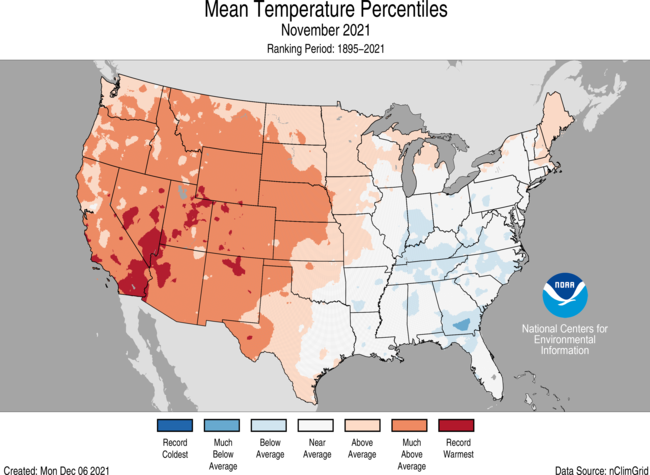
- The November contiguous U.S. average temperature was 45.2°F, 3.5°F above the 20th century average, ranking seventh warmest in the November record.
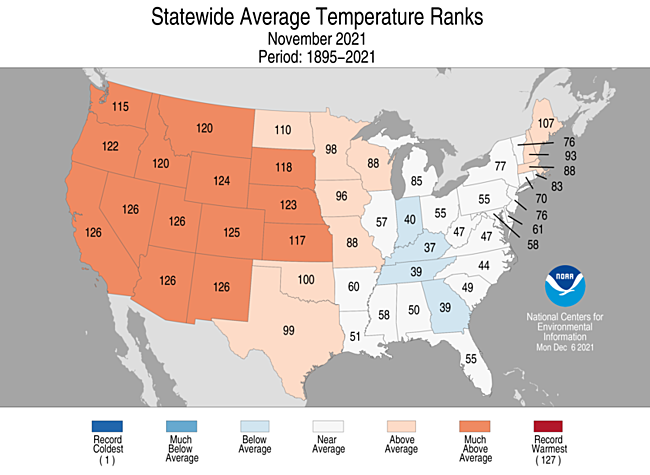
- November temperatures were above average from the West Coast to the Great Lakes and into New England as well as across portions of the Deep South. California, Nevada, Utah, Arizona and New Mexico each had their second-warmest November on record with three additional states in the West and High Plains ranking among their warmest five Novembers. Temperatures were near to below average across much of the eastern third of the contiguous U.S.
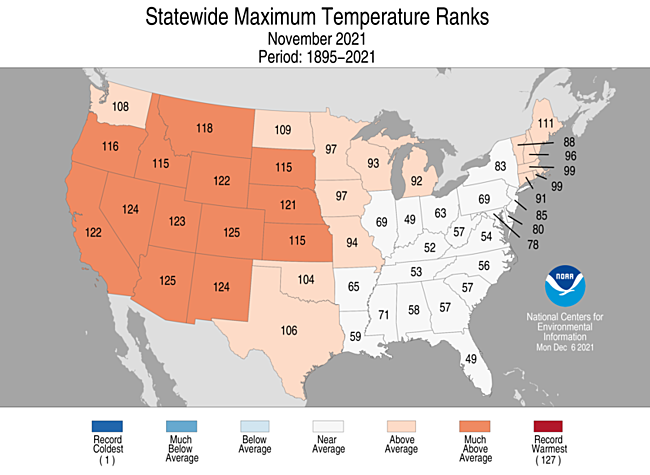
- The nationally averaged maximum temperature (daytime) temperature was warmer than average during November at 57.0°F, 4.3°F above average, ranking seventh warmest in the 127-year record. Arizona and Colorado ranked third warmest for maximum temperatures in November with three additional states across the West ranking among their warmest five Novembers for daytime high temperatures.
- The nationally averaged minimum temperature (overnight lows) during November was 33.4°F, 2.7°F above average, ranking in the warmest third of the 127-year record. California and Wyoming ranked warmest on record with Nevada, Utah and Colorado ranking second warmest for overnight low temperatures in November. Temperatures were below average from the Lower Mississippi Valley to the Ohio Valley and into the Southeast.
- The Alaska average November temperature was 4.1°F, 7.6°F below the long-term mean, tying for eighth-coldest November in the 97-year period of record for the state. Temperatures were record cold across southwestern Alaska with monthly average temperatures 15°F to 20°F below average. Long-term climate sites in Iliamna, King Salmon and Cold Bay each reported their coldest November on record.
- As of December 6, there were 4,923 warm daily high (2,604) and low (2,319) temperature records tied or broken during November. This is more than ten-times the number of cold records reported during the month. Approximately 429 daily cold high (296) and low (133) temperature records were set during the month.
- Based on NOAA's Residential Energy Demand Temperature Index (REDTI), the contiguous U.S. temperature-related energy demand during November was 74 percent of average and ranked 30th lowest in the 127-year period of record.
November Precipitation
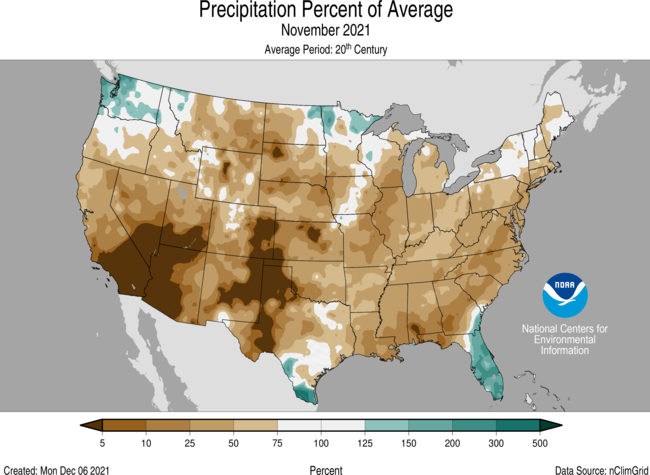
- The November precipitation total for the contiguous U.S. was 1.28 inches, 0.95 inch below average, ranking eighth driest in the 127-year period of record.
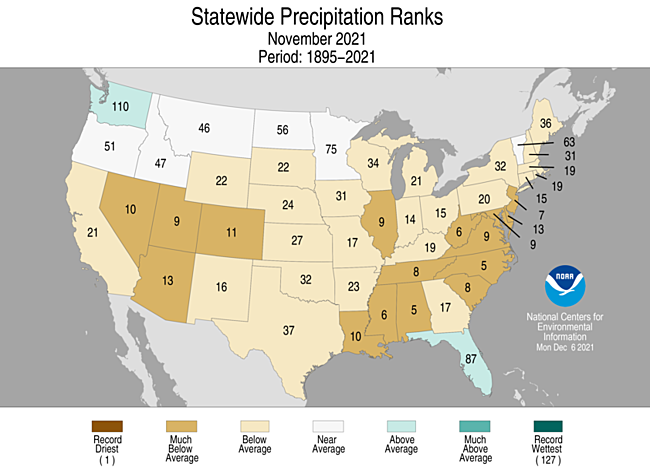
- Precipitation was above average across portions of the Northwest, northern Plains, Florida and south Texas while below-average precipitation dominated much of the remainder of the contiguous United States. Alabama and North Carolina both ranked fifth driest for the month while 11 additional states ranked among their driest 10 Novembers.
- Several atmospheric river events impacted Oregon and Washington during November. Torrential rainfall and tropical storm force winds were associated with these events. Flash flooding occurred along the Skagit River near Mt. Vernon, WA and power outages and evacuations occurred in portions of the Olympic Peninsula. Rock and land slides were reported in parts of Oregon in addition to many water rescues from flooded waters occurring in both states.
- In Alaska, statewide precipitation ranked in the driest third of the historical record. Precipitation was below average across much of the state with the driest conditions present across the western and southwestern portions of the state. This resulted in below-average snowpack across much of the region. Snowfall was above average across parts of southcentral Alaska and the Panhandle due to a larger percentage of the precipitation falling as snow as compared to average.
- According to the November 30 U.S. Drought Monitor, approximately 53.4 percent of the contiguous U.S. was in drought, up 5.6 percent from the beginning of November. Drought conditions expanded or intensified across portions of the Carolinas and Virginia, the southern Plains, along the front range of the Rockies and across portions of Hawaii and Puerto Rico. Drought severity and/or extent lessened across parts of the West and Upper Mississippi River Valley.
Hurricane Season Summary
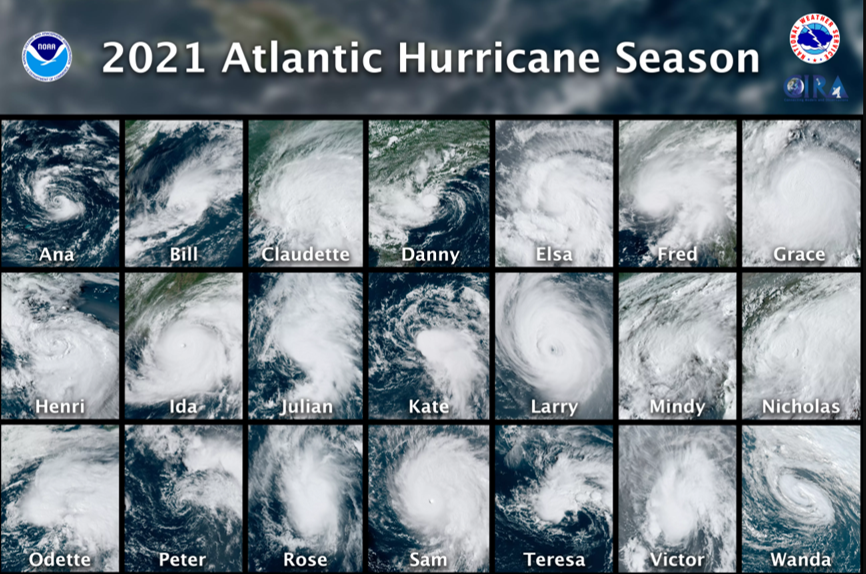
- Twenty-one named storms formed in the Atlantic during 2021, which ranks as the third most-active season on record (average is 14). In all, there were 7 hurricanes and 4 major hurricanes in 2021 (average is 7 and 3, respectively). The record of 30 named storms occurred last year. Twenty-seven named storms formed in 2005.
- Eight named-storm-continental U.S. landfalls occurred during 2021 (Claudette, Danny, Elsa, Fred, Henri, Ida, Mindy and Nicholas) with Category 4 Ida being the strongest landfalling and most destructive. Damage associated with Ida was reported from the Louisiana coast to the Northeast. As of December 9, cost estimates associated with Ida were $64.5 billion and associated fatalities, 95.
- Category 4 Ida was among the most-intense hurricanes on record to make landfall in Louisiana (Katrina in 2005 was more intense), with maximum sustained winds of 150 mph and minimum central pressure of 930 mb.
- 2021 was the sixth consecutive above-normal Atlantic hurricane season and the seventh consecutive year with a named storm forming prior to the official start of the season on June 1.
Fall Highlights
September-November Temperature
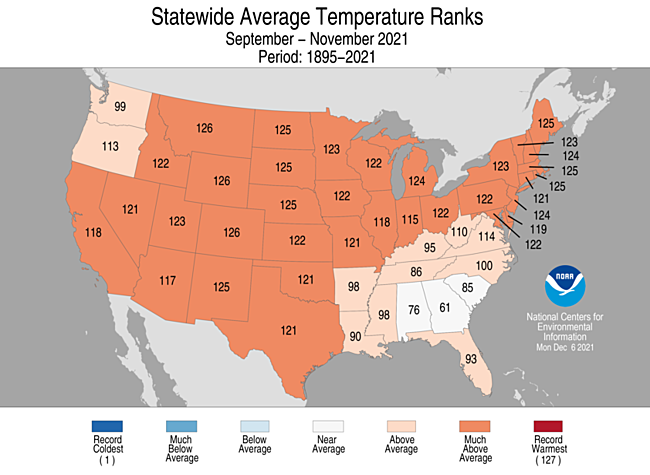
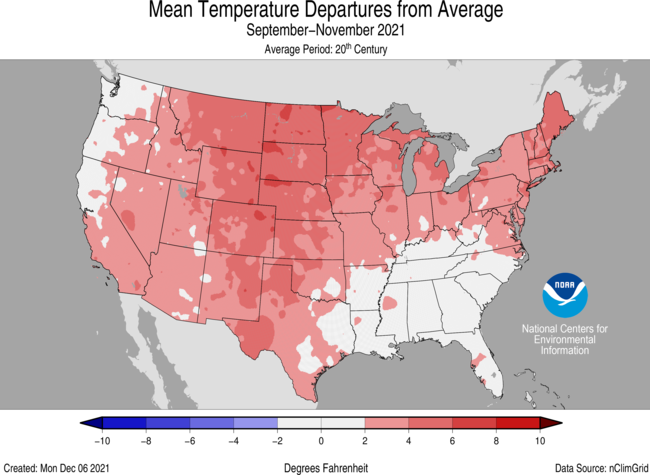
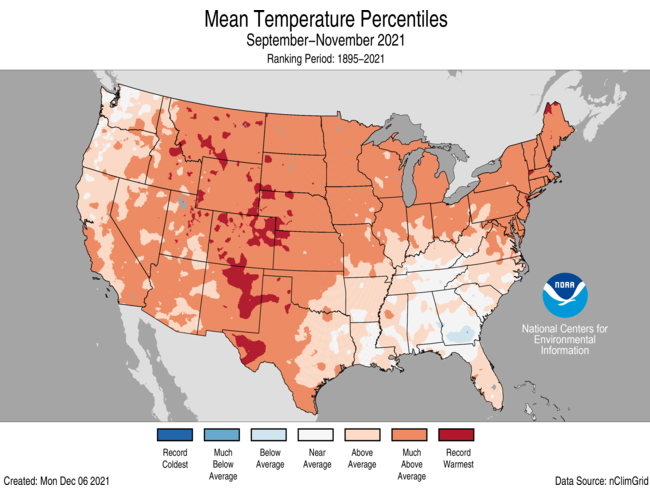
- During meteorological autumn (September-November), the average temperature for the Lower 48 was 56.7°F, 3.1°F above average, ranking third warmest in the historical record.
- Autumn temperatures were above average across most of the contiguous U.S. Montana, Wyoming and Colorado ranked second warmest for this three-month period with 14 additional states ranking among their five warmest autumns.
- The contiguous U.S. average maximum (daytime) temperature during September-November was 68.9°F, 3.1°F above average, ranking fifth warmest on record. Record-warm maximum temperatures were observed across portions of the High Plains with above-average daytime temperatures dominating all but portions of the West Coast and Southeast. New Mexico ranked warmest for the autumn period while Colorado ranked second warmest.
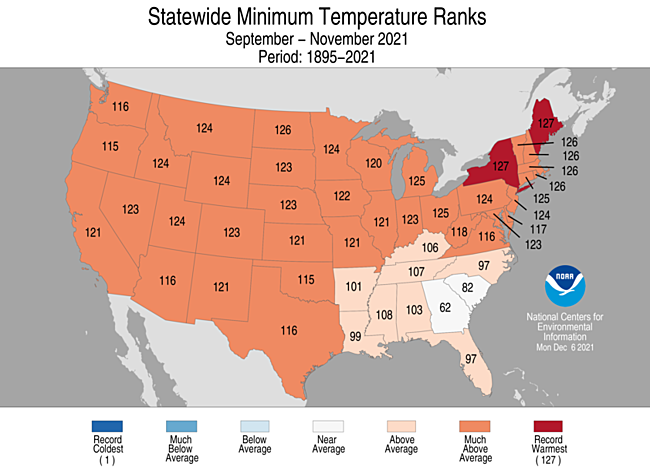
- The contiguous U.S. September-November minimum (nighttime) temperature was 44.4°F, 3.1°F above average, and ranked fourth warmest on record. Record warm minimum temperatures were observed in pockets of the Northeast and central Rockies. Above-average temperatures were present across much of the remainder of the CONUS. New York and Maine each ranked warmest for overnight temperatures during autumn with five additional states across the Northeast and northern Plains ranking second warmest for this three-month period.
- The Alaska statewide average temperature for autumn was 23.8°F, 2.2°F below average, ranking in the coldest third of the historical record. Temperatures were below average across much of the West Coast, western Interior, south-central and southeastern portions of the state. Record cold temperatures occurred across portions of Bristol Bay, Northwest Gulf and the Aleutians. Pockets of above-average temperatures were observed across parts of the North Slope and Northeast Interior regions.
- Based on NOAA's Residential Energy Demand Temperature Index (REDTI), the contiguous U.S. temperature-related energy demand during September-November was 42 percent of average and ranked as the 10th-lowest value in the 127-year period of record.
September-November Precipitation
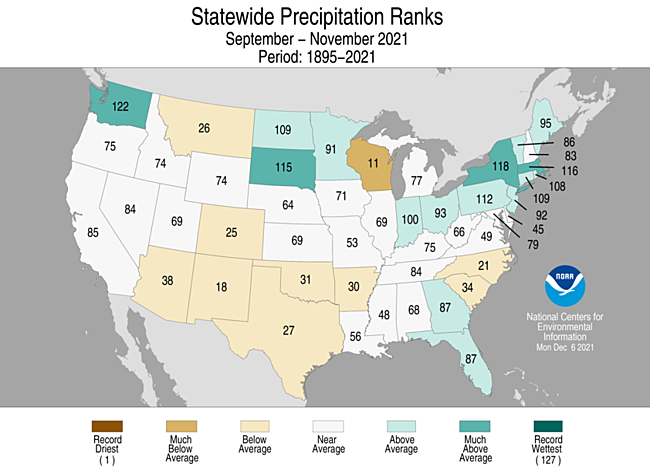
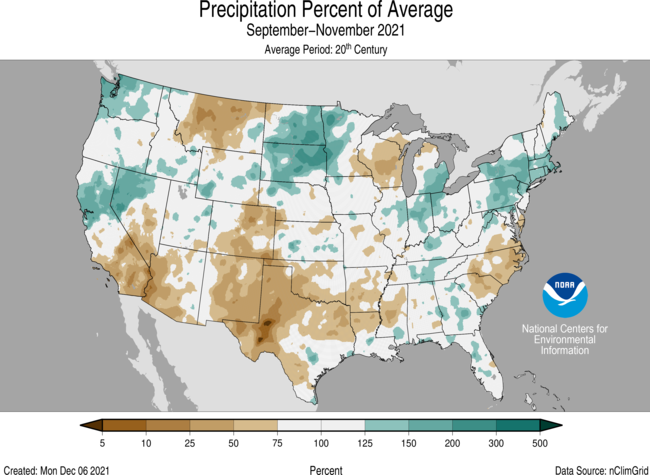
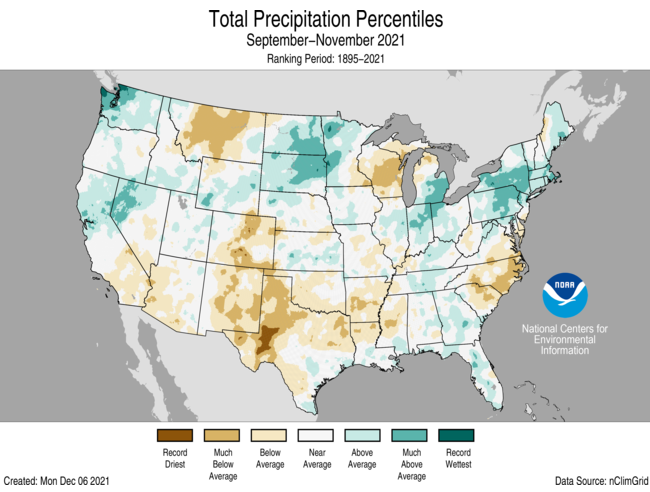
- The national autumn precipitation total was 6.81 inches, 0.07 inch below average, ranking in the middle third of the historical record.
- Precipitation was above average across parts of the West, northern Plains, Ohio Valley, Northeast and Southeast. Washington state ranked sixth wettest for this three-month period. Precipitation was below average across portions of the Southwest, northern Rockies, central to southern Rockies, southern Plains, Lower Mississippi River Valley, western Great Lakes and the Carolinas and Virginia.
- Multiple atmospheric river events during the fall season contributed to the wettest fall on record for Seattle, WA, with a total of 19.04 inches reported. The previous record was 18.61 inches set in 2006.
- Autumn statewide precipitation ranked in the driest third of the historical record in Alaska.
September-November Extremes
-
The U.S. Climate Extremes Index (USCEI) for autumn ranked third highest in the 112-year period of record. On a national scale, elevated extremes in warm maximum and minimum temperatures, dry PDSI, as well as extremes in 1-day precipitation were widespread and contributed to this top-three value. The USCEI is an index that tracks extremes (falling in the upper or lower 10 percent of the record) in temperature, precipitation and drought across the contiguous United States.
- On the regional scale, extremes across the Northeast and Northern Rockies and Plains ranked second highest while the Northwest and West ranked third highest for the season. These elevated extremes were due in large part to record and near-record warm maximum and minimum temperatures, dry PDSI, extremes in 1-day precipitation and the number of days with precipitation. In addition to these extremes, the Northeast had a large wet PDSI footprint for this three-month period, which factored into the elevated CEI value for the region.
Year-to-Date Highlights
January-November Temperature

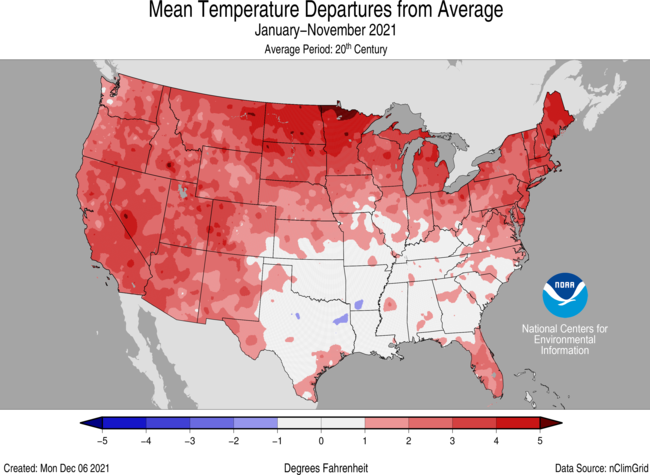
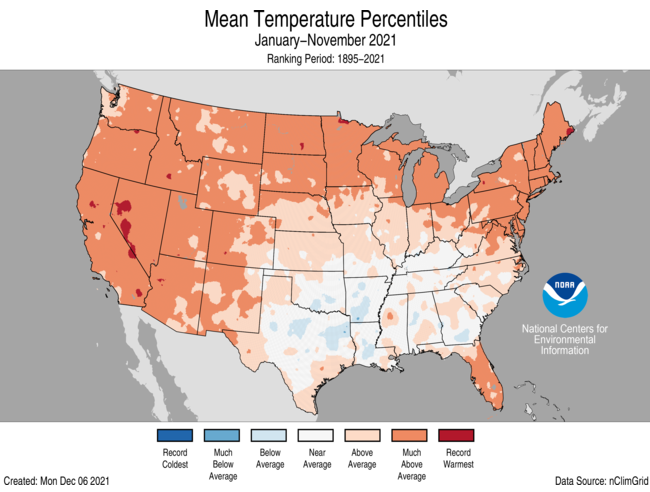
- For the year-to-date, the national temperature was 55.9°F, 2.1°F above average, ranking seventh warmest in the January-November record.
- Year-to-date temperatures were above average across the western U.S., central and northern Plains, Great Lakes and East Coast with Maine ranking second warmest and 11 additional states across the Northeast, Great Lakes, northern Plains and West ranking among their five warmest such periods. Temperatures were near average across portions of the southern Plains, central Gulf Coast and Tennessee Valley with pockets of below-average temperatures embedded across the South.
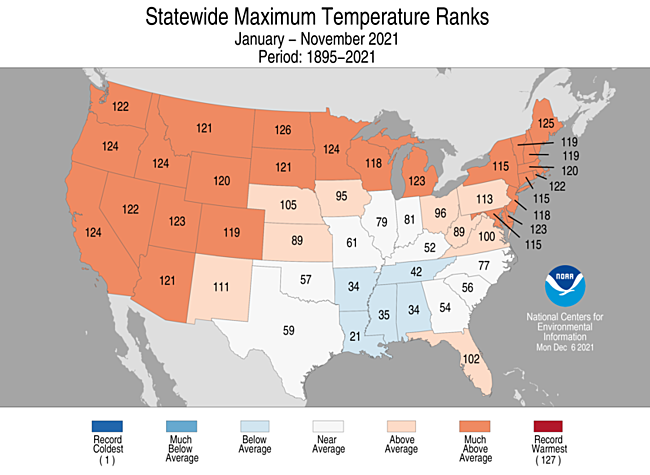
- The contiguous U.S. average maximum (daytime) temperature during January-November was 67.9°F, 1.9°F above the 20th century average, ranking eighth warmest in the 127-year record. Above-average maximum temperatures were observed from the West Coast to the Great Lakes and into the Northeast as well as across much of Florida. Daytime temperatures across North Dakota ranked second warmest and third warmest in Maine. Near and below-average maximum temperatures were observed across portions of the Lower Mississippi Valley.
- The contiguous U.S. January-November minimum (nighttime) temperature was 43.9°F, 2.3°F above average, and ranked seventh warmest on record. Above-average minimum temperatures were observed across most of the Lower 48 with pockets of below-average temperatures observed across the southern Plains. Maine, Massachusetts and Rhode Island each ranked second warmest while thirteen additional states across the West, northern Plains, Great Lakes and Northeast experienced a warmest-five January-November period for nighttime temperatures.
- Year-to-date statewide temperatures ranked near average in Alaska with above-average temperatures observed across northeastern portions of the state. Below-average temperatures were present across portions of the southwestern and southeastern Alaska mainland.
- Based on the REDTI, the contiguous U.S. temperature-related energy demand during January-November was 62 percent of average and ranked 19th lowest in the 127-year period of record.
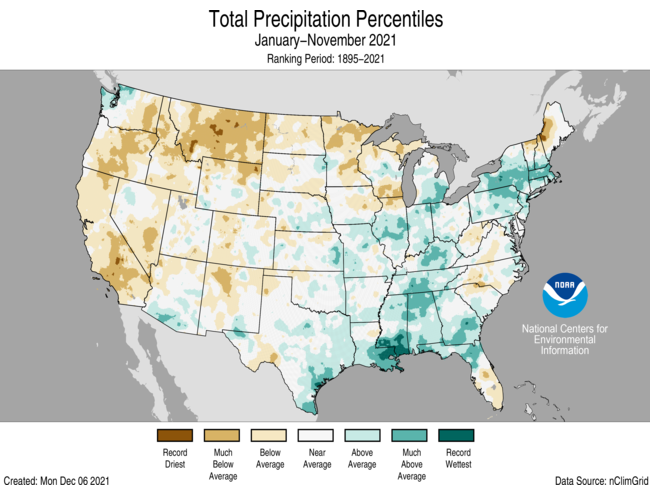
January-November Precipitation
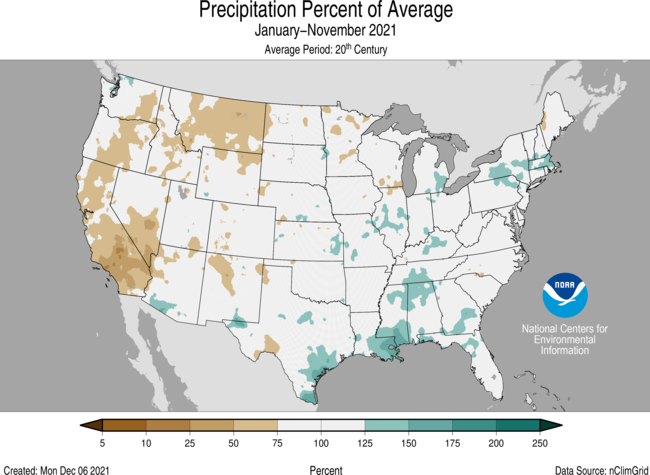
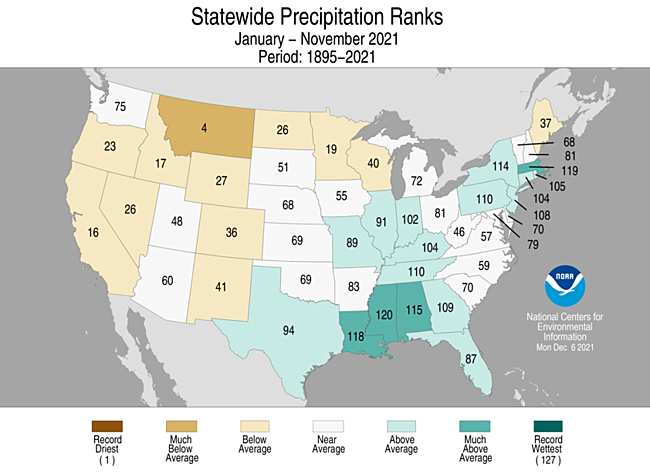
- The year-to-date precipitation total for the Lower 48 was 28.06 inches, 0.47 inch above average, ranking in the middle third of the record.
- January-November precipitation was above average from the Gulf Coast to the Great Lakes and into portions of the Northeast. Mississippi ranked eighth wettest on record. Precipitation was below average across much of the West, northern Plains and portions of New England and the Carolinas. Montana ranked fourth driest on record for this January-November period.
- January-November precipitation in Alaska was above average across much of the West Coast, North Slope, Central Interior, Northeastern Interior and Panhandle regions. Drier-than-average conditions were present across Cook Inlet.
Extremes
- The USCEI for the year-to-date ranked seventh-highest in the 112-year period of record. Extremes in warm maximum and minimum temperatures as well as dry PDSI and 1-day precipitation contributed to this elevated value.
- On the regional scale, the West ranked highest on record for this period, while the Northeast ranked third highest. Record to near-record extremes in these regions were due to large areas of warm maximum and minimum temperatures, both wet and dry PDSI values and extremes in 1-day precipitation. Approximately half or more of the Southwest and Northwest regions experienced extremes in warm maximum and minimum temperatures and dry PDSI during the first 11 months of the year.
Regional Highlights
These regional summaries were provided by the six Regional Climate Centers and reflect conditions in their respective regions. These six regions differ spatially from the nine climatic regions of the National Centers for Environmental Information.
Northeast Region (Information provided by the Northeast Regional Climate Center)
- The Northeast’s average temperature for November was 39.1 degrees F (3.9 degrees C), 0.3 degrees F (0.2 degrees C) cooler than normal. November average temperatures for the 12 Northeast states ranged from 1.9 degrees F (1.1 degrees C) cooler than normal in West Virginia to 2.1 degrees F (1.2 degrees C) warmer than normal in Maine, the state’s 19th warmest November. Overall, seven states wrapped up November on the cool side of normal. The Northeast had its fourth warmest autumn since 1895 with an average temperature of 52.7 degrees F (11.5 degrees C), 2.3 degrees F (1.3 degrees C) above normal. State average temperatures for autumn ranged from 1.4 degrees F (0.8 degrees C) above normal in West Virginia to 3.1 degrees F (1.7 degrees C) above normal in Maine. This autumn was the warmest on record for Maine and ranked among the six warmest autumns on record for another 10 states: Massachusetts, New Hampshire, New Jersey, and Rhode Island, third warmest; New York and Vermont, fourth warmest; Connecticut and Delaware, fifth warmest; and Maryland and Pennsylvania, sixth warmest. In addition, West Virginia had its 17th warmest autumn. This autumn was the warmest on record for Newark, New Jersey. The site’s autumn average temperature of 61.3 degrees F (16.3 degrees C) was 3.4 degrees F (1.9 degrees C) warmer than normal, beating the old record of 60.9 degrees F (16.1 degrees C) from 2015.
- November 2021 ranked as the Northeast’s 16th driest November since recordkeeping began. The region saw 2.15 inches (54.61 mm) of precipitation, 62 percent of normal. November precipitation for the 12 Northeast states ranged from 31 percent of normal in Delaware to 96 percent of normal in Vermont. This November was among the 20 driest on record for eight of the states: New Jersey and West Virginia, seventh driest; Maryland, ninth driest; Delaware, 13th driest; Connecticut, 15th driest; Pennsylvania, 18th driest; and Massachusetts and Rhode Island, 19th driest. The Northeast picked up 12.83 inches (325.88 mm) of precipitation during autumn, which was 110 percent of normal. State precipitation for autumn ranged from 75 percent of normal in Delaware to 127 percent of normal in Massachusetts, with seven states landing on the wet side of normal. This autumn was among the 20 wettest on record for four of the states: New York, 11th wettest; Massachusetts, 12th wettest; Pennsylvania, 16th wettest; and Rhode Island, 19th wettest.
- The U.S. Drought Monitor released on November 4 showed 1 percent of the Northeast in severe drought, 1 percent in moderate drought, and 5 percent as abnormally dry. Below-normal precipitation and declining soil moisture led to the expansion of abnormal dryness in West Virginia and southern/eastern Maryland. Drought and abnormal dryness persisted in far northern New England. The U.S. Drought Monitor released on December 2 showed 1 percent of the Northeast in severe drought, 1 percent in moderate drought, and 8 percent as abnormally dry.
- A rare tornado outbreak occurred on November 13 in Connecticut, Rhode Island, and New York’s Long Island, with 11 weak (EF-0 or EF-1) tornadoes touching down. For these locations, these were the first tornadoes in November and the latest tornadoes in the calendar year since recordkeeping began in 1950. The tornadoes snapped/uprooted trees, some of which fell on and damaged houses and vehicles. Minor damage to roofs and siding occurred in most instances; however, a few buildings had walls blown out or roofs lifted off. A few small planes and outbuildings were also flipped or shifted. A waterspout was spotted off the New Jersey coast, as well. In addition, an EF-1 tornado touched down in southeastern New York on November 12.
- For more information, please visit the Northeast Regional Climate Center Home Page.
Midwest Region (Information provided by the Midwest Regional Climate Center)
- Midwestern temperatures were slightly below normal for November, with a notable east-west divide. The region averaged 38.4 degrees F (3.5 C), which was 0.1 degrees F (0.1 C) below normal for the month. In the east, Illinois, Indiana, Kentucky, and Ohio had temperatures 1.5 to 3.3 degrees F (0.8 – 1.8 C) below normal. In the west, Iowa and Minnesota were 1.8 to 2.3 degrees F (1.0 – 1.3 C) above normal. Michigan, Missouri, and Wisconsin were all within 0.5 degrees F (0.3 C) of normal. November maximum and minimum temperatures followed a similar spatial pattern as average temperatures. During November there were 64 high temperature records broken, with most recorded in Iowa (26), Missouri (19), and Minnesota (13). Locations across the lower Midwest (from Missouri eastward to Ohio) recorded the first fall freeze during the first 10 days of November, which was about 1-3 weeks behind the 1991-2020 median freeze date. Fall (September-November) temperatures averaged 53.8 degrees F (12.1 C), which was 2.6 degrees F (1.4 C) above normal. Preliminary rankings show the Midwest had the 6th warmest fall on record, dating back to 1895.
- Precipitation was drier-than-normal during November across most of the Midwest. Only isolated areas in northern Minnesota, northern Wisconsin, northern Michigan, and extreme northwest Missouri had above-normal precipitation. Average total precipitation was 1.38 inches (35 mm), which was 1.16 inches (29 mm) below normal. All nine states had drier-than-normal monthly precipitation with totals ranging from 0.02 inches (1 mm) below normal in Minnesota to over 2 inches (51 mm) below normal in Illinois and Missouri. The largest precipitation deficits affected a swath from south-central Missouri to the northeast into Illinois and southern Wisconsin. Precipitation in this area was below 25 percent of normal for November. Illinois had the 9th driest November on record, dating back to 1895. Despite the overall dryness, there were 109 precipitation records broken during November, with the most in Minnesota (35), Iowa (24), and Wisconsin (20). Eighty-two precipitation records were broken on a single day (November 11th). Fall (September-November) precipitation for the Midwest totaled 8.62 inches (219 mm), which was 0.44 inches (11 mm) below normal.
- November snowfall was mixed across the northern Midwest. Locations in northeast Minnesota and northwest Wisconsin saw less than half of expected snowfall for November, whereas locations in northeast Wisconsin, Michigan, and Ohio saw double or triple the normal snowfall. As might be expected, the greatest snowfall totals were associated with lake-effect snow across northern Michigan. Gaylord, Michigan (Otsego County, north central Michigan) recorded 38 inches (97 cm) of snowfall during November. Numerous locations across Michigan’s Upper Peninsula recorded 20-35 inches (51 – 89 cm). In northern Minnesota and northern Wisconsin, snowfall totals ranged from 3-15 inches (8 – 38 cm). Northeast Ohio recorded 4-10 inches (10 – 25 cm) of snowfall for November. Less than 1 inch (2.5 cm) of snow fell in Iowa, Illinois, and most of Indiana.
- Drought continued to affect portions of the Midwest by late November, and most locations had little change in drought status throughout the last month. On November 30, about 17 percent of the region was in drought, which was a 2 percent improvement compared to early November. The most widespread severe conditions were in northern Minnesota, with moderate drought also impacting northern Wisconsin, the northern Illinois-southern Wisconsin border, and isolated areas in Iowa. Abnormal dryness was reported in about 22 percent of the Midwest on November 30, which was about a 4 percent expansion in dryness compared to early November. Most of the expansion in abnormal dryness during November was in Missouri. Over the entire fall (September – November), drought conditions showed considerable improvement. From early September to late November, drought was removed from 7 percent of the Midwest, including D4 (Exceptional Drought) being eliminated from the region. Drought conditions showed the most improvement in Minnesota and Iowa while conditions worsened throughout the fall in Wisconsin and northern Michigan.
- By late November corn and soybean harvest was nearly complete across the Midwest. Corn harvest in Michigan, Minnesota, and Wisconsin was 6-14 percent ahead of the 5-year average, and all other states were near average for late November. Soybean harvest was slightly behind the 5-year average in Illinois, Indiana, Kentucky, Michigan, and Ohio, but progress accelerated compared to recent weeks due to below average precipitation. Winter wheat emergence was 5 percent ahead of the 5-year average in Missouri and 2-5 percent behind the 5-year average in Illinois, Indiana, Michigan, and Ohio. Most of the winter wheat was in good to excellent condition across the region.
- For further details on the weather and climate events in the Midwest, see the weekly and monthly reports at the Midwest Climate Watch page.
Southeast Region (Information provided by the Southeast Regional Climate Center)
- Temperatures were below average across much of the Southeast region for the month of November. Monthly mean temperatures were at least 2 degrees F (1.1 degrees C) below average for over 57 percent of the 153 long-term (i.e., period of record equaling or exceeding 50 years) stations across the region. There were at least seven stations that observed monthly mean temperatures that were ranked within their five coldest values on record, including Concord, NC (1934-2021; 2nd coldest) and Stuart, VA (1913-2021; 3rd coldest). San Juan, PR (1898-2021), however, tied for its second warmest November on record. Maximum temperatures ranged from 1.6 degrees F (0.9 degrees C) above normal in Christiansted, USVI (1969-2021) to 4.3 degrees F (2.4 degrees C) below normal in Orangeburg, SC (1956-2021). Daily temperature minimums ranged from 1.8 degrees F (1 degree C) above normal in San Juan, PR (1898-2021) to 6.2 degrees F (3.4 degrees C) below normal in Huntsville, AL, FL (1894-2021). The warmest weather of the month occurred from the 9th through the 13th, as unusually warm air surged northward ahead of an approaching cold front. Daily maximum temperatures exceeded 70 degrees F (21 degrees C) across portions of every state. Grandfather Mountain, NC (1955-2021) had a daily maximum temperature of 67 degrees F (19.4 degrees C) on the 10th, which was 2 degrees F (1.1 degrees C) from the warmest November day on record. In contrast, the coldest weather of the month across the Southeast occurred on the 23rd through the 25th, as the circulation around a departing mid-latitude cyclone ushered in cooler and drier air from Canada. Daily minimum temperatures fell below 30 degrees F (-1.1 degrees C) across portions of every state including Florida, prompting many frost and freeze advisories. Some locations in the higher elevations of North Carolina and Virginia fell below 10 degrees F (-12.2 degrees C), including Mt Mitchell (1925-2021) with a minimum temperature of 8 degrees F (-13.3 degrees C).
- Precipitation was well below normal across much the Southeast region for November, with monthly totals ranging from 50 to less than 5 percent of normal. The driest locations were found across much of Virginia, North Carolina, South Carolina, Georgia, Alabama and Puerto Rico. Indeed, Danville, VA (1916-2021) and Hickory, NC (1949-2021) both observed their driest November on record, at 0.15 inches (3.8 mm) and 0.35 inches (8.9 mm) of precipitation, respectively. Macon, GA (1892-2021) only measured 0.29 inches (7.4 mm) of precipitation, which was more than 3 inches (76 mm) below average, making this the 2nd driest November on record. In contrast, the wettest locations for the month were located across most of the Florida Peninsula. Precipitation totals ranged from 130 to 200 percent of normal. Daytona Beach, FL (1923-2021; 9th wettest) measured 7.04 inches (179 mm) of precipitation for the month, over 4 inches (102 mm) above normal. Most of this rain (5.44 inches (138 mm)) fell in one day on November 5th, making this its 4th wettest November day on record. Heavy rain also fell in Cape Hatteras, NC (1874-2021) on November 12th, with 4.18 inches (106 mm) reported, making this the 9th wettest November day on record. Light snowfall was reported across portions of the southern Appalachians on November 5th, with 1.8 inches (45.7 mm) measured at Mt. Mitchell, NC and a trace of sleet observed as far south as Huntsville, AL.
- There were only two reports of severe weather across the Southeast during November, which is 4 percent of the median monthly frequency of 51 reports during 2000-2019. There was one confirmed tornado reported for the month (1 EF-0), which is much below the monthly average 11. This tornado had winds of 70 mph (31 m/s) and occurred in Elmore County, AL on November 11th. A dozen trees were uprooted along its path, with one tree falling on a barn. No injuries or fatalities were reported. There were no reports of hail for the month, which has an average of 2. There was one wind report for the month, which is 2.6 percent of the average (38 reports). Thunderstorms produced a wind gust of 60 mph (27 m/s) in Palm Beach, FL on the 4th, and no injuries were reported. Strong winds associated with a coastal storm damaged a pier in Rodanthe, NC on November 7th. However, no injuries were reported.
- Drought intensified across North Carolina, South Carolina, Virginia, and Puerto Rico, and abnormally dry conditions (D0) increased in coverage across portions of Georgia and Alabama in November. At the beginning of the month, pockets of moderate drought (D1) were found in North Carolina and South Carolina. By the end of the month, these pockets expanded with some areas of severe drought (D2) developing in eastern North Carolina, southern Virginia and along the border of North and South Carolina. Areas of abnormally dry conditions (D0) developed across large portions of Alabama and Georgia. Drought conditions also increased across Puerto Rico, with much of the island in moderate drought (D1) ringed by abnormally dry conditions (D0). The citrus growing region of Florida received adequate rainfall this month, allowing farmers to ease up on irrigation. The drier weather towards the end of the month allowed farmers to harvest cotton as well as seasonal fruits and vegetables. In Georgia, the drier month allowed many farmers to make significant progress with cotton and soybean harvests. Winter wheat continued to be planted with some producers irrigating fields to help with their growth. Multiple counties experienced freezing conditions and their first frost of the season. Similarly in Alabama, the dry conditions allowed for producers to finish harvesting many crops. Farmers in South Carolina noted that strawberries were slightly behind due to the drier conditions, but pastures remained in good condition.
- For more information, please visit the Southeast Regional Climate Center Home Page.
High Plains Region (Information provided by the High Plains Regional Climate Center)
- Temperature
Temperatures for the High Plains region were above normal for the month of November. While our entire region observed above-normal temperatures, the greatest departure from normal can be observed in the western half of the region. Temperature departures in the western High Plains were 4 degrees F (2.4 degrees C) and higher with some areas observing temperatures 10 degrees F (5.6 degrees C) or more above normal. As a result of these above-normal temperatures across the region, many locations ranked in the top 10 warmest November on record (see page 6 for November rankings) and some areas broke daily re¬cords throughout the month. Wyoming observed the greatest departure from normal temperatures for November with most of the state 6 degrees F (3.3 degrees C) above normal. Rawlins, WY observed its warmest November on record with an average temperature of 38.9 degrees F (3.8 degrees C) breaking a previous record of 38.5 degrees F (3.6 degrees C) set in 2017. This was a temperature departure of 7.6 de¬grees F (4.2 degrees C) above normal. A few locations observed their second warmest November on record, which included Colorado Springs, CO. Colorado Springs observed an average temperature of 45.9 degrees F (7.7 degrees C) which was 6.4 degrees F (3.6 degrees C) above normal. Throughout the month many ar¬eas in the region also exceeded daily temperature records. Pueblo, CO reached a high temperature of 75 degrees F (23.9 degrees C) for November 29th, which was 1 degree F (0.6 degrees C) above the record for that day set in 1945,1973, and 2003. On November 16th, Yankton, SD observed its warmest daily tempera¬ture of 76 degrees F (24.4 degrees C). Denver, CO reported its record for the latest measurable snowfall, which previously was November 21st, 1934, with no measurable snow seen in the month of November.
- Precipitation
November was a dry month for the High Plains with below-normal precipitation across the region. Most of the region observed less than 50 percent of normal precipitation, aside from an area in northeastern North Dakota. The largest departures from normal were observed in southwestern Colorado, eastern Kansas, and eastern Nebraska with totals as much as 3.75 inches (95.25 mm) below normal. This large area of below-normal precipitation led to many locations ranking in the top 10 driest on record for November (see page 6 for November monthly rankings). Salina, KS observed a trace of precipitation for the month which tied as the 3rd driest November on record. Goodland, KS also received very little precipitation for November receiving 4 percent of nor¬mal precipitation. With 0.02 inches (0.50 mm) of precipitation for November, Goodland observed its 7th driest November on record tied with 2014 and 1950. This has led to crop concerns in Kansas as winter crops pull moisture from the soil due to lack of precipitation. This can lead to problems in the crop season next year as soil moisture will be less than optimal. Colorado, with the largest departure from normal precipitation for November, also observed some concerns. Several locations within the state recorded among their driest. Early season snowpack in the mountains is below normal for this time of year. An above-average snowpack is essential this year due to the current drought. Without the snowpack, wa¬ter levels along the Colorado River will likely remain low. While it is still early in the season, the longer Colorado remains drier, the more precipitation later in the season it will take to make up the deficit. Despite a dry month, Northeastern North Dakota did receive above normal precipitation for November. While it was not enough to rank in the top 10 for the month, it did help contribute to a change from D1 to D0 drought conditions for that portion of the state.
- Warm and Dry in the High Plains
Warm and dry conditions were observed across the High Plains in November. Above-normal temperatures were observed across the entire region with the highest departures 10 degrees F (5.6 degrees C) and higher. Precipitation across the majority of the region was below-normal outside of a portion of northeast North Dakota and a few other isolated areas. These warm, dry conditions led to many impacts within our region. Horticulturists in Wyoming are concerned after noticing trees beginning to bud as a result of above-normal temperatures in November. While the early budding or blooming can be a pretty sight, it can be damaging to the trees. When blooming early, a sudden drop in temperatures can cause shock to the tree. It can also cause the tree’s flowers or fruits not to grow next year as they have exerted all of their energy in growing early. Concerns for tourism in western South Dakota have begun throughout November as it continues to be warm and dry in the region. Many commercial entities in the western portion of the state, such as the Black Hills, rely on business from winter sports. With the warm temperatures and lack of snow, opening dates have been pushed back without an indication of when they will be able to open. Warm temperatures have also impact¬ed their ability to create synthetic snow, as temperatures 28 degrees F (-2.2 degrees C) or below are needed. Winter crops have also been impacted by warm, dry conditions. In Kansas, warm temperatures have caused winter wheat to grow more than it should. The additional plant height can cause an increased chance of problems with plant diseases and pests. Around mid-November the crops begin to become dormant, but the warm temperatures have helped crops continue to grow using current soil moisture. With drought conditions present, use of stored soil moisture is a concern as farmers look toward next year’s crops.
Southern Region (Information provided by the Southern Regional Climate Center)
Mild, dry weather led to substantial expansion of drought conditions across the Southern Region.
- Temperatures
November 2021 was mild throughout the Southern Region, ranking from 28th warmest for Oklahoma at 51.3 °F (10.7 °C) to 40th coolest for Tennessee at 45.7 °F (7.6 °C). Overall, the region was 48th warmest on record, with an average temperature of 54.4 °F (12.4 °C). One monthly maximum temperature record was set, at Panther Junction, Texas, in Big Bend National Park, where the temperature reached 92 °F (33.3 °C) on November 1. The highest temperature overall was 95 °F (35 °C) at Rio Grande Village, also in Big Bend National Park. No monthly low temperature records were set; the lowest temperature in the Southern Region was recorded at Mt. Leconte, Tennessee, with 7 °F (-13.9 °C). By the end of the month, most of Texas and Louisiana had not yet experienced any temperatures below freezing, unlike all of Oklahoma and Tennessee and most of Arkansas and Mississippi.
- Precipitation
Across the region, precipitation ranked 13th driest historically. In order of rank were Mississippi (6th driest, 1.35 inches, 34 mm), Tennessee (8th driest, 1.56 inches, 40 mm), Louisiana (10th driest, 1.31 inches, 33 mm), Arkansas (23rd driest, 2.12 inches, 55 mm), Oklahoma (32nd driest, 0.92 inches, 23 mm), and Texas (1.13 inches, 28 mm). The largest reported rainfall total was at a station 17 miles NNE of Edinburg, in southern Texas, with 8.90 inches (226 mm). Nearby, Falcon Dam set a new record for the month of November with 3.80 inches (97 mm). Meanwhile, no measurable rainfall was recorded across a broad swath of the Texas and Oklahoma panhandles, with occasional reports of zero rainfall extending southward to the Rio Grande. For some stations near and west of Midland, there had not been measurable rainfall recorded since the first week of October.
- Drought
The overall lack of rainfall led to a substantial expansion of drought conditions across the Southern Region. The percentage of the region in drought grew from 23% on November 2 to 42% on November 30, according to the US Drought Monitor. Severe drought expanded from 4% to 12% during the same period. Drought grew in all six states, particularly along the Lower Mississippi River valley and in central and western parts of Texas and Oklahoma. Drought improvement was confined mostly to northern and southern Texas. The impacts of drought were primarily agricultural, with problems establishing the winter wheat crop and cool season forage. The wildfire risk also remains elevated. With a weak to moderate La Niña likely to persist until spring, continued drying is likely, especially for Texas.
- Severe Weather
Severe weather on November 10 and 11 struck parts of the Dallas-Fort Worth, Oklahoma City, and Tulsa metropolitan areas, along with rural parts of northern Texas and central Oklahoma. Most of the severe weather was in the form of hail, with one report of 2 inch (5 cm) hail in Haynesville, Oklahoma and numerous other hail reports exceeding 1 inch (2.5 cm). The severe weather in the Tulsa area on November 11 was largely in the form of wind damage. One EF0 tornado touched down within Tulsa itself, about two miles southwest of downtown, uprooting trees and damaging limbs. Two other EF0 tornadoes touched down on the eastern outskirts of the city. That same day, four tornadoes struck east Texas and northwest Louisiana near Marshall and Shreveport. Two of the tornadoes were rated EF1; the other two were EF0. Lastly, November 21 brought 1.25 inch (3 cm) hail to the vicinity of Diaz in northeastern Arkansas. No injuries were reported from any of the severe weather.
- For more information, please visit the Southern Regional Climate Center Home Page.
Western Region (Information provided by the Western Region Climate Center)
- A blocking ridge of high pressure in the Western US and deep low pressure centered over southcentral Alaska persisted for much of the month. This resulted in above normal temperatures across the entire West with well below normal temperatures, record breaking in some cases, for Alaska. The storm tracked allowed for several moderate to strong atmospheric rivers to impact Oregon and Washington during November 10-16 with above normal precipitation for the month in most of Washington. These storms brought flooding, mudslides, and strong winds to northern Washington. Few storms and little moisture occurred for the rest of the West leading to well below normal precipitation and a slow start to mountain snowpack accumulation.
- Record warm temperatures were widespread across southern Nevada, southern California, and western Arizona. A few of those records include Las Vegas, Nevada at 63.4 °F (17.4 °C), +6.2 °F (+3.4 °C) above normal, Salinas, California at 61.4 °F (16.3 °C), +5.3 °F (+2.9 °C) above normal, and Blythe, California at 67.9 °F (19.9 °C), +5 °F (+2.7 °C) above normal. Several major cities saw their second warmest November on record: Reno, Nevada at 47.8 °F (8.8 °C), +4 °F (+2.2 °C) above normal, Phoenix, Arizona at 70.1 °F (21.2 °C), +5 °F (+2.7 °C) above normal, and Tucson, Arizona at 67 °F (19.4 °C), +5.5 °F (+3 °C) above normal. A low-lying fog layer known as Tule fog occurred frequently throughout the month and was confined to California’s Central Valley leading to noticeably smaller, although still positive, temperature anomalies across the region compared to other parts of the state. For example, Sacramento, California recorded a monthly mean temperature of 56.6 °F (13.7 °C) which is only +1.3 °F (+0.8 °C) above normal.
- Warmth in California and the Southwest was accompanied by little-to-no precipitation for the region during November. Las Vegas, Nevada, Phoenix, Arizona, Los Angeles, California, and San Diego, California all logged zero precipitation for the month tying record low values at all four locations. Novembers with zero precipitation have happened in the past; for example, Los Angeles, California has had 15 Novembers with zero precipitation since 1877. Northern Washington was the one area of the West that was anomalously wet for the month with multiple moderate-to-strong atmospheric rivers impacting the region. Bellingham, Washington received a record breaking 14.57 in (370 mm; 280% of normal) of precipitation for the month breaking the previous record of 11.6 in (295 mm) set in 1990. The Olympic Peninsula also saw well above normal precipitation; Quillayute, Washington logged 27.56 in (700 mm; 181% of normal) coming in as the second wettest since 1966. Seattle, Washington received 10.26 in (261 mm; 163% of normal) for the 5th wettest on record; this was the wettest Autumn on record for Seattle since 1945.
- Drought conditions persisted throughout the month across most of the West due to warm and dry weather. At the end of November 94% of the West was in drought according to the US Drought Monitor with 14% of the region experiencing exceptional drought (D4). The only part of the West without any drought (D1-D4) or abnormal dryness (D0) is western Washington and a small portion of northwest Oregon. Drought conditions worsened throughout the month in parts of New Mexico, Wyoming, and Montana. Most of Alaska saw well below normal temperatures with the exception of the northeast interior and panhandle that were near-to-slightly above normal. Southcentral and most of western Alaska was quite cold with monthly temperature anomalies ranging from -6 °F to -20 °F below normal. Dry conditions with below normal precipitation accompanied the cold weather. King Salmon was the coldest on record since 1918 at 4 °F (-16 °C), -21 °F (-12 °C) below normal and eighth driest with 0.17 in (4.3 mm; 10% of normal). Iliaman was also the coldest record at 7.1 °F (-13.8 °C), -20 °F (-11.1 °C) below normal and came in at the fourth driest on record with 0.11 in (2.8 mm; 5% of normal). Bethel was the second coldest on record since 1923 at 0.7 °F (-17.4 °C), -17.8 °F (-9.9 °C) below normal and the ninth driest logging 0.16 in (4.1 mm; 9% of normal).
- Across Hawaii precipitation was well below normal for the month with many long-term stations less than 50% of normal. Honolulu recorded 0.09 in (2.3 mm; 4% of normal) for the fourth driest since records began in 1942, Lanai City logged 0.21 in (5.3 mm; 8% of normal) for the fifth driest on record, and Molokai received 0.33 in (8.44 mm; 12% of normal) making it the fifth driest on record since 1949. Drought conditions continued to degrade with 57% of the state in drought (D1-D4) and 11% in extreme or exceptional drought (D3-D4).
- Series of atmospheric rivers impact northern Washington residents:The northern Washington town of Sumas located near the Canadian border, population about 1,600, reported about 75% of homes in the town were damaged by flood waters in mid-November following a series of atmospheric rivers. The storms also knocked out power for more than 24 hours. Road closures due to mudslides were also reported in the region. Luckily, no injuries or deaths were reported.