National Overview

September Highlights

September Temperature

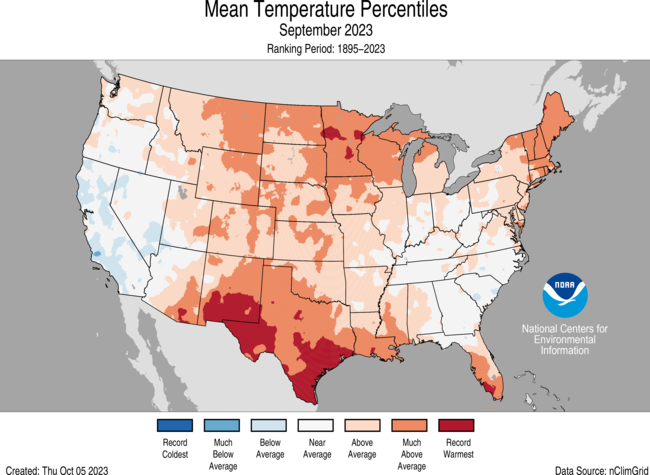
The contiguous U.S. average temperature during September was 67.8°F, 2.9°F above average, ranking seventh warmest in the 129-year record.
Generally, temperatures were above average across much of the contiguous U.S., with below-normal temperatures in southern parts of the West Coast and in parts of the Southeast.
For the month of September, New Mexico and Texas ranked warmest on record for September. An additional 11 states ranked among their top-10 warmest September on record.
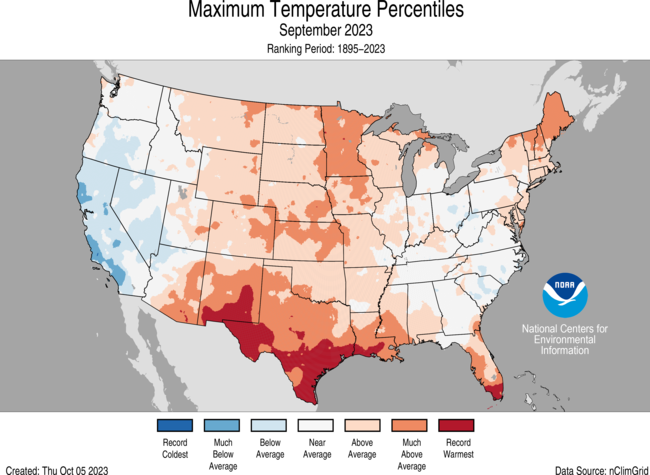
The contiguous U.S. average maximum (daytime) temperature during September was 80.5°F, 2.7°F above the 20th century average, ranking 12th warmest September for daytime temperatures in the historical record. Maximum temperatures were above average across much of the central contiguous U.S. and in parts of the Northeast and Southeast. Temperatures were below average across parts of the West Coast, Ohio Valley and Southeast. Texas ranked warmest on record, while New Mexico had its third warmest September for daytime temperatures. Three additional states ranked among their top-10 warmest September for daytime temperatures.
The contiguous U.S. average minimum (nighttime) temperature during September was 55.1°F, 3.2°F above the 20th century average, ranking 5th warmest September for overnight temperatures on record. Minimum temperatures were above average across much of the contiguous U.S. while near- or below-normal temperatures were observed in parts of the Southwest and Southeast. Minnesota, Maine and New Hampshire ranked warmest on record for September while Texas and Wisconsin each ranked second warmest September on record. An additional 12 states experienced a top-10 warmest September for nighttime temperatures.
The Alaska statewide September temperature was 40.6°F, ranking near normal in the 99-year period of record for the state. Temperatures were near average across most of the state with above-normal temperatures observed in parts of North Slope, the Aleutians and Panhandle, while below-normal temperatures were observed in parts of the Interior and southwest Alaska.
Based on NOAA's Residential Energy Demand Temperature Index (REDTI), the contiguous U.S. temperature-related energy demand during September was 137 percent of average and the 25th-highest value in the 129-year period of record.
September Precipitation

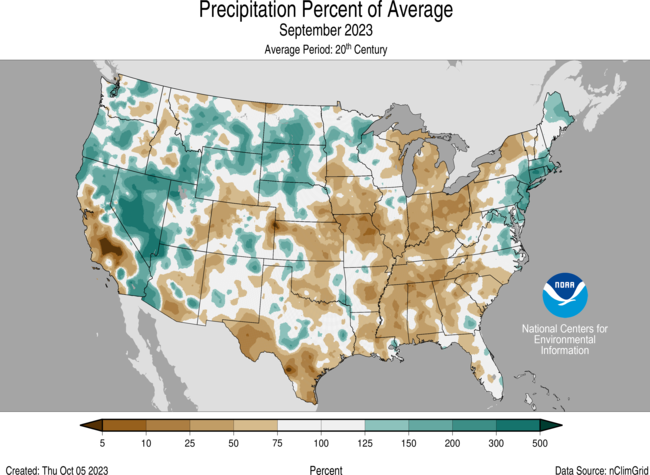
The September precipitation total for the contiguous U.S. was 2.10 inches, 0.39 inch below average, ranking in the driest third of the 129-year record.
Precipitation was below average across much of the Mississippi Valley, Great Lakes and Ohio and Tennessee valleys as well as in parts of the Southwest, southern Plains and Southeast. Precipitation was above average across much of the West and northern Plains and along parts of the East Coast.
Connecticut had its third-wettest September on record, while two additional states had their top-10 wettest September on record. Conversely, Ohio ranked fifth driest on record for the month with two additional states ranking among their top-10 driest September on record.
Across the state of Alaska, the average monthly precipitation was 5.05 inches, ranking in the middle third of the historical record. Conditions were near average across much of the state while wetter-than-average conditions were observed across parts of the North Slope, eastern Interior and Panhandle. Below-normal precipitation was observed in parts of Southwest Alaska, including parts of the Aleutians, during the month.
According to the October 3 U.S. Drought Monitor, about 40.1% of the contiguous U.S. was in drought, up about 5.8% from the end of August. Drought conditions expanded or intensified across much of the Ohio and Tennessee valleys and Lower Mississippi Valley, and in parts of the Northwest, Southwest, eastern Plains, Hawaii and Puerto Rico this month. Drought contracted or was reduced in intensity across portions of the Northern Tier, western Plains, Upper Midwest and Mid-Atlantic.
Billion-Dollar Weather and Climate Disasters
One new billion-dollar weather and climate disaster was confirmed this month after a drought and heatwave event that affected portions of the Southern and Midwestern U.S. this year.
There have been 24 confirmed weather and climate disaster events this year, each with losses exceeding $1 billion. These disasters consisted of 18 severe storm events, two flooding events, one tropical cyclone, one winter storm, one wildfire and one drought and heatwave event. For this year-to-date period, the first nine months of 2023 rank highest for disaster count, ahead of those of 2017 and 2020 which both saw 17 disasters. The total cost of the 2023 events exceeds $67.1 billion, and they have resulted in 373 direct and indirect fatalities.
Since these billion-dollar disaster records began in 1980, the U.S. has sustained 372 separate weather and climate disasters where overall damages/costs reached or exceeded $1 billion (based on the CPI adjustment to 2023) per event. The total cost of these 372 events exceeds $2.630 trillion.
Other Notable Events
Persistent heat brought record-breaking temperatures to portions of the U.S. during September:
- It was the warmest September on record for Texas by nearly 0.3°F, and New Mexico tied with 2015 and 2019 as the warmest September on record.
- A total of 111 counties each had their warmest September on record while an additional 582 counties ranked in the top-10 warmest for the month. For the January–September period, 317 counties were record warm while an additional 1,450 counties ranked in the top-10 for this year-to-date period. There are 3,143 counties in the U.S.
- Record-high temperatures have persisted across much of Puerto Rico and the U.S. Virgin Islands during the month of September. San Juan reported a monthly average temperature of 85.8°F, making it the hottest month on record. Also, on St. Croix, Rohlsen Airport had their warmest September on record.
- Warm temperatures and lack of rainfall resulted in persistent drought across parts of the Midwest, leading to near-record low water levels along parts of the Mississippi River, and creating saltwater intrusion concerns in southern Louisiana.
Several notable storms impacted portions of the U.S. in September:
- On September 12, a frontal system combined with sub-tropical moisture brought nearly 10 inches of rainfall to parts of Massachusetts and Rhode Island within a six-hour period. The National Weather Service office in Boston deemed this a 200-year rainfall event.
- On September 14-16, Hurricane Lee brought catastrophic flash flooding and damage to portions of New England.
- On September 23, Tropical Storm Ophelia made landfall in eastern North Carolina and moved north along the East Coast. Ophelia brought heavy rainfall and flooding from North Carolina to Massachusetts, resulting in significant damage and power outages.
- On September 24-26, a bomb cyclone brought heavy precipitation to much of the Pacific Northwest. Seattle had three of their five wettest days so far this year—the precipitation total was more than double of what the city received over the entire summer season.
- On September 29, a slow-moving storm brought heavy rainfall to New York City, grounding flights, flooding roads and subways and trapping residents in their homes. Parts of Brooklyn reported more than 7 inches of rainfall, while John F. Kennedy Airport received 8.65 inches—setting a new 24-hour precipitation record for the month which was previously set by Hurricane Donna in 1960.
Year-to-Date Highlights


January-September Temperature

For the January-September period, the average contiguous U.S. temperature was 57.0°F, 1.9°F above average, ranking 10th warmest on record for this period.
Temperatures were above average from parts of the Southwest to the East Coast and along parts of the Northern Tier, with near- to below-average temperatures from parts of the northern Plains to the West Coast.
Texas, Louisiana, Mississippi and Florida ranked warmest on record while Delaware and Maryland each ranked second warmest for the January–September period. An additional 24 states had a top-10 warmest year-to-date period. No state experienced a top-10 coldest event for this nine-month period.
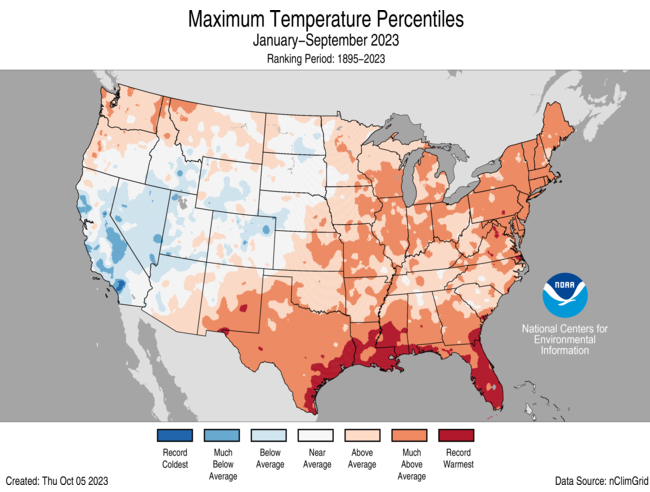
The contiguous U.S. average maximum (daytime) temperature during January-September was 69.0°F, 1.7°F above the 20th century average, ranking 16th warmest in the historical record. Above-average temperatures were observed across much of the eastern contiguous U.S., the southern Plains and along portions of the Northern Tier. Near- to below-average temperatures were observed from the northern Plains to the West Coast. Louisiana and Florida ranked warmest on record, while Texas ranked second warmest for daytime temperatures during January-September period. An additional 19 states ranked among their top-10 warmest for daytime temperatures during this period. No state experienced a top-10 coldest September on record for this nine-month period.
The contiguous U.S. average minimum (nighttime) temperature during this nine-month period was 45.0°F, 2.1°F above the 20th century average, ranking 8th warmest in the historical record. Above-average nighttime temperatures were observed across much of the contiguous U.S. Texas, Louisiana, Mississippi, Alabama, Florida, New Hampshire, Massachusetts and Rhode Island each ranked warmest on record, while Maine, Vermont and Connecticut each ranked second warmest on record for nighttime temperatures. 16 additional states experienced a top-10 warmest event for nighttime temperatures during the January-September period. Near- to below-average nighttime temperatures were observed in parts of the central Plains to the West Coast.
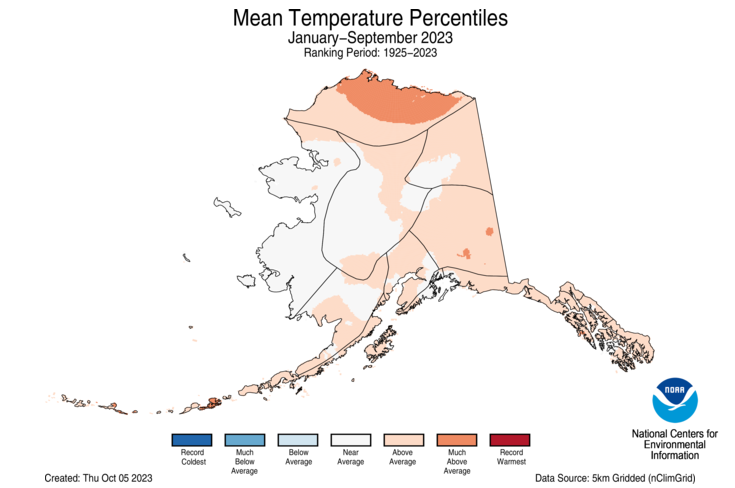
The Alaska January-September temperature was 31.9°F, 1.8°F above the long-term average, ranking in the warmest third of the historical record for the state. Much of the state was above normal for the nine-month period while temperatures were near average across much of western Alaska and in parts of the Interior.
Based on REDTI, the contiguous U.S. temperature-related energy demand during January-September was 42 percent of average and was the 10th-lowest value on record.
January-September Precipitation
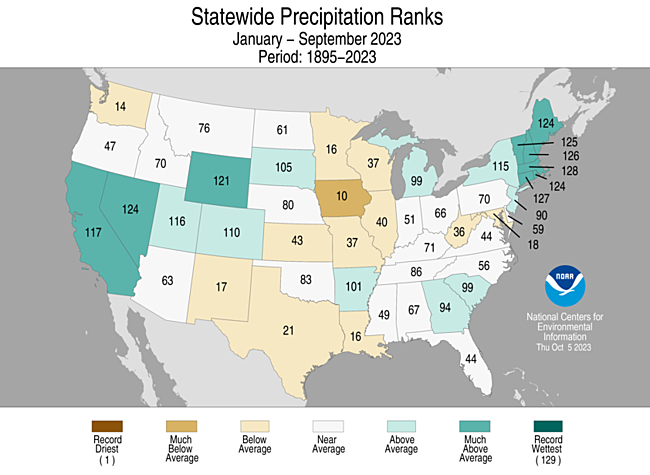
The January-September precipitation total for the contiguous U.S. was 23.32 inches, 0.12 inch above average, ranking in the middle third of the 129-year record.
Precipitation was near to above average from California to the western Great Plains, in the Northeast and in parts of the Mid-Mississippi Valley, northern Great Lakes and Southeast. Massachusetts had its second wettest January-September period on record while Connecticut had its third wettest for this year-to-date period. Six additional states ranked among their top-10 wettest for this period.
Conversely, precipitation was below average along parts of the Northern Tier, from parts of the Southwest to the Gulf of Mexico and in parts of the upper and central Mississippi Valley and Mid-Atlantic during the January–September period. Iowa ranked 10th driest on record for this nine-month period.
The January-September precipitation ranked 14th wettest in the 99-year record for Alaska, with above-average precipitation observed across much of the state. Near- to below-normal precipitation was observed along parts of the Gulf of Alaska, while parts of the Aleutians experienced below-average precipitation during this period.
Extremes
The U.S. Climate Extremes Index (USCEI) for the year-to-date period was 32 percent above average, ranking in the upper third of the 114-year period of record. Extremes in warm maximum temperatures, warm minimum temperatures and days with precipitation were the major contributors to this elevated CEI value. The USCEI is an index that tracks extremes (occurring in the upper or lower 10 percent of the record) in temperature, precipitation and drought across the contiguous United States.
On the regional scale, the Ohio Valley and West were above average while the Northeast, Southeast and South ranked much-above average for this year-to-date period. Each of these regions, except for the West, experienced elevated extremes in warm maximum temperatures and warm minimum temperatures. The West experienced elevated extremes in 1-day precipitation, number of days with precipitation and wet PDSI values. The South also experienced dry PDSI values while the Southeast experienced elevated extremes in days with precipitation and the Northeast experienced elevated extremes in wet PDSI values and days with precipitation.
Monthly Outlook
According to the September 30 One-Month Outlook from the Climate Prediction Center, much of the contiguous U.S. and Alaska favor above-normal monthly average temperatures in October, with the greatest odds for parts of the north-central U.S. and northern Alaska. Below-normal temperatures are not forecast for any parts of the contiguous U.S. or Alaska this month. Large portions of the West and Alaska are favored to see above-normal monthly total precipitation while below-normal precipitation is most likely to occur from the Mississippi Valley to the East Coast and in small parts of the Northwest. Drought improvement or removal is forecast in parts of the Plains, Florida Peninsula and Puerto Rico, while persistence is more likely across the Northern Tier, Southwest, Mississippi Valley, Ohio Valley, Mid-Atlantic and Hawaii. Drought development is likely in parts of the Northwest and Southeast.
According to the One-Month Outlook issued on October 1 from the National Interagency Fire Center, Hawaii and from the Lower Mississippi Valley to parts of the Mid-Atlantic have above-normal significant wildland fire potential during October, while parts of southern coast of California are expected to have below-normal potential for the month.
Regional Highlights
These regional summaries were provided by the six Regional Climate Centers and reflect conditions in their respective regions. These six regions differ spatially from the nine climatic regions of the National Centers for Environmental Information.
Northeast (Information provided by the Northeast Regional Climate Center)
September started with record warm temperatures and ended with record wet conditions.
Temperature
The Northeast had its 10th warmest September since records began in 1895 with an average temperature of 63.5 degrees F, which was 1.9 degrees F above normal. Average temperatures for September in the 12 Northeast states ranged from 0.3 degrees F in West Virginia to 4.4 degrees F above normal in Maine. This September ranked among the 20 warmest Septembers on record for 10 states: Vermont, third warmest; Maine and New Hampshire, fourth warmest; Rhode Island, fifth warmest; Massachusetts, eighth warmest; Connecticut, 10th warmest; New Jersey, 13th warmest; Delaware, 17th warmest; and Maryland and New York, 20th warmest. On September 6, Dulles Airport, Virginia, recorded a high of 100 degrees F, its hottest September temperature on record. On September 8, Islip, New York, and Caribou, Maine, had their warmest low temperatures on record for September at 77 degrees F and 67 degrees F, respectively.
Precipitation
The Northeast received 4.04 inches of precipitation during September, which was 100 percent of normal. September precipitation for the 12 Northeast states ranged from 71 percent of normal in West Virginia to 215 percent of normal in Connecticut, with eight states being wetter than normal. This September ranked among the 20 wettest on record for five states: Connecticut, fourth wettest; New Jersey, ninth wettest; Delaware, 14th wettest; Rhode Island, 18th wettest; and Massachusetts, 20th wettest. Kennedy Airport, New York, experienced its wettest September on record with 13.01 inches of precipitation, beating the old record of 9.65 inches set in 1975. Much of this precipitation fell on September 29, which became Kennedy Airport’s all-time wettest day for any month on record with 8.05 inches of rain. Similarly, LaGuardia Airport, New York, also had its wettest September on record with 12.76 inches of precipitation, surpassing its old record of 10.28 inches from 2004.
Drought
The U.S. Drought Monitor from September 5 showed 2 percent of the Northeast in moderate drought and 5 percent as abnormally dry. Interior parts of the Northeast including western West Virginia, western Pennsylvania, and western New York saw increasing precipitation deficits, below-normal streamflow, and declining soil moisture, leading to the expansion of abnormal dryness. However, heavy precipitation, particularly in late September, chipped away at drought and dryness in the Mid-Atlantic. The U.S. Drought Monitor from September 26 showed 1 percent of the Northeast in moderate drought and 10 percent as abnormally dry. At times during September, USGS 7-day average streamflow and/or groundwater levels were below normal or lower for western New York, northwestern Pennsylvania, and an area stretching from eastern West Virginia into southern New Jersey, with a couple of gauges reporting record low flows or levels. At least 18 water suppliers in Pennsylvania and several in Maryland and eastern West Virginia asked customers to voluntarily conserve water. Mandatory water restrictions were implemented by a few water suppliers in southern Pennsylvania. Daily drought monitoring operations were in place through much of September along the Potomac River upstream from Washington, D.C., with low water levels causing boat tours to be cancelled along the historic Chesapeake and Ohio (C&O) Canal, which runs along the river, early in the month. In south-central Pennsylvania, some ponds and streams that firefighters use to fight fires in rural areas dried up or ran low and crops such as apples and corn were harvested earlier than usual due to dry conditions.
Notable Weather
The first 10 days of September were unusually mild, with highs ranging from 80 degrees F to 100 degrees F and lows in the 60s and 70s. Dulles Airport, Virginia, saw its hottest September temperature on record, while Islip, New York, and Caribou, Maine, had record warm low temperatures for September. The high and/or low temperatures at several other sites ranked among the 10 warmest for September, in some cases for multiple days. For instance, Baltimore, Maryland, saw five days during this event that ranked among its 10 warmest high temperatures for September. Severe weather or flash flooding occurred almost daily from September 7 to 13. A few examples are below:
- September 9: A flash flood event in northeastern Pennsylvania washed out bridges and roads, led to evacuations and water rescues, and resulted in at least two deaths and a few injuries.
- September 11: The National Weather Service issued a Flash Flood Emergency for part of central Massachusetts due to significant flash flooding from 9.50 inches of rain. There were dozens of evacuations and water rescues as floodwaters swamped buildings and roads. Hundreds of homes were damaged in the event.
- September 13: Four weak tornadoes damaged trees and roofs in southern New England.
From mid to late September, two tropical systems affected the Northeast. Hurricane Lee produced rough surf and rip currents along the East Coast from around September 13 to 16 as it traveled in the Atlantic Ocean toward eventual landfall in western Nova Scotia. The highest wind gusts ranged from 40 to 60 mph in coastal Massachusetts and Maine, which saw the greatest impacts. Downed trees and wires led to tens of thousands of power outages in Maine, including around 30 percent of customers in Washington County. That county also saw the greatest rainfall totals of up to 6.50 inches, resulting in flooded roads and basements. One storm-related death and a few injuries were reported in Maine. Tropical Storm Ophelia formed along the southeast U.S. coast on September 22 and made landfall in North Carolina on September 23. The storm’s remnants traveled across the Mid-Atlantic states and stalled off the coast through September 26. One of the storm’s big impacts was multiple days of higher-than-usual water levels, resulting in beach and dune erosion and flooding for coastal areas from Maryland to New Jersey. Some of those same areas saw the greatest rainfall totals of over 3 inches, with coastal New Jersey seeing over 4 inches, and the highest wind gusts of 40 to 60 mph, with scattered reports of downed trees and wires. Ophelia’s remnants drifted south and merged with another storm, helping produce an extreme rainfall event that led to major flash flooding in the New York City metro area on September 29. The greatest rainfall totals ranged from 4 to 9 inches, in some cases more than a month’s worth of rain in a single day. Kennedy Airport, New York, picked up 8.05 inches of rain, making it the site’s all-time wettest day since its records began in 1948 and qualifying as a 100-year storm event with a 1 percent chance of occurring in any given year. The rainfall pushed the airport’s September total to 13.01 inches, which ranked as the wettest September and fourth all-time wettest month for the site. Central Park, New York, recorded 5.48 inches of rain, ranking as its ninth all-time wettest day since recordkeeping began in 1869. The site picked up 2.98 inches of that in two hours, which equates to a 25-year storm event with a 4 percent chance of occurring in any given year. Travel became nearly impossible as the rain flooded roadways including portions of major thoroughfares such as FDR Drive. Some motorists abandoned vehicles, while others became trapped, with dozens of water rescues reported. Bus service was suspended in some areas as dozens of buses got stuck in floodwaters, while around half of New York City’s subway system was partially or fully shut down. Meanwhile, at LaGuardia Airport, floodwaters entered a terminal and swamped the refueling area, leading to flight delays and cancellations, and at Kenney Airport, flight delays topped 3 hours. Multiple buildings including basement apartments and at least 150 schools experienced flooding. Additionally, smoke from wildfires burning in Canada returned to the Northeast in late September and lingered into early October, producing hazy skies and, in some locations, reduced air quality.
For more information, please visit the Northeast Regional Climate Center Home Page.
Midwest Region (Information provided by the Midwest Regional Climate Center)
Temperature
The average September temperature for the Midwest was 66 degrees F (18.9 degrees C), which was 2.4 degrees F (1.3 degrees C) above the 1991-2020 normal. Temperatures ranged from near normal in the east to up to 5 degrees F (2.8 degrees C) above normal in the west. Preliminary statewide average temperatures ranged from 0.5 degrees F (0.3 degrees C) above normal in Kentucky to 4.9 degrees F (2.7 degrees C) above normal in Minnesota. Preliminary rankings indicate Minnesota had the 2nd warmest September on record and Wisconsin had the 5th warmest. Minneapolis, Minnesota had its warmest September in 151 years. Duluth, Minnesota had its 3rd warmest September in 150 years. Duluth also recorded its first-ever temperature at or above 95 degrees F (35 degrees C) in September, with a temperature of 97 degrees F (36.1 degrees C) on September 3. With 28 days, St. Louis, Missouri tied the record for the greatest number of days in September with maximum temperatures at or above 80 degrees F (26.7 degrees C), dating back 148 years. September started with record warmth regionwide, with notable warmth in the northwestern portion of the region. Three-day average temperatures from September 2-4 ranged from 95-100 degrees F (35-37.8 degrees C) for many locations in Iowa, Minnesota, and Wisconsin. Conditions flipped briefly in mid-September, with below-normal temperatures blanketing the Midwest. On September 13 and 14, the region’s first frost advisories for the season were issued across northern Wisconsin and northern Michigan, and temperatures across upper Minnesota dipped below freezing. The month ended with unseasonable warmth as temperatures soared over 90 degrees F (32.2 degrees C). Across the region, temperatures averaged 2-12 degrees F (1.1-6.7 degrees C) above normal during the last week of September.
Precipitation
September precipitation totaled 2.38 inches (60 mm) for the Midwest, which was 1.04 inches (26 mm) below normal, or 70 percent of normal. While most of the region had precipitation that was 10-75 percent of normal, precipitation was 75-200 percent of normal from northern Illinois northward into Wisconsin and eastern Minnesota. Preliminary statewide precipitation totals ranged from 2.17 inches (55 mm) below normal in Ohio to 0.27 inches (7 mm) above normal in Minnesota. Preliminary rankings indicate Ohio had its 6th driest September since 1895. Youngstown, Ohio had its 2nd driest September in 96 years. Sault Ste Marie, Michigan had its 3rd driest September in 136 years. Green Bay, Wisconsin had its 4th driest September in 138 years. Conversely, Duluth, Minnesota had its 2nd wettest September in 150 years, with 10.36 inches (263 mm) of rainfall. The greater Duluth area recorded multiple extreme rain events throughout the month, including nearly 4 inches (101.6 mm) on the 6th, over 3 inches (76.2 mm) on the 12th, and over 5 inches (127 mm) from the 24th to the 25th. The Chicago area was hit hard by heavy rains on September 17, with an isolated pocket of 3-6 inches (76.2-152.4 mm) resulting in destructive flash flooding across the south suburbs.
Drought
Abnormal dryness and drought expanded across the Midwest during September, affecting portions of all nine Midwestern states. The month concluded with about 83 percent of the region dry or in drought, up about 18 percent compared to the start of September. The most severe and widespread drought persisted in the northwest, although normal to above-normal precipitation slightly improved conditions in Minnesota and Wisconsin. Iowa exceeded 170 consecutive weeks of at least moderate drought, the longest drought for the state in the U.S. Drought Monitor’s nearly 24-year period of record. In the east, moderate drought expanded into Indiana, Kentucky, and Ohio as precipitation deficits grew throughout the month.
Notable Weather
For further details on the weather and climate events in the Midwest, see the weekly and monthly reports at the Midwest Climate Watch page.
Southeast (Information provided by the Southeast Regional Climate Center)
Temperature
Mean temperatures were variable across the Southeast in September. Temperatures were 1 to 3 degrees F (0.5 to 1.6 degrees C) below average across central and eastern portions of Alabama, Georgia, and the Carolinas. In contrast, monthly temperatures were 1 to 3 degrees F (0.5 to 1.6 degrees C) above average across the West Coast of Florida, southern portions of Alabama and Georgia, western North Carolina, and northern and eastern portions of Virginia. Fort Myers, FL (1902-2023) tied it second warmest September, Key West, FL (1871-2023) and Miami, FL (1895-2023) recorded their third warmest September, Tampa, FL (1890-2023) tied its third warmest September, Sarasota, FL (1911-2023) recorded its fourth warmest September, and Wallops Island, VA (1966-2023) tied its fifth warmest September on record. Remarkably, some of the greatest monthly temperature departures in the region were found across the Caribbean, which typically sees small temperature variations due to its tropical latitude. San Juan, PR recorded its warmest month on record (since 1898) with a mean temperature of 85.8 degrees F (29.9 degrees C), breaking the previous record of 85.7 degrees F (29.8 degrees C) set in June 2012. Saint Croix also recorded its warmest month on record (since 1951) with a mean temperature of 87.7 degrees F (30.9 degrees C), breaking the previous record set last month by a full 1-degree F (0.5 degrees C). Lastly, Saint Thomas recorded its third warmest September on record (since 1953). The warmest weather of the month occurred from the 4th to the 8th, as a warm-core ridge dominated the region ahead of a cold front. Reagan National Airport recorded its warmest 5-day stretch on record (since 1872) outside of meteorological summer during this period with a mean temperature of 86.3 degrees F (30.2 degrees C). Nearby Washington Dulles Airport reached 100 degrees F (37.8 degrees C) on the 6th, its highest maximum temperature for any September day on record (since 1962). Brunswick, GA reached 97 degrees F (36.1 degrees C) on the 6th, which was 1 degree F (0.5 degrees C) shy of its highest maximum temperature for any September day on record (since 1948). That same day, Richmond, VA (1871-2023) and Raleigh-Durham, NC (1887-2023) came within 2 degrees F (1.1 degrees C) of their highest temperature for any September day with temperatures of 101 degrees F (38.3 degrees C) and 102 degrees F (38.9 degrees C), respectively. Raleigh-Durham also reached 102 degrees F (38.9 degrees C) the next day. On the 13th of the month, Miami, FL reached 96 degrees F (35.6 degrees C), which was 1 degree F (0.5 degrees C) shy of its highest maximum temperature for any September day on record.
Precipitation
Monthly precipitation was below average across much of the Southeast region in September. The driest locations were found across Alabama and northwest Florida, the West Coast of Florida, northern portions of Georgia, South Carolina, and western North Carolina, as well as southeastern North Carolina, where monthly precipitation was less than half and, in some cases, less than a quarter of the expected amount. Muscle Shoals, AL recorded its second driest September on record (since 1893) with just 0.06 inches (1.5 mm) of precipitation. Athens, GA (1898-2023) and Sarasota, FL (1911-2023) recorded their third driest September on record with 0.18 and 1.88 inches (4.6 and 47.8 mm) of precipitation, respectively. Lenoir, NC, located in the western foothills, tied its fourth driest September on record (since 1871) with just 0.65 inches (16.5 mm) of precipitation. Dry weather persisted in the U.S. Virgin Islands. Saint Croix recorded its third driest September on record (since 1951) with 0.76 inches (19.3 mm) of precipitation, while Saint Thomas recorded 2.31 inches (58.7 mm), which is 39 percent of normal. Through the first nine months of the year, Saint Croix has received about 55 percent of its expected precipitation, while Saint Thomas has received about 47 percent. In contrast, above average precipitation was found across the East Coast of Florida, southern Georgia, and eastern portions of North Carolina and Virginia, where most monthly totals were 2 to 4 inches (50.8 to 101.6 mm) above average (125 to 150 percent of normal). The wettest locations were found in Florida, where places like Miami, Fort Lauderdale, West Palm Beach, Melbourne, and Daytona Beach, recorded over 10 inches (254 mm) of precipitation for the month, while a few locations in southern Georgia recorded just under that amount. Blacksburg, VA recorded its third wettest day on record (since 1893) with 4.42 inches (112 mm) on the 10th as a frontal boundary stalled across the region. Tropical Storm Ophelia dropped 3 to 6 inches (76.2 to 152 mm) of precipitation across eastern portions of North Carolina and Virginia on 22nd and 23rd of the month, with some CoCoRaHS stations recording over 8 inches (203 mm). Cape Carteret, NC, just inland from where Ophelia made landfall, recorded 7.65 inches (194 mm) on the 23rd, making it the fifth wettest day on record (since 1955). Precipitation was variable across Puerto Rico in September. Above average amounts were found across the western interior and southern slopes, while monthly totals were generally less than 50 percent of normal across the remainder of the island.
Drought
At the start of the month, about 26 percent of the region was dry or in drought according to the U.S. Drought Monitor. Moderate (D1) and severe (D2) drought expanded across southern Alabama and the western Panhandle of Florida, with small areas of extreme (D3) drought emerging during the month. Moderate (D1) to extreme (D3) drought expanded slightly across the West Coast of Florida. Moderate (D1) drought emerged across northern portions of Alabama and Georgia, extreme southwest Georgia, and the Eastern Shore of Virginia. Moderate (D1) drought expanded across northern Virginia, while severe (D2) drought persisted across the Shenandoah Valley. Abnormal dryness (D0) expanded across western Alabama, emerged in northeast Florida, and persisted across central portions of Georgia and the Carolinas. Tropical Storm Ophelia helped alleviate some areas of abnormal dryness (D0) and moderate (D1) drought across eastern North Carolina and Virginia. Overall, about 37 percent of the region was dry or in drought by the end of September. In the Caribbean, abnormal dryness (D0) expanded across Puerto Rico and the outlying islands. Severe (D2) drought re-emerged on the northwest side of the island but improved to moderate (D1) drought by the end of the month. Moderate (D1) drought also emerged on the northeast side of the island, including the San Juan area. Drought conditions continued to deteriorate in the U.S. Virgin Islands, with severe (D2) drought emerging on Saint John and exceptional (D4) drought emerging on Saint Thomas and Saint Croix by the end of the month.
Agriculture
While Hurricane Idalia brough much-needed precipitation to parts of the region, especially the Florida citrus belt, it also delayed numerous field activities at the beginning of the month, particularly in parts of southern Georgia. Losses from the storm now exceed $450 million in Florida. The generally dry weather the rest of the month allowed operators to conduct a significant amount of fieldwork. Corn harvest was nearing completion and yields were looking good in many places, particularly in Georgia and South Carolina. Conversely, crop progress was slower in Alabama and Virginia. Favorable weather conditions during the month allowed farmers to cut and bale third and fourth cuttings of hay. Early planted soybeans and cotton made good progress. Dry soils delayed peanut digging in parts of Alabama and Georgia, while some cotton damage was noted. Fall vegetables progressed well in places with adequate rain or irrigation and conditions were generally favorable for cover crop planting. Drought conditions have negatively affected many crops in Virginia, including pumpkins and apples, and some yields are expected to be 50 percent lower compared to last year. The continued heat and lack of precipitation resulted in crop damage and some delayed harvests across parts of the Florida Panhandle. Rice harvest was also delayed across South Florida due to heavy precipitation. Livestock and pastures were in generally good to fair condition across the region. While cooler temperatures helped reduce heat stress, lingering moisture deficits and poor grazing conditions forced operators to use supplemental feed. Planting of fall and winter grasses, as well as winter wheat, were delayed in places due to dry soils. Agricultural conditions continued to deteriorate in the Caribbean. Tropical Storm Ophelia caused an estimated $250 million in damage to agriculture in North Carolina, including livestock facilities, hog farms, and dairy farms. Several facilities lost power, resulting in heat-related poultry deaths.
Notable Weather
There were 301 reports of severe weather across the Southeast in September, which is well-above the median frequency of 99 (304 percent of normal). There was just one confirmed tornado, which is below the median frequency of 15 (7 percent of normal). A brief EF-0 was caught on video in Perquimans County in northeast North Carolina in association with Tropical Storm Ophelia on the 22nd of the month. No damage was reported. This marks only the fifth September on record (since 1950) and first since 2009 with just one confirmed tornado in the region. There were 255 wind reports in September, which is well-above the median frequency of 76 (336 percent of normal). There were also 43 hail reports, which is more than five times the median frequency of 8 (538 percent of normal). Most of the severe weather reports occurred on the 7th and 8th of the month as an upper-level low and frontal boundary pushed through the region. Richmond, VA recorded a wind gust of 60 mph (26.8 m/s) on the 7th, while Raleigh-Durham, NC recorded a gust of 76 mph (34 m/s) on the 8th. The largest hailstones were golf ball-sized (1.75 inches or 4.4 cm) in Spartanburg County, SC, Twiggs County, GA and Wilkes County, GA on the 7th, and in Cobb County, GA on the 12th. A slow-moving thunderstorm produced heavy rain and significant flash flooding in downtown Atlanta, GA on the 14th of the month. Several buildings were flooded, tourist attractions were evacuated, and vehicles were submerged or washed away as more than 3 feet (0.9 m) of water inundated streets and parking lots. There were four rip current fatalities in the region in September (three in Puerto Rico and one in Florida). There was one lightning fatality in Florida on the 26th. On the 9th of the month, lightning struck and damaged the video board at Carter Finley Stadium in Raleigh, NC during a weather delay of the football game between the University of Notre Dame and North Carolina State University. No injuries were reported. A migrant farmworker died of apparent heat-related cardiac arrest in Nash County, NC on the 5th of the month.
2023 Atlantic Hurricane Season
The Atlantic basin saw seven named storms in September, three of which affected the Southeast region. The circulation associated with Hurricane Lee brought high surf with waves up to 15 feet (4.6 m) and dangerous rip currents to Puerto Rico and the U.S. Virgin Islands on the 11th and 12th of the month. On the morning of the 23rd, Tropical Storm Ophelia made landfall in Emerald Isle, NC with winds of 70 mph (31.3 m/s). It gradually weakened as it tracked inland along the I-95 corridor through eastern North Carolina, becoming a tropical depression after crossing into Virginia later that evening. Wind gusts of 30 to 50 mph (13.4 to 22.4 m/s) were reported across central and eastern portions of North Carolina and Virginia. A few gusts exceeded 70 mph (31.3 m/s) near Wilmington, NC and along the Outer Banks, where storm surge ranged from 2 to 4 feet (0.6 to 1.2 m). Five people were rescued from a boat anchored in Lookout Bight as it was battered by rough surf and high winds. Water levels rose over 3 feet (0.9 m) across parts of the James River, with moderate to major tidal flooding observed in Jamestown and the city of Hopewell in eastern Virginia. Storm surge flooding was also observed on the Neuse and Pamlico rivers in eastern North Carolina, which resulted in significant flooding in the towns of New Bern and Washington. Further inland, flash flooding from heavy rainfall was observed in Greenville, NC and Richmond, VA, resulting in several road closures. Tens of thousands of power outages were reported across North Carolina and Virginia. At the end of the month, the circulation associated with Tropical Storm Philippe brought high surf and dangerous rip currents to Puerto Rico and the U.S. Virgin Islands.
For more information, please visit the Southeast Regional Climate Center Home Page.
High Plains (Information provided by the High Plains Regional Climate Center)
The region grappled with warmer temperatures and spotty precipitation this month, less than ideal conditions for agricultural producers. These conditions delayed harvesting in the region, while others are planting winter wheat on dry soils. After another disappointing winter wheat crop this year, producers yet again started on the wrong foot. With very dry soil conditions, planting has been difficult. Farmers are planting deeper or planting at normal depth with hopes of precipitation. Soybean and corn harvests have begun for many, with initial reports indicating a mixed bag of yields. Irrigated crops have reported slightly below-normal yields, while dryland yields varied widely in Kansas and Nebraska. The timing of planting this year also played a critical role in dryland corn yields, with much higher yields reported for those planted early.
Temperature
Well-above-normal temperatures continued this month, with many locations in or just outside of their top 10 warmest September. Much of the region experienced 2 to 4 degrees F (1.1 to 2.2 degrees C) above normal and very few locations reported below-normal temperatures. Led by a scorching end to the month, numerous places ranked in the top 10 warmest category. The Dakotas were among the warmest, with Fargo, North Dakota observing their warmest month on record. The average temperature was 67 degrees F (19.4 degrees C), crushing the previous record of 65.6 degrees F (18.7 degrees C) set in 2015. Nearby Grand Forks, North Dakota as well as Sioux Falls, South Dakota ranked second, narrowly missing their respective records. Further ‘driving home the message’, every state in the region had locations reporting in the top 10 warmest temperatures during this month.
Precipitation
Precipitation was spotty this month, with a sharp divide in distribution in some states. Southwestern Kansas greatly benefited from the moisture, while north of I-70 in northwestern Kansas received next to nothing. Wyoming continued to be wet, with some places up to 300 percent above their normal precipitation. After a stretch of wet conditions starting in April, northwestern Kansas had the faucet turned off. Goodland only had trace amount of precipitation, establishing their driest month on record. Nearby Colby only received 0.03 inches (0.76 mm) this month to rank 2nd driest, while just a mere 60 miles to the north and south both received well over 3 inches (7.62 cm) of precipitation. Parts of Wyoming continue to experience extreme wetness, with several locations on pace for their wettest year on record. In the western part of the state, Afton and Pinedale recorded their wettest January through September. In the central and eastern parts of the state, Shoshoni and Story also rank first respectively. Several other cities such as Casper, Cheyenne, and Rawlins are also in the top 10. Severe weather remained active this month, particularly in southwestern Nebraska. On the 21st, an 81 mph (130 km/h) gust occurred near McCook, and a 4-inch (10.16 cm) hailstone fell near Lexington. Hail continued to be an issue in eastern Wyoming yet again, meanwhile, Colorado had no reports of severe weather according to the Storm Prediction Center.
Drought
Drought conditions both improved and degraded across the region, with large changes in the eastern parts of Kansas and Nebraska. Overall, abnormally dry to exceptional drought (D0-D4) was reduced by nearly 1 percent in the High Plains. After slow improvements in central Nebraska, D4 was rapidly expanded once again. Nearly 5 percent of the state is now under D4, and it includes the highest corn-producing county in the state. Conditions did finally improve in the central and western North Dakota, after above-normal precipitation. Elsewhere in the region, both localized improvements and degradations were observed.
For more information, please visit the High Plains Regional Climate Center Home Page.
South (Information provided by the Southern Regional Climate Center)
Hot and dry conditions continue to affect the Southern Region, negatively impacting crops/livestock, infrastructure, transportation, and water resources.
Temperature
Above normal temperatures were prevalent across much of the Southern region, except for Tennessee and isolated portions of eastern Arkansas and northeastern Mississippi where temperatures were typically within 1 degree F of normal for September. Statewide averages for all states were above normal, with Texas experiencing its warmest September on record (1st warmest out of 129 years) with a monthly mean temperature of 81.8 F, 5.5 F above normal, the Southern Region as a whole (6th warmest), Louisiana (9th warmest), Oklahoma (14th warmest), Mississippi (22nd warmest), Arkansas (37th warmest), and Tennessee (49th warmest). The warmest temperature observed in the region was 115 F at Rio Grande Village, Texas on September 6th. The coldest temperature observed was at Mt. Leconte, Tennessee on September 9th. The coldest lowland temperature recorded in the Region was 59 F at Cherokee, Tennessee. Seven long-term stations set records for highest maximum temperatures for September, all in Texas. No long-term stations set records for lowest minimum temperatures for September.
Precipitation
Precipitation was below normal for most of the Southern Region during September except for central Texas, portions of the Texas and Oklahoma Panhandles, and isolated areas of eastern Texas, Oklahoma, and western Arkansas. State totals were below average for all six states in the Southern region, Mississippi (14th driest), Tennessee (13th), the Southern Region as a whole (29th), Texas (39th), Louisiana (41st), Arkansas (43rd), and Oklahoma (54th). Two stations exceeded eleven inches of precipitation for the month of August, both in Texas and both CoCoRaHS stations: near Nassau Bay (12.95 inches) and near League City (11.38 inches). One station had a single-day accumulation exceeding six inches, near Nassau Bay, Texas (6.09 inches, 9/16). No long-term stations in the Southern Region set single-day accumulation records for August. Seven stations, all in Texas, had no measurable precipitation during the month of September.
Drought/Flooding
During September, degradation of drought conditions were common in the eastern portion of the Southern Region, particularly Mississippi where the central part of the state saw three classes of degradation from August 29th to September 26th. Southern Oklahoma and northern Texas also experienced degradation of drought conditions. Texas experienced some improvement in isolated areas that received much needed rain during September. The total area experiencing Extreme or Exceptional Drought, according to the US Drought Monitor, increased from 28 percent to 32 percent during September, with much of this expansion occurring in Mississippi. As of September 26th, at least 65 percent of the Southern Region was in some category of drought. The hot and dry conditions have particularly impacted the cotton crops in Oklahoma and Texas, with both states only reporting nine and eleven percent of cotton crops being rated as Good to Excellent by the USDA as of October 1st as harvest progresses across the Region. Dry and hot conditions have led to burn bans, water restrictions, and low streamflow in many areas affected by drought. Low flows on the Mississippi River have begun to snarl barge traffic and have contributed to saltwater intrusion creeping up the Mississippi towards New Orleans, Louisiana. Rangeland and pasture conditions in the western portions of the region continue to suffer, and there are increasing reports of ranchers reducing the size of their herds due to feed and water limitations.
Notable Weather
September saw continued record-breaking heat across Texas, which experienced its warmest September on record and had 14 stations that experienced at least three weeks of 100 F or higher maximum temperatures during September. In drought-affected areas of the region, dry and hot conditions throughout the summer have led to damages to water infrastructure and building foundations due to shrinking of soils. A major hailstorm ravaged the northern Austin area on the night of September 24, producing hail up to 4 inches in diameter. The waiting list for vehicle rentals in the wake of the storm was thousands long. Overall, there were 121 hail reports in the Southern Region during September, including another 4 inch hail producer near Raiford, Oklahoma on September 23rd. There were 293 severe wind reports in the Region with the fastest recorded being 90 mph near McAdoo, Texas on September 16th. There was one tornado in the Southern Region during September, an unrated tornado east of La Villa, Texas on September 15th that did no discernable damage.
For more information, please visit the Southern Regional Climate Center Home Page.
West (Information provided by the Western Region Climate Center)
This September warm records were broken in Arizona and New Mexico and nearly broken in Montana. Meanwhile, portions of California, Nevada, and Utah experienced average to below average temperatures. The Pacific Northwest was categorized by average temperatures and average precipitation for the month. Montana, Nevada, and Northern California saw above average precipitation totals, while the remainder of California experienced normal to near record dryness. Most of the western United States, however, received average precipitation totals for the month.
Temperature
Temperatures were 4-6 degrees Fahrenheit warmer across Arizona and New Mexico and a few locations set new records for the warmest September. Some notable locations with records set in New Mexico were Carlsbad (5.1 degrees Fahrenheit above average), Deming (4.6 degrees above average), Las Cruces (3.9 degrees Fahrenheit above average), and Roswell with a new record set at 79.9 degrees Fahrenheit, 5.5 degrees above average. In Arizona, Tucson set its second warmest September at 85.7 degrees Fahrenheit, 2.9 degrees above average. Eastern Montana also experienced warmer conditions with temperatures 3-6 degrees Fahrenheit above normal. Some notable locations in Montana were Powderville (5.1 degrees Fahrenheit above average), Circle (4.7 degrees Fahrenheit above average), and Glasgow (3.8 degrees Fahrenheit above average). On the other hand, near record cold average temperatures 2-4 degrees Fahrenheit below average for September were reached in central California with Sonora (3.3 degrees Fahrenheit below average), Fremont (2.9 degrees Fahrenheit below average), and Napa (2.3 degrees Fahrenheit below average).
Precipitation
September was highlighted by higher-than-average precipitation totals for Montana, Nevada, and Northern California. Townsend, MT recorded its wettest September at 2.63 inches, which is 77% above average. Winnemucca, NV experienced its second wettest September with rain totaling 1.62 inches above average. Some other notable locations were Redding, CA (1.01 inches above normal) and Stanford, MT (1.82 inches above normal). On the other side of the spectrum, Southern California received normal to record dryness with many areas receiving 0 inches for the entire month. Notable record-breaking areas in California include Campo (0.4 inches below normal), Fresno (0.05 inches below average), Bakersfield (0.05 inches below average), and Lancaster (0.12 inches below average). The Pacific Northwest, Arizona, New Mexico, and Utah recorded average precipitation totals for the month of September.
Drought
According to the U.S. Drought Monitor at the end of September, drought increased from 31 precent of the West in August to 44 percent. Drought conditions worsened for Arizona and New Mexico with Arizona ranging from abnormally dry to extreme drought and New Mexico from moderate to exceptional drought. Oregon, Washington, and northern Montana continue to experience drought conditions with the average for those states at severe level and some areas are in extreme drought. Nevada and California continue to stay drought free, especially after receiving rain from Hurricane Hilary remnants last month.
Alaska Summary
Temperatures were average across most of Alaska this month with the only anomalous areas being Northern Alaska along the coast of the Beaufort Sea. Barrow recorded temperatures 3.4 degrees Fahrenheit above average at 33.7 degrees and Prudhoe Bay had temperatures 2.6 degrees Fahrenheit above average. Precipitation was above average for Alaska’s Panhandle with Port Alexander receiving an extra 24.86 inches, over double the average. They recorded 50.58 inches for the month of September, recording 11.24 inches in one day, which is the 7th largest total daily rainfall in that area’s history. Sitka received 7.1 inches above average, and Juneau got 4.49 inches above average. Kotzebue at the border between the Far North and Southwest Alaska also recorded near record rainfall at 1.77 inches above average. The only area with below average precipitation totals was Tanana in Alaska’s Interior which recorded 1.52 inches below average.
Hawaii Summary
Most of Hawaii recorded average temperatures and precipitation for the month of September, except for Hana on Maui and Honolulu on O’ahu. Hana recorded its driest September ever (4.36 inches below average) receiving 1.83 inches of rain, only 30 percent of the average monthly total. Honolulu received 0.1 inches of rain for the entire month, 0.78 inches below average, and only 11 percent of the average monthly precipitation for September. The dryness has not aided Hawaii’s drought conditions with the total increasing to 82 percent of the state under some category of drought. The Big Island ranges from areas of abnormally dry to severe drought with most of the island under moderate drought conditions. The entire west coast of Maui continues to be under severe drought conditions with most of the neighboring islands, Lanai and Moloka’i, also being under moderate to severe drought. O’ahu and Kauai mostly remain in the abnormally dry to moderate drought range at the end of September.
Notable Weather
Unprecedented rainfall leaves thousands stranded at Burning Man: A few months’ worth of rain falls in one day, leaving thousands of people stranded at Burning Man in Nevada’s Black Rock Desert. The half an inch of rain turned the playa into a mud field, which left vehicle transportation out of the desert impossible. Thousands had to shelter in place for a few days until conditions improved, leading to a mass exodus where people spent up to half a day stuck in traffic to get out of the Black Rock Desert.
For more information, please go to the Western Regional Climate Center Home Page.