National Overview

August Highlights


August Temperature

The contiguous U.S. average temperature during August was 74.4°F, 2.3°F above average, ranking ninth warmest in the 129-year record.
Generally, temperatures were above average across much of the contiguous U.S., with below-normal temperatures in parts of the Great Lakes, Ohio River Valley, Northeast and southern California.
For the month of August, Louisiana, Mississippi and Florida ranked warmest on record for August while Texas ranked second warmest on record. An additional seven states ranked among their top-10 warmest August on record.
The contiguous U.S. average maximum (daytime) temperature during August was 86.9°F, 1.8°F above the 20th century average, ranking 19th warmest August for daytime temperatures in the historical record. Maximum temperatures were above average from the Southwest to the Southeast and in parts of the Northwest, central Plains, Upper Midwest and Mid-Atlantic. Temperatures were below average across much of the Great Lakes and Northeast and in parts of the Great Basin and northern portions of the Rockies and Plains. Louisiana and Florida ranked warmest on record, while Texas had its second warmest August for daytime temperatures. Two additional states ranked among their top-10 warmest August for daytime temperatures.
The contiguous U.S. average minimum (nighttime) temperature during August was 61.8°F, 2.7°F above the 20th century average, ranking 5th warmest August for overnight temperatures on record. Minimum temperatures were above average across much of the contiguous U.S. while near- or below-normal temperatures were observed in parts of the Southwest, central Plains, Great Lakes, Northeast and Southeast. Louisiana and Florida ranked warmest on record for August while New Mexico, Texas and Mississippi each ranked second warmest August on record. An additional seven states experienced a top-10 warmest August for nighttime temperatures.
The Alaska statewide August temperature was 53.3°F, 3.8°F above the long-term average. This ranked 3rd warmest in the 99-year period of record for the state. Temperatures were above average across most of the state with record-warm temperatures observed in parts of the Southeast Interior of the state.
Based on NOAA's Residential Energy Demand Temperature Index (REDTI), the contiguous U.S. temperature-related energy demand during August was 186 percent of average and the 12th-highest value in the 129-year period of record.
August Precipitation

The August precipitation total for the contiguous U.S. was 2.74 inches, 0.12 inch above average, ranking in the middle third of the 129-year record.
Precipitation was below average from southern Arizona to Florida and in parts of the Northwest, western Great Lakes, central Plains and Mid-Atlantic. Precipitation was above average across much of the West, eastern Great Lakes and Northeast, and in parts of the northern Plains, Ohio Valley and Southeast.
California and Nevada each had their second-wettest August on record, while eight additional states had their top-10 wettest August on record. Conversely, Louisiana ranked driest on record for the month with two additional states ranking among their top-10 driest August on record.
Across the state of Alaska, the average monthly precipitation was 4.89 inches, ranking in the wettest third of the historical record. Conditions were wetter than average across parts of the Interior, Southwest and south-central Alaska during this August. Much of the North Slope, West Coast, Southeast and Panhandle were near normal, while below-normal precipitation was observed in parts of the Aleutians during the month.
According to the August 29 U.S. Drought Monitor, about 34.3% of the contiguous U.S. was in drought, up about 6.2% from the beginning of August. Drought conditions expanded or intensified along the Northern Tier, Upper Midwest, Southwest, southern Plains, Mid-Atlantic, Southeast and Hawaii this month. Drought contracted or was reduced in intensity across portions of the central Plains, Great Lakes, Ohio Valley, Northeast, Alaska and Puerto Rico.
Billion-Dollar Weather and Climate Disasters
Eight new billion-dollar weather and climate disasters were confirmed this month including: Hurricane Idalia, the Hawaii Firestorm, the mid-July Northeast flooding and North Central Severe Weather, the Minnesota Hail Storms on August 11 and several other severe storm events that occurred in July.
There have been 23 confirmed weather and climate disaster events this year, each with losses exceeding $1 billion. These disasters consisted of 18 severe storm events, two flooding events, one tropical cyclone, one winter storm and one wildfire event. For this year-to-date period, the first eight months of 2023 rank highest for disaster count, ahead of 2020 with 16 disasters. The total cost of these events exceeds $57.6 billion, and they have resulted in 253 direct and indirect fatalities. This year had the largest number of billion-dollar disasters during a calendar year since records began in 1980.
Since these billion-dollar disaster records began in 1980, the U.S. has sustained 371 separate weather and climate disasters where overall damages/costs reached or exceeded $1 billion (based on the CPI adjustment to 2023) per event. The total cost of these 371 events exceeds $2.615 trillion.
Other Notable Events
A series of heat waves brought record-breaking temperatures to portions of the U.S. during August:
- August was the warmest month on record for Louisiana and Florida by nearly 1.5°F, while Mississippi was record warmest by nearly 0.5°F.
- A total of 301 counties each had their warmest August on record while an additional 441 counties ranked in the top-10 warmest for the month. There are 3,143 counties in the U.S.
- On August 24, temperatures in Chicago soared to 100°F—the first 100°F temperature since July 6, 2012—with a 120°F heat index, the highest ever recorded at Chicago’s official climate observation site.
- Phoenix, Arizona had their all-time warmest summer on record this year, with an average summer temperature of 97.0°F—breaking the previous record of 96.7°F set in 2020.
- San Juan, Puerto Rico had its hottest August on record, breaking the previous record from 1980.
Several notable tropical cyclones impacted portions of the U.S. in August:
- On August 8, winds from Hurricane Dora exacerbated a wildfire on the island of Maui, Hawaii, making it the deadliest wildfire in the U.S. in over a century.
- On August 18, the first-ever tropical storm watch was issued for southern California as remnants of Hurricane Hilary brought record-breaking rainfall and flooding to parts of the Southwest.
- On August 22, Tropical Storm Harold brought strong winds and heavy rains to parts of the southern Plains.
- On August 30, Hurricane Idalia made landfall in the Big Bend region of Florida as a Category 3 hurricane. This is the strongest hurricane to hit the region in more than 125 years.
Summer Highlights

June-August Temperature

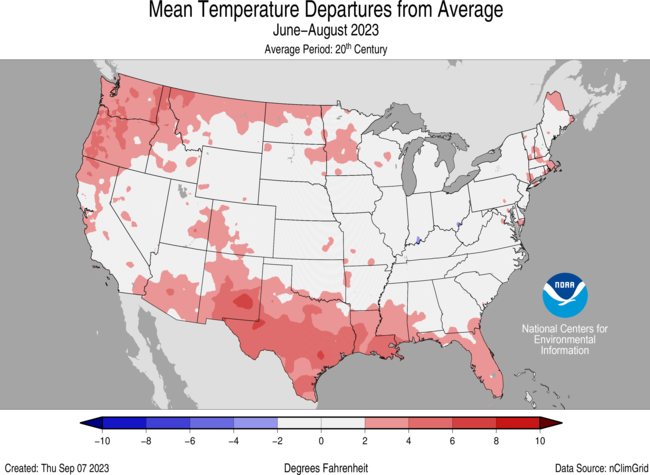
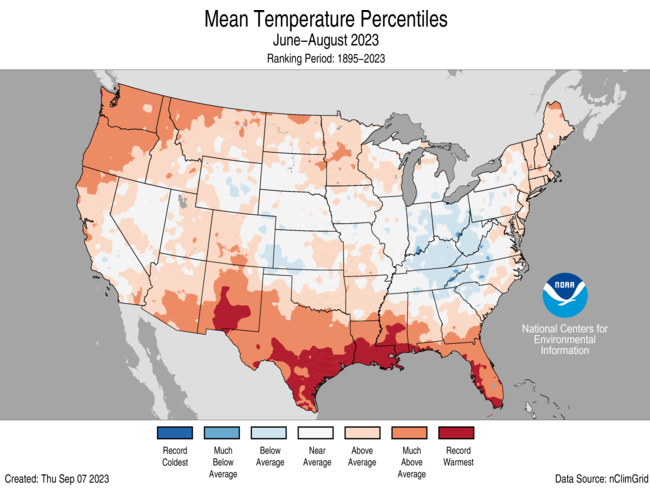
The meteorological summer (June-August) average temperature for the contiguous U.S. was 73.0°F, 1.6°F above average, ranking 15th warmest on record.
Temperatures were above average across much of the West and in parts of the Upper Midwest, Southern Plains, Northeast and along the Gulf of Mexico and East Coast. Temperatures were below average in parts of the west-central Plains, Ohio Valley and Southeast.
Louisiana ranked warmest on record, while Texas and Florida each ranked second warmest for this summer season. Four additional states ranked among their top-10 warmest on record for this period.
The contiguous U.S. average maximum (daytime) temperature during June-August was 85.7°F, 1.3°F above the 20th century average, ranking in the warmest third of the historical record. Daytime temperatures were above average across much of the southern U.S. and eastern Plains, and from the Northwest to the Great Lakes and in small pockets across the Mid-Atlantic. Near- to below-average temperatures were observed across much of the Great Basin, Ohio and Tennessee valleys and Northeast, and in parts of the northern Rockies, western Plains and Southeast. Louisiana ranked warmest on record while Texas ranked second warmest, with four additional states experiencing a top-10 warmest June-August for daytime temperatures.
The contiguous U.S. average minimum (nighttime) temperature during this three-month period was 60.3°F, 1.9°F above the 20th century average, ranking 10th warmest in the historical record. Above-average nighttime temperatures were observed across much of the U.S., while near- to below-normal temperatures were observed in much of the Ohio Valley and in parts of the Southwest, central Plains, Upper Midwest and Southeast. Louisiana, Florida and Maine ranked second warmest on record, while Texas, Vermont and New Hampshire ranked third warmest on record for nighttime temperatures. Eight additional states ranked among their top-10 warmest June-August during this summer season.
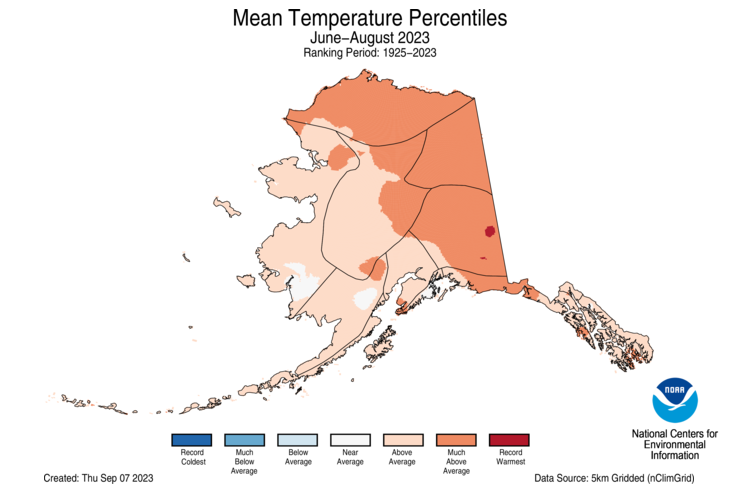
The Alaska summer temperature was 53.1°F, 2.6°F above the long-term average, ranking eighth warmest on record for the state. Temperatures were above average across most of the state of Alaska while some parts of the Southwest saw near-average summer temperatures.
Based on REDTI, the contiguous U.S. temperature-related energy demand during June-August was 184 percent of average and was the 12th-highest value on record.
June-August Precipitation

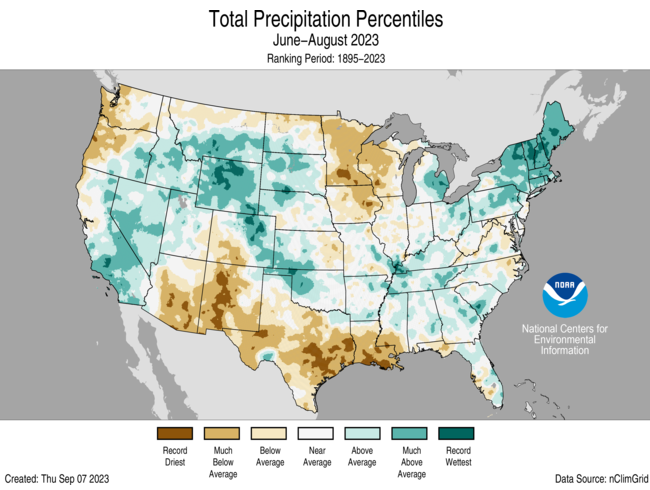
The contiguous U.S. summer precipitation total was 8.35 inches, 0.03 inch above average, ranking in the middle third of the June-August record.
Precipitation was above average across much of California, the interior West and Northeast, and in parts of the central to northern Plains, Ohio Valley and Southeast. Wyoming, Vermont and New Hampshire each ranked wettest on record, while five additional states ranked among their top-10 wettest during the June–August period.
Summer precipitation was below average in parts of the Northwest, Southwest, southern Plains, Upper Midwest, Mid-Atlantic and Southeast. New Mexico and Louisiana each ranked third driest with four additional states ranking among their top-10 driest summer season on record.
For summer season precipitation, Alaska ranked in the wettest third of the record with wetter-than-average conditions observed across most of the state. Near-normal precipitation was observed in parts of the Southeast and Aleutians this season. Below-normal precipitation occurred in parts of the Southeast Interior and Alaska Panhandle during this period.
Extremes
The U.S. Climate Extremes Index (USCEI) for the summer period was 11 percent above average, ranking in the upper third of the 114-year period of record. Extremes in warm maximum temperatures, warm minimum temperatures and days with precipitation were the major contributors to this elevated CEI value. The USCEI is an index that tracks extremes (occurring in the upper or lower 10 percent of the record) in temperature, precipitation and drought across the contiguous United States.
On the regional scale, the Northeast, Southeast, Northwest and Southwest ranked above average while the South ranked much-above average for this June-August period. Each of these regions experienced elevated extremes in warm minimum temperatures while the Northwest, Southwest, South and Southeast experienced elevated extremes in warm maximum temperatures. In addition, the Northeast saw extremes in days with precipitation and wet PDSI, while the Southeast had elevated 1-day precipitation extremes and the Northwest and Southwest experienced elevated extremes in days with precipitation. Conversely, the Ohio Valley and Upper Midwest were 78 percent and 68 percent below average, each ranking as their sixth lowest summer period on record, respectively.
Year-to-Date Highlights

January-August Temperature

For the January-August period, the average contiguous U.S. temperature was 55.6°F, 1.8°F above average, ranking 13th warmest on record for this period.
Temperatures were above average from the southern Plains to the East Coast and along parts of the Northern Tier, with near- to below-average temperatures from the northern Plains to the West Coast.
Louisiana, Mississippi and Florida ranked warmest on record while Massachusetts, Delaware, Maryland, Alabama and Georgia each ranked second warmest for the January–August period. An additional 20 states had a top-10 warmest year-to-date period. No state experienced a top-10 coldest event for this eight-month period.
The contiguous U.S. average maximum (daytime) temperature during January-August was 67.5°F, 1.6°F above the 20th century average, ranking 16th warmest in the historical record. Above-average temperatures were observed across much of the eastern contiguous U.S. and in parts of the Northwest. Near- to below-average temperatures were observed from the northern Plains to the West Coast. Louisiana, Mississippi and Florida ranked warmest on record for daytime temperatures during January-August period, while 17 additional states ranked among their top-10 warmest for daytime temperatures during this period. No state experienced a top-10 coldest August on record for this eight-month period.
The contiguous U.S. average minimum (nighttime) temperature during this eight-month period was 43.7°F, 2.0°F above the 20th century average, ranking 9th warmest in the historical record. Above-average nighttime temperatures were observed across much of the contiguous U.S. Louisiana, Mississippi and Florida each ranked warmest on record, while Maine, New Hampshire, Massachusetts, Connecticut, Rhode Island and Alabama each ranked second warmest on record for nighttime temperatures. 15 additional states experienced a top-10 warmest event for nighttime temperatures during the January-August period. Near- to below-average nighttime temperatures were observed across parts of the Plains, Rockies and Southwest.
The Alaska January-August temperature was 30.8°F, 2.0°F above the long-term average, ranking in the warmest third of the historical record for the state. Much of the state was above normal for the eight-month period while temperatures were near average across much of the Interior and West Coast.
Based on REDTI, the contiguous U.S. temperature-related energy demand during January-August was 38 percent of average and was the ninth-lowest value on record.
January-August Precipitation

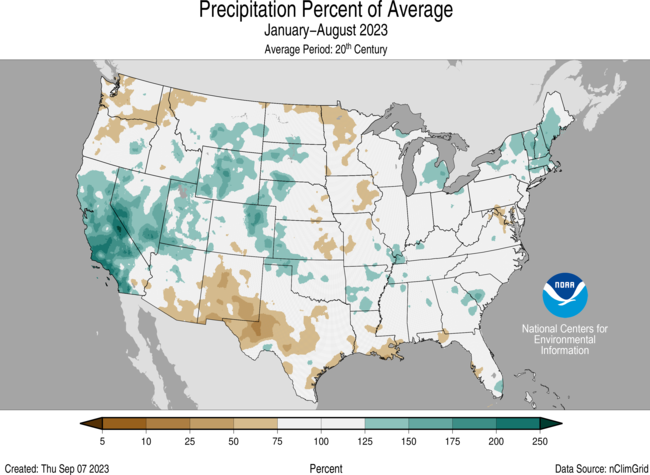
The January-August precipitation total for the contiguous U.S. was 21.19 inches, 0.48 inch above average, ranking in the middle third of the 129-year record.
Precipitation was near to above average from California to the western Great Plains, in the Northeast and in parts of the southern Mississippi Valley, northern Great Lakes and Southeast. New Hampshire had its third wettest year-to-date period on record while seven additional states ranked among their top-10 wettest for this period.
Conversely, precipitation was below average across parts of the Northwest, Southwest, eastern Plains, upper and central Mississippi Valley, Mid-Atlantic and along parts of the Gulf during the January–August period. Maryland ranked ninth driest on record for this eight-month period.
The January-August precipitation ranked 15th wettest in the 99-year record for Alaska, with above-average precipitation observed across much of the state. Near- to below-normal precipitation was observed in parts of Southeast Interior, Panhandle and Aleutians during this period.
Extremes
The U.S. Climate Extremes Index (USCEI) for the year-to-date period was 29 percent above average, ranking in the upper third of the 114-year period of record. Extremes in warm maximum temperatures and warm minimum temperatures were the major contributors to this elevated CEI value. The USCEI is an index that tracks extremes (occurring in the upper or lower 10 percent of the record) in temperature, precipitation and drought across the contiguous United States.
On the regional scale, the Ohio Valley ranked above average while the Northeast, Southeast and South ranked much-above average for this year-to-date period. Each of these regions experienced elevated extremes in warm maximum temperatures and warm minimum temperatures. The South also experienced dry PDSI values while the Southeast experienced elevated extremes in days with precipitation and the Northeast experienced elevated extremes in 1-day precipitation and days with precipitation.
Monthly Outlook
According to the August 31 One-Month Outlook from the Climate Prediction Center, much of the contiguous U.S. and parts of northern, eastern and southern Alaska favor above-normal monthly average temperatures in September, with the greatest odds in the southern Plains. The best chances for below-normal temperatures are forecast for parts of western Alaska. Portions of the Northwest, Southwest and much of Alaska are favored to see above-normal monthly total precipitation while below-normal precipitation is most likely to occur from south-central U.S. to the Great Lakes, as well as parts of the Alaska Panhandle. Drought improvement or removal is forecast in parts of the western Southwest, Southeast and Puerto Rico, while persistence is more likely across the Northern Tier and from the eastern Southwest to the Lower Mississippi Valley, and in parts of the central and northern Plains, Northeast, Mid-Atlantic and Hawaii. Drought development is likely across much of the central U.S. in parts of the Lower Mississippi Valley.
According to the One-Month Outlook issued on September 1 from the National Interagency Fire Center, Hawaii and northern portions of the West Coast as well as the Upper Midwest, southern Plains, Lower Mississippi Valley and Mid-Atlantic have above-normal significant wildland fire potential during September, while parts of southern California are expected to have below-normal potential for the month.
Regional Highlights
These regional summaries were provided by the six Regional Climate Centers and reflect conditions in their respective regions. These six regions differ spatially from the nine climatic regions of the National Centers for Environmental Information.
Northeast (Information provided by the Northeast Regional Climate Center)
Much of the Northeast experienced a cool, soggy August, which also featured a notable amount of severe weather.
Temperature
The Northeast’s average temperature for August was 67.7 degrees F, 1.0 degree F cooler than normal. For the 12 Northeast states, average temperatures for August ranged from 1.4 degrees F below normal in Maine and New York to 0.5 above normal in Maryland, with 10 states being cooler than normal. The region’s summer average temperature was 67.8 degrees F, 0.3 degrees F cooler than normal. State average temperatures for summer ranged from 1.3 degrees F below normal in West Virginia to 0.5 degrees F above normal in Maine and Vermont, with seven states being cooler than normal. Summer 2023 ranked as the 20th warmest summer since records began in 1895 for Maine and Massachusetts.
Precipitation
The Northeast had its 12th wettest August on record, picking up 5.25 inches of precipitation, 130 percent of normal. State precipitation totals for August ranged from 56 percent of normal in Delaware to 171 percent of normal in Maine, with nine of the 12 states being wetter than normal. This August was among the 20 wettest Augusts for four states: Maine, fourth wettest; New York, eighth wettest; Vermont, ninth wettest; and New Hampshire, 11th warmest. The Northeast had its third wettest summer since recordkeeping began with 16.26 inches of precipitation, 127 percent of normal. Nine of the 12 states were wetter than normal, with precipitation ranging from 89 percent of normal in Maryland to 160 percent of normal in New Hampshire. Summer 2023 was record wet in New Hampshire and Vermont and among the 20 wettest on record for six other states: Maine and Massachusetts, second wettest; New York, fourth wettest; Connecticut, ninth wettest; Rhode Island, 10th wettest; and Pennsylvania, 13th wettest. Albany, New York, had its wettest summer since records began in 1874 with 18.89 inches of precipitation, beating the old record for 18.51 from 2009.
Drought
The U.S. Drought Monitor from August 1 showed 1 percent of the Northeast in severe drought, 3 percent in moderate drought, and 11 percent as abnormally dry. Sufficient precipitation fell to allow drought and abnormal dryness to contract in multiple areas, particularly New York and the northern half of Pennsylvania. Also, severe drought eased in central Maryland. However, drier conditions prevailed in several areas, especially eastern West Virginia where moderate drought was introduced and abnormal dryness expanded. The U.S. Drought Monitor from August 29 showed 2 percent of the Northeast in moderate drought and 9 percent as abnormally dry. A few locations such as central Maryland, south-central Pennsylvania, central/coastal New Jersey, and eastern West Virginia experienced much below normal streamflow and/or groundwater levels at times during August. USGS 7-day average streamflow was much below normal or lower for areas such as central Maryland, south-central Pennsylvania, eastern West Virginia, and southern New Jersey. Groundwater levels reached record low levels at times during August in some of these same areas. In late August, at least 17 public water suppliers in Pennsylvania, most in the southeastern part of the state, were requesting that customers voluntarily conserve water. In late August, daily drought monitoring resumed along the Potomac River, which supplies portions of the Mid-Atlantic including much of the Washington, D.C., metro area with water.
Notable Weather
Several notable examples of severe storms and flash flooding that affected the Northeast during August follow:
- August 7 to 8: A widespread severe weather event unfolded across the region, with 14 tornadoes – six in New York (including one that traveled into New York from Pennsylvania), five in Pennsylvania, two in Massachusetts, and one each in New Jersey and West Virginia. All tornadoes were rated EF-0 or EF-1 except one. An EF-3 caused significant damage to buildings, trees, and a ski resort along a 16-mile path in Lewis County, New York, the county’s strongest tornado since records began in 1950. There were also at least 15 distinct areas of notable straight-line wind damage, with winds of up to 110 mph. Storm reports for the tornadoes and straight-line winds noted snapped and uprooted trees that blocked roads and damaged homes, removal of shingles and broken windows, destroyed outbuildings, flattened corn fields, and power outages. Softball-sized (4 in.) hail was reported in Washington County, Maryland, while Preston County, West Virginia, saw tennis ball-sized (2.5 in.) hail, each county’s largest hailstone on record (since 1950. Additionally, some storms produced extreme rainfall. For instance, over 3.50 inches of rain in an hour led to significant flash flooding in Dorchester County, Maryland, where a rare Flash Flood Emergency, signifying a dangerous, life-threatening situation, was issued by the National Weather Service. Numerous roads were closed, with waist-deep water in some areas and multiple water rescues. Similarly, as much as 7 inches of rain in Onondaga County, New York, flooded buildings, shut down sections of major roads, led to water rescues, and caused part of a mall roof to collapse.
- August 12 to 13: Another widespread severe weather event took place in the Northeast, with seven weak (EF-0 or EF-1) tornadoes - five in Pennsylvania and one each in New York and Connecticut. Straight-line winds of up to 90 mph were also noted in a handful of locations. The storms downed hundreds of trees and damaged roofs and outbuildings. Baseball-sized (3 in.) hail fell in Washington County, Pennsylvania, while lime-sized hail was reported in Piscataquis County, Maine, qualifying as each county’s largest hailstone since records began in 1950.
- August 18: Southern New England was the focal point for severe weather. There were five tornadoes – three in Massachusetts and one each in Rhode Island and Connecticut. The strongest one was an EF-3, making it Rhode Island’s strongest tornado since at least 1986. The tornadoes snapped or uprooted hundreds of trees, a few of which fell on homes rendering them uninhabitable.
- August 28: As much as 5 inches of rain fell on already saturated ground in parts of western and central West Virginia, leading to significant flash flooding. A rare Flash Flood Emergency was issued for part of Kanawha County, where a report from Winifrede indicated 4.32 inches of rain in two-and-a-half hours, exceeding the threshold for a 500-year storm event. Creeks overflowed their banks and inundated roads, bridges, and buildings, with a preliminary report indicating at least 60 homes were swept away. The floodwaters stranded drivers and residents, resulting in more than 20 water rescues. Mudslides blocked roads, including a portion of the West Virginia Turnpike. The flooding caused several schools to be closed.
During August, there were 30 confirmed tornadoes in the Northeast, seven times the region’s August average of four tornadoes (based on 1998-2022 data). Several states also saw more tornadoes than usual this month including Pennsylvania, 12 tornadoes compared to an average of two; New York, seven tornadoes compared to an average of one; Massachusetts, five tornadoes compared to an average of zero; New Jersey, three tornadoes compared to an average of zero; Connecticut, two tornadoes compared to an average of zero. The Northeast’s summer tornado count was 47, more than double its summer average of 21 tornadoes and approaching the annual average of 49 tornadoes (annual data based on 1998-2022). The summer tornado count breaks down as follows: 22 in Pennsylvania, seven each in Massachusetts and New York, five in New Jersey, two in Connecticut, and one each in Delaware, Vermont, New Hampshire, Rhode Island, and West Virginia
For more information, please visit the Northeast Regional Climate Center Home Page.
Midwest Region (Information provided by the Midwest Regional Climate Center)
Temperature
The average August temperature for the Midwest was 71.1 degrees F (21.7 degrees C), which was 0.2 degrees F (0.1 degrees C) above the 1991-2020 normal. Temperatures were generally 1-3 degrees F (0.6-1.7 degrees C) above normal in the west and 1-3 degrees F (0.6-1.7 degrees C) below normal in the east. Preliminary statewide average temperatures ranged from 1.5 degrees F (0.8 degrees C) above normal in Iowa to 1.9 degrees F (1.1 degrees C) below normal in Michigan. Temperatures were rather seasonal, or even mild, for much of the month until an extremely warm and humid air mass settled across the region from August 19 to August 25 (details in the Humid Heat Wave section below). Minneapolis, Minnesota tied for their 10th warmest August in 151 years. Conversely, Russellville in western Kentucky had the 7th coldest August in 94 years. The average summer (June-August) temperature for the Midwest was near normal, with slightly above-normal temperatures in the west and slightly below-normal temperatures in the east.
Precipitation
August precipitation totaled 4.02 inches (102 mm) for the Midwest, which was 0.35 inches (9 mm) above normal, or 109 percent of normal. Precipitation was 25-75 percent of normal in the northwestern portion of the region, with precipitation near or above normal in the southern and eastern portions of the region. Preliminary statewide precipitation totals ranged from 2.55 inches (65 mm) above normal in Missouri to 1.35 inches (34 mm) below normal in Wisconsin. Preliminary rankings indicate Missouri had the 6th wettest August since 1895, and Ohio had the 11th wettest. In southeast Missouri and western Kentucky, multiple rounds of significant heavy rainfall during the first half of August resulted in a wide swath of the region with monthly precipitation totals of 10-18 inches (254-457.2 mm). Marble Hill, Missouri reported 17.19 inches (436.6 mm), which included 3 separate days with precipitation exceeding 4 inches (101.6 mm). Rainfall moved eastward for the latter half of the month, with high precipitation in the Detroit, Michigan and Cleveland, Ohio areas. Cleveland had the 8th wettest August in 152 years, while Detroit had the 9th wettest in 150 years. Conversely, Decorah in northeast Iowa had the 5th driest August in 122 years with just 0.91 inches (23.1 mm) for the month. Summer (June-August) precipitation for the Midwest totaled 10.47 inches (266 mm), which was 1.84 inches (46.7 mm) below normal. Summer precipitation deficits of 4-10 inches (101.6-254 mm) were widespread across the northwest, while precipitation surpluses of 2-8 inches (50.8-203.2 mm) were observed across the south-central and eastern Midwest.
Drought
Throughout August, drought conditions improved in the east, with abnormal dryness and drought significantly reduced or eliminated in Illinois, Indiana, Kentucky, Michigan, and Ohio. Conversely, drought expanded and intensified in the northern and western portions of the region. By month’s end, about 41 percent of the Midwest was in drought, according to the U.S. Drought Monitor (USDM), with the most dire conditions in the Upper Mississippi River Basin. Wisconsin reached a Drought Severity Coverage Index (DSCI) of 248 in late August, which tied for the highest DSCI since those records began in 2000. Drought in the northwest intensified rapidly over the last 12 weeks since the start of summer when the Upper Mississippi River Basin was either abnormally dry or drought-free. By late August, the ongoing summer drought resulted in low flows and navigation restrictions on the Mississippi River, reduced corn and soybean yields, and increased wildfire risk.
Notable Weather
Several notable weather events occurred in the Midwest this month:
- Humid Heat Wave August 19-25: An unusually strong, long-lasting upper atmospheric heat dome trapped a hot and humid air mass across the lower Midwest from August 19-25. Triple-digit heat index values were paired with excessively warm overnight temperatures, prompting the National Weather Service to issue widespread excessive heat warnings across most of the Midwest. Kansas City, Missouri (Downtown Airport) had a record-setting 5 consecutive days (August 19-23) with the heat index at or above 115 degrees F (46.1 degrees C), and they tied the all-time record heat index of 120 degrees F (48.9 degrees C) on August 20. Sioux City, Iowa set a new all-time record on August 21 when the heat index reached 122 degrees F (50 degrees C). Heat Index values in excess of 120 degrees F (48.9 degrees C) were measured as far north as Minneapolis, Minnesota. St. Louis, Missouri had 3 consecutive days (August 23-25) with record-setting warm overnight temperatures, and the area had air temperatures at or above 80 degrees F (26.7 degrees C) for 142 consecutive hours from August 20-26 (4th longest duration going back to 1945). The widespread warmth resulted in school closures, pavement buckling, livestock fatalities, and increased energy demands that resulted in Midwest grid operators seeking usage reductions.
- Severe Weather: The Twin Cities area in Minnesota had its most damaging thunderstorm event of the year on August 11 when a line of storms produced golf-ball to baseball-sized hail across a multi-county region. Extensive damage was reported to vehicles, rooftops, windows, and siding. On August 24-25, damaging thunderstorms and tornadoes moved across southern Michigan and northern Ohio. Heavy rain paired with 70-80 mph (113-129 kph) wind gusts created extremely hazardous driving conditions, downed trees, and knocked out power to over 200,000 customers. Unfortunately, 5 fatalities in Michigan resulted from these storms.
For further details on the weather and climate events in the Midwest, see the weekly and monthly reports at the Midwest Climate Watch page.
Southeast (Information provided by the Southeast Regional Climate Center)
Temperature
Mean temperatures were above average across much of the Southeast region in August. The greatest departures were found across southern portions of Alabama and Georgia, the northern half of Florida, and Puerto Rico and the U.S. Virgin Islands, where temperatures were 2 to 4 degrees F (1.1 to 2.2 degrees C) above average for the month, with some locations running up to 6 degrees F (3.4 degrees C) above average. Most other locations in the region were slightly above average for the month, while portions of central Virginia and North Carolina were slightly below average. For the second straight month, several locations recorded their warmest month on record, including Mobile, AL (1871-2023), Pensacola, FL (1897-2023), Tallahassee, FL (1896-2023), Daytona Beach, FL (1923-2023), Orlando, FL (1892-2023), Tampa, FL (1890-2023), Miami, FL (1895-2023), and Rohlsen Airport on the island of Saint Croix (1951-2023). Fort Myers, FL (1902-2023), Charleston, SC (1938-2023), Brunswick, GA (1948-2023), and San Juan, PR (1898-2023) all recorded their warmest August on record. Several other locations observed or tied their second warmest (i.e., West Palm Beach, FL, Key West, FL, Jacksonville, FL, Gainesville, FL) and third warmest (i.e., Montgomery, AL, Alma, GA, Cyril King Airport on Saint Thomas) August on record. As in July, the heat and humidity were noteworthy in many places. The heat index at Brunswick, GA reached 122 degrees F (50 degrees C) on the 7th of the month, which is the highest value on record (since 1948). The following day, Valdosta, GA recorded a heat index of 120 degrees F (48.9 degrees C), which tied its highest value on record (since 1947). Key West, FL recorded its highest minimum temperature on record of 88 degrees F (31.1 degrees C) on the 9th, breaking the previous record of 87 degrees F (30.6 degrees C) which had been observed numerous times over the past two months. Miami, FL recorded three consecutive days (from the 7th to the 9th) with a heat index of at least 110 degrees F (43.3 degrees C) for the first time on record (since 1948). Miami Executive Airport tied its highest heat index on record (since 1976) of 122 degrees F (50 degrees C) on the 12th of the month, while Raleigh-Durham, NC tied its highest heat index on record (since 1945) of 115 degrees F (46.1 degrees C) on the 15th of the month. On the 24th, San Juan, PR tied its warmest daily mean temperature on record of 89 degrees F (31.7 degrees C). On the 26th, Mobile, AL recorded its warmest daily maximum temperature on record of 106 degrees F (41.1 degrees C), while Pensacola came within one degree of its warmest daily maximum temperature with a value of 105 degrees F (40.6 degrees C).
Precipitation
As has been the case for the past several months, precipitation was highly variable across the Southeast in August. The wettest locations were found across northern portions of Alabama and Georgia, western North Carolina, southern Virginia, and coastal sections of Georgia and the Carolinas. Monthly precipitation was generally between 1 and 3 inches (25 and 76 mm) above average in these areas (125 to 150 percent of normal), with some locations, particularly those affected by Hurricane Idalia, running more than 6 inches (152 mm) above average for the month (at least 200 percent of normal). Alma, GA (1940-2023) recorded its wettest month on record with 15.06 inches (383 mm) of precipitation, breaking the previous record of 14.15 inches (359 mm) set in September 2004. Of this, 5.81 inches (148 mm) fell on the 30th from Hurricane Idalia, which ranks as the wettest August day and fifth wettest day of any month on record. A swath of 5 to 10 inches (127 to 254 mm) of precipitation, with some locally heavier amounts, fell across the Big Bend region of Florida and along southeastern portions of Georgia and the Carolinas in association with Hurricane Idalia on the 30th and 31st of the month. Cape Hatteras, NC recorded 7 inches (178 mm) of precipitation on the 31st, which was the third wettest August day on record (since 1874). A complex of thunderstorms dropped over 10 inches (254 mm) of rain in Patrick County in southwestern Virginia on the 28th, which resulted in flooded roadways, homes, and businesses. In contrast, the driest locations were found across southern portions of Alabama, northwest Florida, central Florida, and northern Virginia, where monthly precipitation was less than half of the expected amount. Pensacola, FL recorded 2.52 inches (64 mm) of precipitation, which is nearly 5 inches (127 mm) below average for the month. Charlottesville, VA recorded just 0.86 inches (22 mm) of precipitation in August, which is only 22 percent of normal. Precipitation in August was below average across Puerto Rico, except for some interior locations, and below average across the U.S. Virgin Islands.
Drought
At the start of the month, about 11 percent of the region was dry or in drought according to the U.S. Drought Monitor. Small areas of abnormal dryness (D0) or moderate (D1) drought were eliminated across northern sections of Alabama, Georgia, and South Carolina. Severe (D2) and extreme (D3) drought persisted across the West Coast of Florida, particularly in Manatee and Sarasota counties. Moderate (D1) drought emerged across the western Panhandle of Florida, while severe (D2) drought emerged across parts of southern Alabama. Abnormal dryness (D0) expanded across central and eastern sections of the Carolinas along with the emergence of small pockets of moderate (D1) drought. Drought conditions worsened across northern Virginia, with a small area of severe (D2) drought emerging by the end of the month. Overall, about 30 percent of the region was dry or in drought by the end of August. In the Caribbean, drought conditions improved across Puerto Rico. The area of severe (D2) drought on the northwest part of the island improved to moderate (D1) drought, while abnormal dryness (D0) was eliminated across the eastern half of the island and on the outlying islands. Conditions on Saint John improved from severe (D2) to moderate (D1) drought, while extreme (D3) drought persisted on Saint Thomas and Saint Croix.
Agriculture
Mostly warm and dry weather in August allowed many crops to mature, with harvesting well underway by the end of the month. Farmers were also preparing for the planting of fall crops. Dry conditions allowed some operators to complete second and even third cuttings of hay, and farmers in Florida noted favorable conditions for sugarcane production. However, the heat and lack of rain resulted in reports of crop damage. Wilting was observed on cotton, peanuts, and soybeans. As this is the time of year when water demand is highest, declines in soil moisture could limit their growth and yield potential. Apple orchards in Virginia reported premature ripening and smaller sizes due to the lack of rain, which is causing the apples to fall before picking season begins. Severe storms and heavy rainfall resulted in flooded fields across parts of Alabama, Georgia, and South Carolina, which limited field work and contributed to diseases such as corn rust and spotted wilt virus. Livestock and pastures were in mostly fair to good condition, though operators continued to note cases of heat stress and some pastures were turning brown due to the heat and lack of rain. Hot and dry weather continued to impact farming and ranching across the Caribbean. Many crops exhibited delayed growth, and a lack of soil moisture made it difficult to harvest and plant new crops. Work schedules for farmers had to be altered due to extreme temperatures. Dry conditions have led to significant feed shortages, while farmers continued to report losses to livestock and declines in egg production due to the heat. Hurricane Idalia resulted in significant impacts to agriculture across parts of Florida and Georgia at the end of the month. High winds blew down pecan trees, ripped plastic coverings off crops, and damaged farm equipment, building structures, and irrigation systems. Heavy rain flooded fields and increased disease pressures. Power outages resulted in the loss of refrigeration for pork and dairy and the loss of water and cooling for livestock. It was reported that several million chickens in Suwannee County, FL, just inland from where Idalia made landfall, were lost when the cooling systems in their coops lost power.
Notable Weather
There were 1,307 reports of severe weather across the Southeast in August, which is more than four times the median frequency of 306 reports over the period 2000 to 2022 (427 percent of normal). There were 24 confirmed tornadoes (15 EF-0s, 9 EF-1s), which is three times the median frequency of eight (300 percent of normal). More than half of these occurred in coastal sections of Georgia and the Carolinas in association with Hurricane Idalia on the 30th and 31st of the month. Most of the damage consisted of uprooted trees and downed power lines, some of which fell on vehicles, as well as torn roofs and siding materials. On the 9th of the month, an EF-0 touched down in northwest Puerto Rico in the town of Aguadilla, marking the second straight month with a confirmed tornado on the island. Fortunately, no tornado-related injuries or fatalities were reported in the region in August. There were 1,249 wind reports in August, which is more than four and a half times the median frequency of 270 (463 percent of normal). On the 3rd, thunderstorm wind gusts up to 80 mph (36 m/s) were observed across northern Alabama. At least 20 people attending part of the World’s Longest Yard Sale near Gadsden were injured while taking shelter from the storm. Straight-line winds between 50 and 60 mph (22 and 27 m/s) were observed across parts of Alabama, Georgia, and North Carolina on the 5th and 6th of the month. Additional storms on the 7th produced wind gusts up to 80 mph (36 m/s) across central portions of North Carolina, while severe thunderstorms in southern Georgia produced winds between 50 and 60 mph (22 and 27 m/s) on the 8th of the month. On the 10th, a microburst with estimated winds of over 100 mph (45 m/s) struck the town of Hampstead in southeastern North Carolina. Hartsfield Jackson Airport in Atlanta, GA recorded a 67 mph (30 m/s) wind gust on the 12th, making it the second highest gust on record for August (since 1945). Straight-line winds approaching 60 mph (27 m/s) were recorded at Reagan National Airport on the 14th. The following day, Columbia, SC recorded an 88 mph (39 m/s) wind gust, making it the highest wind gust on record (since 1942). The same complex of storms also produced deadly and damaging winds in central North Carolina. A woman was killed in Durham County when a tree fell on her car. Not far away, a wind gust of 72 mph (32 m/s) was recorded on the helipad at Duke University Hospital. There were 45 hail reports in August, which is above the median frequency of 28 (161 percent of normal). The largest hailstone was observed in Caroline County in eastern Virginia and measured 4.75 inches (120 mm) in diameter, making it the third largest hailstone on record in the state (since 1950). There were two lightning fatalities in the Southeast in August. A 28-year-old man was struck in Florence, AL on the 7th of the month and a 73-year-old woman was struck in Clearwater, FL on the 23rd of the month. In addition, there was one rip current death in Daytona Beach, FL on the 24th of the month. Two high school football players were transported to the hospital for heat-related illness in Madison County, AL on the 21st.
2023 Atlantic Hurricane Season
Six tropical cyclones formed in the Atlantic basin in August, two of which became major hurricanes. Both of these storms, Hurricanes Franklin and Idalia, affected the Southeast region. Franklin dropped up to 3 inches (76 mm) of rain across the southern end of Puerto Rico, and between 1 and 2 inches (25 and 51 mm) across the U.S. Virgin Islands, while a tropical storm between the 20th and 22nd of the month. On the morning of the 30th, Idalia made landfall near Keaton Beach in the Big Bend region of Florida as a strong Category 3 hurricane with winds of 125 mph (56 m/s). Storm surge ranged from around 8 feet (2.4 m) at Cedar Key to around 3 feet (1 m) in the Tampa Bay area. Numerous roadways and bridges were closed or otherwise impassable, while homes, businesses, and vehicles were inundated by the storm surge. Idalia weakened to a Category 1 hurricane as it moved across southeastern Georgia, then weakened to a tropical storm as it tracked across the coastal plain of South Carolina before emerging in the Atlantic Ocean. Wind gusts between 50 and 85 mph (22 and 38 m/s) were observed across the western Panhandle and West Coast of Florida, as well as along coastal sections of Georgia and the Carolinas. Brunswick, GA recorded a wind gust of 67 mph (30 m/s) on the 31st, making it the highest wind gust on record for August (since 1948). Tropical storm force winds were also recorded across central portions of Georgia and the Carolinas. Around 300,000 customers lost power in Florida, while 200,000 customers lost power in Georgia. Across the Carolinas, about 60,000 customers lost power. Heavy rain in Valdosta, GA prompted a flash flood emergency for the town, while downed power lines forced a nearby portion of I-75 to close. The track of Idalia also resulted in 2 to 4 feet (0.6 to 1.2 m) of storm surge along the Carolina coastline, which was exacerbated by the full moon and high tide cycle. Significant flooding was reported in downtown Charleston, SC and further south on Edisto Beach. According to the South Carolina State Climatology Office, the tidal gauge in Charleston Harbor crested at 9.23 feet (2.8 m), which is the fifth highest crest on record. Further inland, localized flooding shut down roadways and several rivers crested to at least moderate flood stage due to runoff. While many areas experienced significant flooding, some locations will likely see drought relief, particularly in eastern portions of the Carolinas where short-term precipitation deficits had been building for much of the month. Thus far, there have been two confirmed fatalities in Florida and one confirmed fatality in Georgia from Idalia.
For more information, please visit the Southeast Regional Climate Center Home Page.
High Plains (Information provided by the High Plains Regional Climate Center)
August ended with a bang, after one of the more significant heatwaves impacted parts of the region in the final days of the month. Thousands of daily temperature records were broken, after temperatures eclipsed 100 degrees F (37.8 degrees C) for nearly a week. Adding to miserably high temperatures, dewpoints reached up to 84 degrees F (28.9 degrees C). The unbearable and oppressive combination led to the heat index topping out at 134 degrees F (56.7 degrees C) in Lawrence on the 20th. Schools in Kansas and Nebraska were releasing early or closing due to the dangerous conditions in the afternoon, while athletic teams in both states were either forced to practice well before sunrise or indoors. Unfortunately, there were several deaths and a spike in emergency room visits as a result of this historic heatwave. Adding to the records broken this month, a 5.25-inch (13.34 cm) hailstone fell outside of Kirk, Colorado. Pending verification from the State Climate Extremes Committee, this would beat out a 4.83-inch (12.27 cm) stone that was recovered from Bethune in 2019. The storm would also go on to produce several tornadoes, including an EF-3 with 150 mph (241 km/h) winds.
Temperature
Warmer temperatures dominated much of the region but were not record-breaking despite the intense heatwave. Large portions of the region observed 2 to 4 degrees F (1.1 to 2.2 degrees C) above normal temperature, while only a few isolated locations reporting below-normal temperatures. All walks of daily life were impacted by the historic heatwave near the end of the month. Crops were burnt to a crisp, all but sealing the fate of an already poor crop for some. Hundreds of cattle reportedly perished in Kansas and Nebraska after the heat index surpassed 120 degrees F (49 degrees C) for multiple days. Manhattan, Kansas hit 115 degrees F (46 degrees C) on the 19th, beginning one of the warmest weeks for the city. From the 19th to the 25th, the average high temperature was 108.3 degrees F (42.4 degrees C). This put a serious strain on utility providers, as the extended period of heat forced people to use air-conditioning longer than usual to cool their homes.
Precipitation
The western parts of the region continued the summertime trend of above-normal precipitation. Some areas in the Dakotas and Wyoming received record to near-record precipitation, which eliminated drought conditions. Southwestern North Dakota, northern South Dakota, and much of Wyoming recorded well above-normal precipitation this month. Although no records were broken at major locations, several outer-lying areas observed record-breaking amounts. De Smet, South Dakota received 7.28 inches (18.49 cm) of rain, breaking the record set in 1893. Nearby Webster recorded the highest in the region and broke their record, with 9.93 inches (25.22 cm). With the end of August, summer has reached its conclusion. Precipitation amount was favorable in Wyoming, the Front Range of the Rockies, and southwestern Kansas. Cheyenne, Wyoming ranked 2nd wettest with a whopping 11.02 inches (27.99 cm) precipitation, well above their normal of 5.79 inches (14.71 cm). In Colorado, Akron and Colorado Springs ranked 3rd wettest, while Rawlins, Wyoming ranked 3rd as well. While much of Colorado had abundant precipitation, Alamosa had its driest summer with a meager 0.56 inches (1.42 cm).
Drought
Drought conditions improved across the central portions of the region but continued to degrade in North Dakota and southwestern Colorado. Overall, abnormally dry to exceptional drought (D0-D4) was reduced by nearly 7 percent in the High Plains. An unusual pattern this summer has led to high precipitation amounts in the western part of the region, with Wyoming benefiting the most. The entire state is drought-free for the first time since July of 2019. Kansas continued to improve, with a 10 percent reduction to extreme to exceptional drought (D3-D4) this month. Despite improvements this month, drought firmly remains entrenched in eastern Nebraska. Elsewhere in the region, other localized improvements and degradations were observed.
For more information, please visit the High Plains Regional Climate Center Home Page.
South (Information provided by the Southern Regional Climate Center)
Heat and drought affected much of the Southern Region in August, setting many records across Texas, Louisiana, and Mississippi.
Temperature
Above normal temperatures were prevalent across wide swaths of the Southern region, especially across Texas, Louisiana, and southern Mississippi where temperatures were six to ten degrees above normal for August. In Tennessee and isolated areas of northern Mississippi and northeastern Arkansas temperatures were slightly below normal for August. Statewide averages for all states were well above their median values except Tennessee which was close to its historical median value (64th warmest, out of 129 years). Louisiana (1st) and Mississippi (1st) both experienced their hottest Augusts on record, running 5.7 F and 4.1 F above their 1991-2020 normals. Texas (2nd) and the Southern Region (2nd) as a whole had their second hottest August on record, while Oklahoma (20th) and Arkansas (24th) were also well above normal for August. The warmest recorded temperature in the region was 118 F at Rio Grande Village, Texas on August 11th, two degrees shy of the all-time state record for Texas. The coldest observed temperature in the region was 37 F at Mt. Leconte, Tennessee on August 31st. The coldest observed lowland temperatures were 50 F at Celina and Portland, Tennessee on August 29th and 18th respectively. Sixty-five long-term stations set records for highest maximum temperatures for August, one in Tennessee and Mississippi, 22 in Louisiana, and 41 in Texas. No stations set records for lowest minimum temperatures during August. Forty-wo long-term stations set records for highest minimum temperature in August, the warmest being 86 F at Castolon, Texas on August 11th.
Precipitation
Precipitation was below normal for much of the Southern Region during August except for much of Tennessee, northern Arkansas, and deep south Texas. State totals were extremely low for Louisiana, which experienced its driest August on record with 1.27 inches of precipitation vs. the 1991-2020 normal of 5.1 inches. Also very dry were Mississippi (5th driest) and Texas (8th driest). The Southern Region as whole (16th driest) and Oklahoma (42nd driest) were drier than normal as well. Conversely, Tennessee recorded its 8th wettest August. Six stations exceeded twelve inches of precipitation for the month of August, all in Tennessee, and consisted of five CoCoRaHS sites and one COOP site: near Madisonville (13.95 inches), near Jackson (12.68), near Dickinson (12.43), near Greenville (12.34), Mt. Leconte (12.28), and near Mckenzie (12.02). Two stations, one in Arkansas and one in Tennessee, had single-day accumulations at or exceeding seven inches: Batesville, Arkansas (7.25 inches, August 10th) and near Madisonville, Tennessee (7.00 inches, August 30th). Five stations, four in Arkansas and one in Tennessee, set single day accumulation records for August, including Batesville.
Drought/Flooding
During August the Southern Region saw degradation of drought conditions across a majority of the region, the exceptions being northern Oklahoma, northern Arkansas, and isolated areas of Tennessee and deep south Texas. As of August 29th, northern Oklahoma, most of Arkansas, northern Mississippi, and much of Tennessee remained drought free. Extreme and exceptional drought, according to the US Drought Monitor, expanded significantly across the region during August with much of that expansion occurring from central Texas across through coastal Mississippi. As of August 29th, 56 percent of the Southern Region was in some level of drought, with 25 percent of that being Extreme and 8 percent being Exceptional. Drought conditions, exacerbated by record hot temperatures, have led to short to very short topsoil conditions across much of the Southern Region, the exception being Tennessee. The hot and dry conditions have particularly impacted the cotton crops in Oklahoma and Texas, with both states only reporting eleven percent of cotton crops being rated as Good to Excellent by the USDA as of September 3rd. Dry and hot conditions have led to burn bans, water restrictions, and low streamflow in many areas affected by drought. In the Highland Lakes in Texas, the lowest inflows on record were recorded in August, with records dating back to 1942. Conversely, areas of northwestern Tennessee saw severe flash flooding events associated with heavy rains on August 4th. Rangeland and pasture conditions in the western portions of the region continue to suffer, and there are increasing reports of ranchers reducing the size of their herds due to feed and water limitations.
Notable Weather
August saw continued record-breaking heat across much of the Southern Region, particularly in Texas, Louisiana, and Mississippi. The extreme heat in the region has particularly impacted Texas, where 285 stations in the state reported 3 weeks or more of 100+ F days during August. Two stations in Texas were at or above 100 F for all 31 days during August: Columbus and Austin. Louisiana and Mississippi also saw extreme heat as well, with 33 stations and nine stations reporting 3 weeks or more of 100+ F days during August. In eastern Texas and Louisiana, these high temperatures have often been accompanied by high humidity. This combination of extremes has led to several deaths across the region throughout August and earlier in the summer. Preliminary numbers across the region have been spotty but more deaths are likely to be attributed to the heat as the summer comes to a close. August saw less severe weather in much of the region than previous months in 2023. Five tornadoes were reported across the region in August, impacting two states in the Southern Region: Texas (2 tornadoes) and Tennessee (3 tornadoes). Three tornadoes were rated as EF0 and two as EF1. Minor structural damage to two apartment complexes was reported with the EF1 tornado in Karns, Tennessee on August 7th. There were 37 reports of hail during August, the largest being 2.5-inch hail near Searcy, Arkansas on August 7th. There were 359 reports of severe winds in August, with the fastest being 95 mph near Catoosa, Oklahoma on August 14th. After a quiet 2022, the Southern Region saw its first landfalling tropical system, Tropical Storm Harold, which affected south Texas on August 22nd, making landfall with 50 mph winds near South Padre Island, Texas. The storm brought gusty winds and much needed rain to the affected area. Over 35,000 people lost power in southern Texas. The London Independent School District was closed for several days due to classroom and septic system damage.
For more information, please visit the Southern Regional Climate Center Home Page.
West (Information provided by the Western Region Climate Center)
Much of California and the Great Basin had a rare wet August with monthly precipitation totals more than 300 percent of normal. The extreme rainfall event resulted from remnants of Hurricane Hilary being drawn northward and interacting with an area of low pressure off the coast of northern California that ejected to the northeast and entrained excessive moisture. Most of southern Arizona and New Mexico saw well below normal precipitation which continued the trend of one of the driest monsoon seasons on record. Temperatures were near-to-below normal across parts of southern California, Nevada, and western Utah and above normal elsewhere.
Temperature
Temperatures were 3-6 degrees Fahrenheit above normal across western Oregon and western Washington and many locations set records for the warmest August. Some notable locations with record warm mean monthly temperature in Oregon include Portland (4.8 degrees Fahrenheit above normal), Salem (3.8 degrees Fahrenheit above normal), Eugene (4.6 degrees Fahrenheit above normal), Astoria (4.2 degrees Fahrenheit above normal), and Quillayute, Washington also set a new August record with an anomaly of 6.1 degrees Fahrenheit above normal. After a record shattering July with extreme temperatures the heat continued for Arizona and New Mexico throughout August. Phoenix, Arizona saw its second warmest August on record at 98.8 degrees Fahrenheit (4.4 degrees Fahrenheit above normal), Tucson, Arizona had its third warmest August at 89.9 degrees Fahrenheit (3 degrees Fahrenheit above normal), and Albuquerque, New Mexico also had its third warmest August at 80 degrees Fahrenheit (3.1 degrees Fahrenheit above normal).
Precipitation
Hilary made landfall as a Category 1 hurricane in Baja California and then weakened into a tropical storm before crossing into southern California impacting the region August 20-21. This was the first tropical storm to pass over California since Nora in 1997. The hardest hit areas were southern California into southwest Nevada. Around the Los Angeles (LA) area 2-4 inches of rainfall fell with locally higher amounts in the mountains. LA Downtown (2.99 inches), LA Airport (2.57 inches), Long Beach (2.66 inches), and Bishop (2.08 inches) all broke records for August total precipitation in California; Great Basin National Park, Nevada (5.98 inches), and Boise, Idaho (2.51 inches) also saw record August precipitation. At the other end of the spectrum, southern Arizona and much of New Mexico saw another dry monsoon month with many locations receiving less than 50 percent of normal precipitation. Phoenix, Arizona logged just 0.12 inches of rain (13 percent of normal) and White Signal, New Mexico had its driest August in 50 years of records with 0.25 inches of rain (2.49 inches below normal).
Drought
According to the U.S. Drought Monitor at the end of August, 31 percent of the West was in drought. Drought conditions have worsened over Arizona, New Mexico, southwest Colorado, northern Montana, Washington, and parts of western Oregon. Extreme drought (D3) can be found in parts of northwest Washington, northwest Montana, and New Mexico. Remnants of Hurricane Hilary helped to erase remaining drought conditions in southeast California and southwest Nevada.
Alaska Summary
Temperatures were 2-5 degrees Fahrenheit above normal across much of Alaska with the largest anomalies throughout the Interior. Northway had its warmest August on record at 60.3 degrees Fahrenheit (5.3 degrees Fahrenheit above normal) and Fairbanks had its third warmest August at 61.2 degrees Fahrenheit (4.2 degrees Fahrenheit above normal). On the Panhandle, Sitka saw its second warmest August at 60.6 degrees Fahrenheit (3.3 degrees Fahrenheit above normal). Precipitation was above normal across most of Alaska except for some isolated areas in the Interior, southwest Alaska, and the Panhandle. Anchorage recorded 3.83 inches of precipitation in August (131 percent of normal) and Nome logged 4.61 inches (143 percent of normal). Only 0.01 inches of precipitation fell at Northway, where the August normal is 1.79 inches, making it the driest August on record.
Hawaii Summary
Precipitation was below normal across the region with many locations receiving less than 50 percent of normal for the month of August. On Maui, Hana recorded 1.88 inches of precipitation for the month (31 percent of normal) coming in as the fourth driest on record. Lihue, on the east coast of Kauai, measured 0.89 inches of precipitation for the month (38 percent of normal). On the Big Island Hilo logged 5.35 inches of precipitation at 47 percent of normal. Dryness led to drought expansions based on the U.S. Drought Monitor with 61 percent of Hawaii in drought at the end of August with three category degradations (no drought to D2) in parts of the Big Island. The entire west coast of Maui, including where the Lahaina fires occurred, was in severe drought (D2) at the end of August.
Notable Weather
Widespread impacts from Hurricane Hilary remnants across Southern California: Tropical and post-tropical storm conditions impacted southern California on August 20-21 as remnants of Hurricane Hilary, which peaked as a Category 4 storm, moved onshore. Parts of the Transverse Range recorded more than ten inches of rain and Death Valley set its all-time single day precipitation record at 2.20 inches. Heavy rain and high winds led to flash flooding, debris flows, damaged roadways, and downed trees. At the peak of the impacts more that 50,000 people across the region were without power.
For more information, please go to the Western Regional Climate Center Home Page.