National Overview

July Highlights

July Temperature
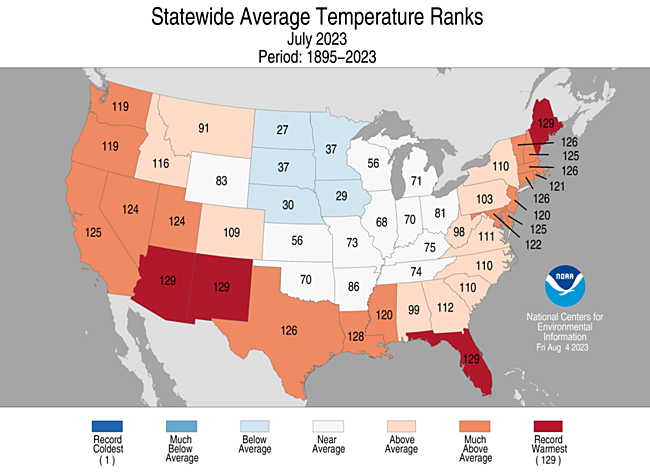
The contiguous U.S. average temperature during July was 75.7°F, 2.1°F above average, ranking 11th warmest in the 129-year record.
Generally, temperatures were below average in the central and northern Plains and Upper Midwest. Temperatures were above average from the West Coast to the southern Plains and along the Gulf and East coasts and in parts of the Great Lakes.
For the month of July, Arizona, New Mexico, Maine and Florida ranked warmest on record for July while Louisiana ranked second warmest on record. An additional 13 states ranked among their top-10 warmest July on record.
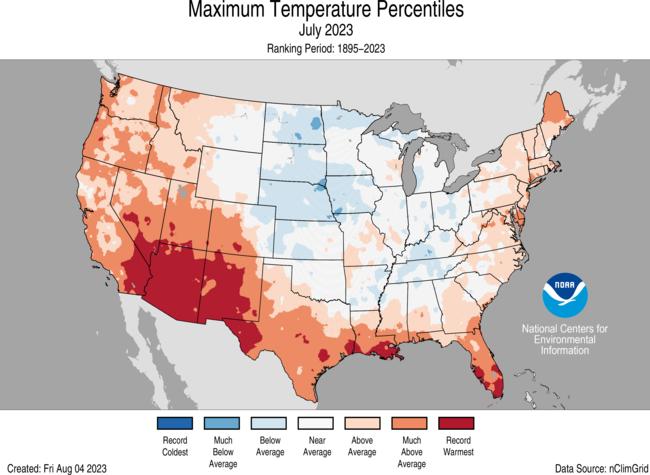
The contiguous U.S. average maximum (daytime) temperature during July was 88.7°F, 2.1°F above the 20th century average, ranking 14th warmest July for daytime temperatures in the historical record. Maximum temperatures were above average across much of the West and in parts of the southern Plains, Gulf Coast and East Coast. Temperatures were below average in parts of the central and northern Plains and in the Ohio and Tennessee valleys. Arizona and New Mexico ranked warmest July for daytime temperatures, while eight additional states ranked among their top-10 warmest July for daytime temperatures.
The contiguous U.S. average minimum (nighttime) temperature during July was 62.7°F, 2.2°F above the 20th century average, ranking 11th warmest July for overnight temperatures on record. Minimum temperatures were above average across much of the contiguous U.S. while near- or below-normal temperatures were observed across the central and northern Plains and Upper Midwest. Arizona, Maine, New Hampshire and Florida each ranked warmest July on record, while New Mexico, Louisiana and Massachusetts each ranked second warmest July on record. An additional 15 states experienced a top-10 warmest July for nighttime temperatures.
The Alaska statewide July temperature was 56.1°F, 3.4°F above the long-term average. This ranked 5th warmest in the 99-year period of record for the state. Temperatures were above average across most of the state while pockets of near-average temperatures were observed in south central and southwestern portions of the state.
Based on NOAA's Residential Energy Demand Temperature Index (REDTI), the contiguous U.S. temperature-related energy demand during July was 208 percent of average and the sixth-highest value in the 129-year period of record.
July Precipitation

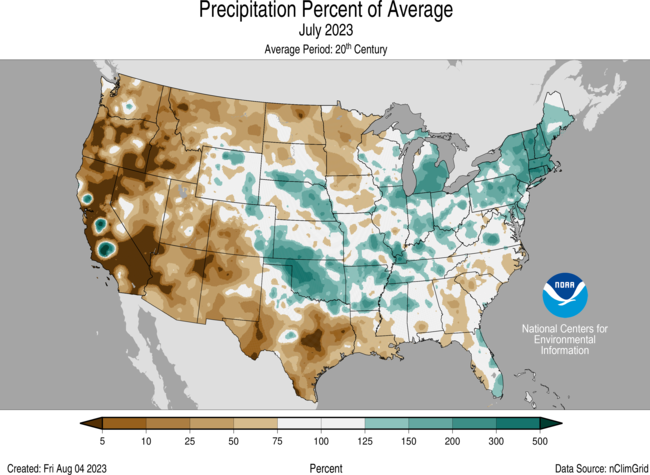
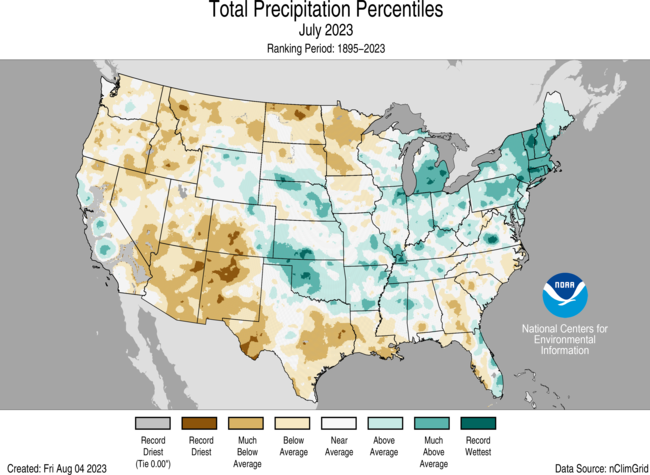
The July precipitation total for the contiguous U.S. was 2.70 inches, 0.08 inch below average, ranking in the middle third of the 129-year record.
Precipitation was below average across much of the West and in parts of the northern and southern Plains, Upper Mississippi Valley and Southeast. Precipitation was above average across much of the Northeast, the Great Lakes and in central parts of the Plains and Mississippi Valley.
Idaho, Arizona and Minnesota each had their third-driest July on record, while two additional states had their top-10 driest July on record. Conversely, Vermont and Connecticut ranked second wettest for the month with seven additional states ranking among their top-10 wettest July on record.
Across the state of Alaska, the average monthly precipitation was 3.51 inches, ranking in the middle third of the historical record. Conditions were wetter than average across most of the state while parts of the North Slope were near normal during the month. Below-normal precipitation was observed in parts of the Southeast Interior and Panhandle while parts of the Northeast Gulf had their driest July on record.
According to the August 1 U.S. Drought Monitor, about 28.1% of the contiguous U.S. was in drought, up about 1.1% from the beginning of July. Drought conditions expanded or intensified along the Northern Tier, Upper Midwest, Southwest, southern Plains, Alaska and Puerto Rico during July. Drought contracted or was reduced in intensity across portions of the central Plains, Great Lakes, Ohio Valley, Northeast and in parts of the Great Basin.
Billion-Dollar Weather and Climate Disasters
Three new billion-dollar weather and climate disasters were confirmed this month, two of which occurred during the month of June and one during April. All of these disasters were severe storm events.
There have been 15 confirmed weather and climate disaster events, each with losses exceeding $1 billion this year. These disasters consisted of 13 severe storm events, one winter storm and one flooding event. The total cost of these events exceeds $39.7 billion, and they have resulted in 113 direct and indirect fatalities. For this year-to-date period, the first seven months of 2023 rank highest for disaster count, ahead of 2017 with 14 disasters.
Since these billion-dollar disaster records began in 1980, the U.S. has sustained 363 separate weather and climate disasters where overall damages/costs reached or exceeded $1 billion (based on the CPI adjustment to 2023) per event. The total cost of these 363 events exceeds $2.590 trillion.
Other Notable Events
Temperatures were warmer than average across much of the U.S. during July:
- The Southwest region as a whole tied with 2003 as the warmest July on record, while Arizona and New Mexico had their warmest July on record by nearly 2°F.
- Across the Southwest, 36 counties each had their warmest July on record while an additional 63 counties ranked in the top-10 warmest for the month.
- Phoenix, Arizona had an average temperature of 102.8°F for the month of July—the hottest month on record for any U.S. city. Contributing to the record, Phoenix had 31 consecutive days of temperatures above 110°F from June 30 to July 30—breaking the previous record of 18 days set in 1974.
- On July 16, Death Valley soared to 128°F, setting a daily-temperature record, and reported its hottest midnight temperature on record at 120°F on July 17.
- July overnight temperatures were warmest on record across the New England region.
- Much of the eastern U.S. has been consistently warmer than average during 2023 with 28 states experiencing a top-10 warmest January–July including Florida, which ranked warmest on record.
Several notable weather systems produced severe storms that impacted portions of the U.S. in July:
- On July 10, severe storms brought devastation and flooding to portions of the Northeast, as areas reported up to eight inches of rain within a 24-hour period. Montpelier, Vermont received a record-breaking 5.28 inches of rain, flooding the city and damaging thousands of homes and businesses.
- On July 18-19, a historic flash flood occurred over portions of Kentucky and Illinois after areas received rainfall totals up to 12 inches, causing significant damage and trapping residents in their homes. Mayfield, Kentucky received 11.28 inches of rain in a 24-hour period, likely breaking the state record for 24-hour rainfall of 10.48 inches set on March 1, 1997.
- On July 24-25, an extreme thunderstorm outbreak produced more than 19,000 lightning strikes causing dozens of new wildfires in the state of Alaska. Overall, 2023 ranks as the second lowest fire season, by acres burned, in the past 30 years for the state.
Year-to-Date Highlights


January-July Temperature

For the January-July period, the average contiguous U.S. temperature was 53.0°F, 1.7°F above average, ranking 16th warmest on record for this period.
Temperatures were above average from the southern Plains to the East Coast and along parts of the Northern Tier, with near- to below-average temperatures from the northern Plains to the West Coast.
Florida ranked warmest on record while Massachusetts, Connecticut, New Jersey, Delaware, Maryland, Mississippi and Louisiana each ranked second warmest for the January–July period. An additional 20 states had a top-10 warmest year-to-date period. No state experienced a top-10 coldest event for this seven-month period.
The contiguous U.S. average maximum (daytime) temperature during January-July was 64.8°F, 1.5°F above the 20th century average, ranking in the warmest third of the historical record. Above-average temperatures were observed across much of the eastern contiguous U.S. and in parts of the Northwest. Near- to below-average temperatures were observed from the northern Plains to the West Coast. Florida ranked warmest on record while Massachusetts, Connecticut, New Jersey, Delaware and Maryland each ranked second warmest on record for daytime temperatures during January-July period, while 19 additional states ranked among their top-10 warmest January-July on record for daytime temperatures. No state experienced a top-10 coldest July on record for this seven-month period.
The contiguous U.S. average minimum (nighttime) temperature during this seven-month period was 41.2°F, 1.9°F above the 20th century average, ranking 15th warmest in the historical record. Above-average nighttime temperatures were observed across much of the eastern contiguous U.S. and along parts of the Northwest and Plains. Florida ranked warmest on record, while New Hampshire, Massachusetts, Connecticut and Mississippi each ranked second warmest on record for nighttime temperatures. 21 additional states experienced a top-10 warmest event for nighttime temperatures during the January-July period. Nighttime temperatures were near- to below-average from the West Coast to the Rockies and in parts of the Plains.
The Alaska January-July temperature was 27.6°F, 1.8°F above the long-term average, ranking in the warmest third of the historical record for the state. Much of the state was above normal for the seven-month period while temperatures were near average across much of the Interior and West Coast.
Based on REDTI, the contiguous U.S. temperature-related energy demand during January-July was 30 percent of average and was the sixth-lowest value on record.
January-July Precipitation

The January-July precipitation total for the contiguous U.S. was 18.41 inches, 0.32 inch above average, ranking in the middle third of the 129-year record.
Precipitation was near to above average from California to the western Great Plains, Northeast, and in parts of the southern Mississippi Valley, northern Great Lakes and Southeast. New Hampshire had its fifth wettest year-to-date period on record while two additional states ranked among their top-10 wettest for this period.
Conversely, precipitation was below average across parts of the Northwest, eastern Plains, Southwest, central Mississippi Valley, Mid-Atlantic and along parts of the Gulf during the January–July period. Maryland ranked 10th driest on record for this seven-month period.
The January-July precipitation ranked 15th wettest in the 99-year record for Alaska, with above-average precipitation observed across much of the state. Near-normal precipitation was observed in parts of south-central Alaska, Southeast, and in parts of the Aleutians during this period.
Extremes
The U.S. Climate Extremes Index (USCEI) for the year-to-date period was 11 percent above average, ranking in the middle third of the 114-year period of record. Extremes in warm maximum temperatures and warm minimum temperatures were the major contributors to this elevated CEI value. The USCEI is an index that tracks extremes (occurring in the upper or lower 10 percent of the record) in temperature, precipitation and drought across the contiguous United States.
On the regional scale, the South and Ohio Valley ranked above average while the Northeast and Southeast ranked much-above average for this year-to-date period. Each of these regions experienced elevated extremes in warm maximum temperatures and warm minimum temperatures, while the South also experienced dry PDSI values. Conversely, extremes across the Northwest were 85 percent below average ranking as their sixth lowest year-to-date period on record.
Monthly Outlook
According to the July 31 One-Month Outlook from the Climate Prediction Center, much of the southern contiguous U.S., Pacific Northwest and Alaska favor above-normal monthly average temperatures in August, with the greatest odds along the Gulf Coast. The best chances for below-normal temperatures are forecast for the northern parts of the Rockies and Plains and in the Northeast. Much of the northern Rockies to the Mid-Atlantic and Northeast are favored to see above-normal monthly total precipitation while below-normal precipitation is most likely to occur from eastern Arizona to the Florida Panhandle, as well as southwestern and southeastern Alaska. Drought improvement or removal is forecast from the central Plains to parts of the Great Lakes and in parts of the Mid-Atlantic, Florida and Puerto Rico, while persistence is more likely in portions of the Northwest, Southwest, southern Plains, northern Great Lakes and parts of the northern Plains and Hawaii. Drought development is likely in parts of the Northwest, Southwest, southern Plains and Hawaii.
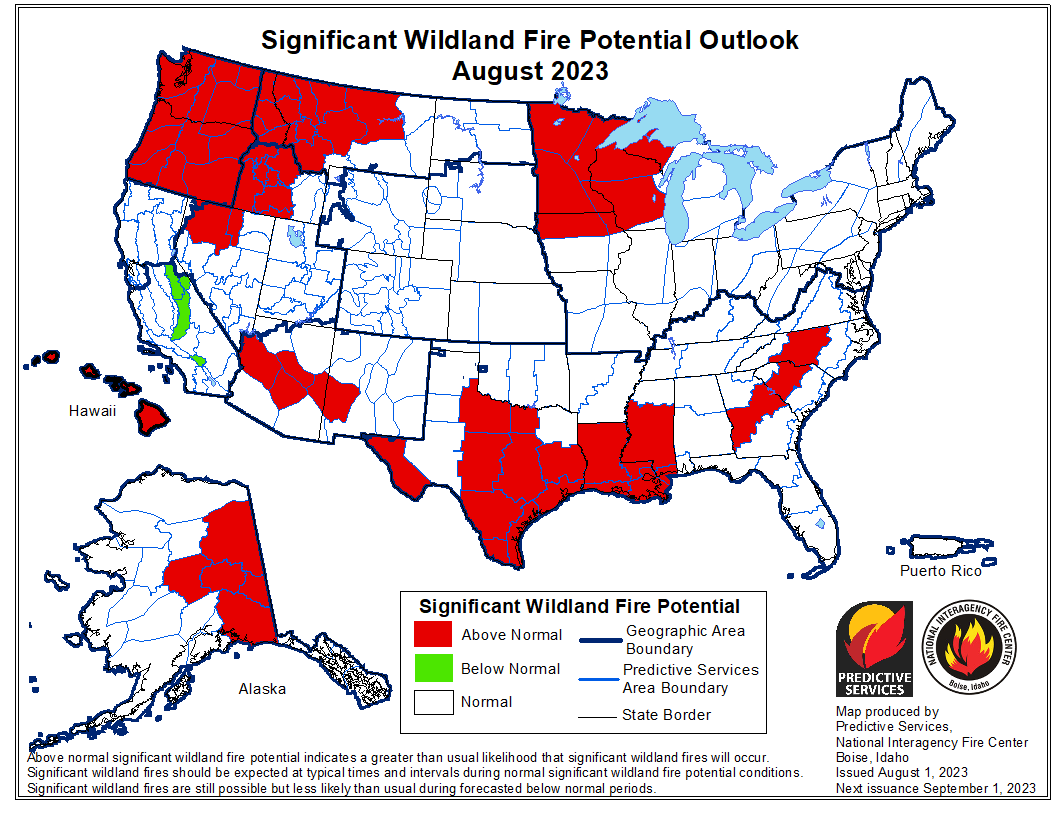
According to the One-Month Outlook issued on August 1 from the National Interagency Fire Center, Hawaii and portions of the Northwest, Upper Midwest, Southwest, southern Plains, Lower Mississippi Valley, Southeast and eastern Alaska have above-normal significant wildland fire potential during August, while parts of California are expected to have below-normal potential for the month.
Regional Highlights
These regional summaries were provided by the six Regional Climate Centers and reflect conditions in their respective regions. These six regions differ spatially from the nine climatic regions of the National Centers for Environmental Information.
Northeast (Information provided by the Northeast Regional Climate Center)
July was a warm, wet month for the Northeast, with near-daily severe weather and several devastating flash flooding events.
Temperature
The Northeast had its seventh warmest July since records began in 1895 with an average temperature of 72.5 degrees F, 2.3 degrees F above normal. State average temperature departures for July ranged from 0.7 degrees F above normal in West Virginia to 4.4 degrees F above normal in Maine. This July ranked as the warmest on record for Maine and among the 10 warmest Julys for nine additional states: New Hampshire, second warmest; Connecticut, Massachusetts, and Vermont, third warmest; Delaware, fourth warmest; New York, sixth warmest; Rhode Island, seventh warmest; Maryland, eighth warmest; and New Jersey, 10th warmest. Caribou, Maine, experienced its all-time warmest month on record this July with an average temperature of 71.5 degrees F, beating the old record of 70.9 degrees F set in 2018.
Precipitation
It was the fourth wettest July since recordkeeping began for the Northeast, which picked up 6.14 inches of precipitation, 141 percent of normal. July precipitation for the 12 Northeast states ranged from 101 percent of normal in West Virginia to 250 percent of normal in Connecticut. This July ranked among the 20 wettest Julys on record for nine states: Connecticut and Vermont, second wettest; Rhode Island, third wettest; Massachusetts and New Hampshire, fourth wettest; New York, ninth wettest; Pennsylvania, 12th wettest; Delaware, 14th wettest; and Maine, 19th wettest. Hartford, Connecticut, had its wettest July on record with 13.93 inches of precipitation, surpassing the old record of 11.24 inches from 1938. Similarly, Albany, New York, had a record wet July with 10.70 inches of precipitation, besting the old record of 9.91 inches from 2009.
Drought
The U.S. Drought Monitor from July 4 showed 1 percent of the Northeast in severe drought, 19 percent in moderate drought, and 41 percent as abnormally dry. Multiple parts of the Northeast saw excessively wet conditions during July, alleviating drought and dryness but also, in some locations, causing flash flooding. Severe drought eased in south-central Pennsylvania and shrank in coverage in central Maryland. Meanwhile, moderate drought was erased from Vermont, Connecticut and contracted in New York, Pennsylvania, New Jersey, Maryland, and West Virginia. Additionally, abnormal dryness eased in Vermont, Massachusetts, and Delaware, and contracted in the rest of the Northeast. The U.S. Drought Monitor from August 1 showed 1 percent of the Northeast in severe drought, 3 percent in moderate drought, and 11 percent as abnormally dry. Heavy rain during July boosted streamflow for most areas. The main exceptions were parts of eastern West Virginia, central Maryland, south-central Pennsylvania, and western New York, which generally saw less precipitation and continued to report below-normal flows. Similarly, record low groundwater levels were found in areas such as eastern West Virginia, central Maryland, south-central Pennsylvania, and eastern New Jersey at times during the month.
Notable Weather
Multiple Air Quality Alerts were issued in July, particularly on July 17 and 18 when a plume of smoke, this time from wildfires burning in western Canada, reduced air quality and produced hazy skies in the Northeast. Air quality reached unhealthy levels in several areas including parts of Pennsylvania and New York. Severe thunderstorms and/or flooding affected the Northeast almost every day during July. Data from the Iowa Environmental Mesonet shows that a few National Weather Service offices including those in Philadelphia, Pennsylvania; New York, New York; and Burlington, Vermont, issued their greatest number of flash flood warnings for any month since records began in the mid-1980s. Several states saw significant flood damage ranging from destroyed roads to hundreds of uninhabitable homes to complete losses of thousands of acres of crops. Damage assessments are ongoing; however, some very preliminary data indicates losses in the millions for multiple areas. For instance, preliminary estimates put the flood damage in West Point, New York, over $100 million, while Vermont has already spent over $35 million to repair flood-damaged roads and preliminary estimates from Massachusetts indicate at least $15 million in crops, at least 2,000 acres, were lost. Some notable examples of the severe storms and flash flooding in the Northeast during July follow:
- July 2: Seven weak (EF-0 or EF-1) tornadoes touched down in Pennsylvania, with storm reports noting downed trees and mostly minor damage to buildings and other residential property.
- July 4: Flash flooding targeted southern New England where vehicles became stuck in floodwaters, requiring water rescues of some occupants. A series of downbursts produced widespread wind damage in parts of western New Jersey. Numerous trees were felled, which downed power lines, blocked roads, and damaged homes.
- July 9 and 10: Extreme rainfall of over 5 inches inundated several locations in an area stretching from southeastern Pennsylvania to Vermont and western New Hampshire. Two areas in particular, the state of Vermont and New York’s Hudson Valley, saw some of the heaviest rain, between 5 and 9 inches. A CoCoRaHS site near Middlesex, Vermont, saw 8.03 inches of rain in two days, qualifying as a 500-year storm event, with a 0.2 percent chance of occurring in a given year. Preliminary data indicates that Middlesex’s two-day rainfall total was the greatest two-day rainfall for July in Vermont, with several other CoCoRaHS sites rounding out the top 10. Meanwhile, the National Weather Service COOP site in West Point, New York, saw 9.50 inches of rain in a day, a 200-year storm event with a 0.5 percent chance of occurring in a given year. That single day rainfall amount was more than the site typically sees in all of June and July combined. Preliminary data indicates that West Point’s rainfall for July 10 ranks as the greatest daily rainfall total for July in New York, with another COOP, Shrub Oak, having the fifth greatest. Southeastern Pennsylvania also saw excessive rainfall. For instance, Reading, PA, was inundated by 4.04 inches of rain in three hours, exceeding a 100-year storm event with a 1 percent chance of occurring in a given year. Both Vermont and southeastern New York saw devastating flooding, with a rare Flash Flood Emergency issued for a few areas, signifying a dangerous, life-threatening situation. Several waterways in Vermont reached major flood stage, with water levels at a few locations reaching five highest on record. For instance, preliminary data shows that the Winooski River at Montpelier crested at 21.35 feet, its second highest level since records began in the early 1900s. The Lamoille River at Johnson and Otter Creek at Rutland reached similar milestones. There were significant flooding impacts in Vermont and southeastern New York. Floodwaters inundated roads and buildings, trapping people, with over 100 rescues in Vermont. A few Vermont roads remained closed for more than three weeks, with chunks of some roads washed away. Due to potential contamination of municipal and private water supplies from floodwaters, multiple Vermont communities issued boil water advisories and residents were advised to have well water tested before consuming. Vermont officials also advised people to stay out of bodies of water due to possible contamination from things like sewage and chemicals, as well as various flooding-related hazards such as strong undercurrents or unseen debris below the surface. Notable flooding and impacts also occurred in other areas that saw extreme rainfall or were downstream from those areas including eastern Pennsylvania, western Connecticut, and western Massachusetts. Dozens of beaches in New England, most in Massachusetts, were closed due to unsafe water quality caused by high levels of bacteria. Heavy rain runoff causing sewers to overflow is likely to have contributed.
- July 15 and 16: With wet antecedent conditions and heavy rainfall, multiple parts of the Northeast were primed for flash flooding. Between 4 and 8 inches of rain fell in portions of eastern Pennsylvania, where floodwaters swept away vehicles resulting in at least five deaths. In central Pennsylvania, Williamsport picked up 3.29 inches of rain, tying its wettest July day since 1895. Meanwhile, 5.23 inches of rain fell in two hours on New York’s Long Island, easily surpassing a 200-year storm event and leading to multiple impassable roads and stranded vehicles. Islip, on Long Island, saw 4.65 inches of rain, its wettest July day since 1963. In rain-soaked Vermont, an additional 4 inches of rain caused a mudslide that destroyed a house and caused several others to be evacuated. In New Hampshire, where as much as 6.50 inches of rain fell, more than 125 roads maintained by state or local governments sustained major damage, with chunks of roads washed away. Officials in that state warned residents that floodwaters could have contaminated wells and that swimming areas could have higher levels of bacteria due to runoff from heavy rain. Additionally, an EF-0 tornado caused tree damage in Worcester County, Massachusetts.
- July 21 and 24: There were several reports of straight-line winds causing damage in parts of New York, Pennsylvania, and West Virginia. For instance, a microburst with winds of up to 100 mph destroyed two barns and uprooted trees in central New York, while a microburst winds of up of to 70 mph downed trees which fell onto cars in Brooklyn, New York. Additionally, there was a report of tennis ball-sized hail (2 inches) in Warren County, Pennsylvania, the county’s largest hailstone since 1985.
For more information, please visit the Northeast Regional Climate Center Home Page.
Midwest Region (Information provided by the Midwest Regional Climate Center)
Temperature
The average July temperature for the Midwest was 72.3 degrees F (22.4 degrees C), which was 0.5 degrees F (0.3 degrees C) below the 1991-2020 normal. Temperatures were 1-3 degrees F (0.6-1.7 degrees C) below normal in the northwest and near to slightly above normal across the central and southeastern portions of the region. Preliminary statewide average temperatures ranged from 1.8 degrees F (1 degrees C) below normal in Minnesota to 0.6 degrees F (0.3 degrees C) above normal in Ohio. High heat and humidity settled across the Midwest during the last week of July, with maximum heat index values exceeding 110 degrees F (43.4 degrees C) as far north as Minnesota and Wisconsin. Throughout the month, there were 289 daily high temperature records broken or tied, with nearly all records achieved during the last week of July. There were 312 daily low temperature records in July, with most records having been set in the western and southern portions of the region mid-month.
Precipitation
July precipitation totaled 4.34 inches (110mm) for the Midwest, which was 0.24 inches (104 mm) above normal, or 106 percent of normal. Precipitation was near to above normal east of the Mississippi River and below normal to the west, with mixed conditions in Missouri. Statewide precipitation totals ranged from 1.49 inches (38 mm) below normal in Minnesota to 1.7 inches (43 mm) above normal in Michigan. Preliminary rankings indicate Michigan had the 3rd wettest July on record. Chicago’s Midway Airport had the wettest July on record, dating back 93 years, with 11.28 inches (286.5 mm) of precipitation for the month. Port Huron, Michigan had the wettest July on record with 7.14 inches (181.4 mm). Paducah, Kentucky had the 2nd wettest July on record with 10.6 inches (269.2 mm) of precipitation for the month. There were 373 daily high precipitation records broken or tied in July, with records set across the entire region.
Drought
About 83 percent of the Midwest was abnormally dry or in drought in late July. Drought conditions improved throughout the month along and east of a line from southeast Missouri to Michigan. Heavy rainfall resulted in a rare 2-category improvement on the US Drought Monitor map from July 11 to July 18 across northern Illinois, southern Michigan, western Indiana, and eastern Missouri. Drought persisted or intensified across Minnesota, Wisconsin, and northern Missouri. By month’s end, 71 percent of pasture and rangeland and 44 percent of corn crops were rated poor to very poor in Missouri. Topsoil moisture was short to very short on 61-76 percent of cropland west of the Mississippi River.
Notable Weather
Several notable weather events occurred in the Midwest this month:
- Air Quality: Ongoing Canadian wildfires continued to periodically affect the Midwest throughout July. The Air Quality Index exceeded 150 (i.e. unhealthy levels) for millions across Iowa, Illinois, Indiana, Kentucky, and Ohio on July 16th and 17th. Conditions again reached unhealthy levels across the region on July 25.
- Illinois Severe Weather: Multiple rounds of severe weather resulted in an unusually high number of heavy rain events, damaging wind events, and tornadoes in Illinois. The Storm Prediction Center recorded 23 preliminary tornado reports, which is the highest count dating back to 2000 and well above the 2000-2021 median of 3 for July. Flash flooding affected the Chicago area on July 2 when a slow-moving storm system dropped 3-8 inches (76.2-203.2 mm) of rain. City officials had to reverse the flow of the Chicago River to reduce coastal flooding on Lake Michigan. Other notable events occurred on July 12, 14, 19, 27, and 28.
- Flash Flooding July 19-20: Extreme one-day rainfall totals were measured across a broad swath of southeast Missouri, southern Illinois, and western Kentucky on July 19th and 20th, triggering flash flooding, water rescues, and infrastructure damage. Rainfall totals ranged from 5-10 inches (127-254 mm), with most falling in less than 12 hours. Mayfield, Kentucky measured 8.13 inches (206.5 mm) at the COOP weather station on July 19, while a nearby Kentucky Mesonet station in Graves County recorded a 24-hour total of 11.28 inches (286.5 mm). This rainfall total exceeded the current statewide 24-hour precipitation record of 10.48 inches (266.2 mm) set in 1997, but a formal investigation would be required before a new record could be named.
For further details on the weather and climate events in the Midwest, see the weekly and monthly reports at the Midwest Climate Watch page.
Southeast (Information provided by the Southeast Regional Climate Center)
Temperature
Mean temperatures were above average across much of the Southeast region in July. The greatest departures were found across northern Virginia, southern portions of Alabama and Georgia, northeast Florida, and the West Coast of Florida, where temperatures were 3 to 4 degrees F (1.6 to 2.2 degrees C) above average for the month. Several locations recorded their warmest month on record, including Key West, FL (1872-2023), Fort Myers, FL (1892-2023), Miami, FL (1895-2023), Tampa, FL (1890-2023), Sarasota, FL (1911-2023), Punta Gorda, FL (1914-2023), and Brunswick, GA (1948-2023). Alma, GA (1948-2023) recorded its warmest July on record, while Pensacola, FL (1879-2023) and Vero Beach, FL (1942-2023) tied their warmest July on record. Several other locations observed or tied their second warmest (i.e., Daytona Beach, FL, Coloso, PR), third warmest (i.e., Jacksonville, FL, Orlando, FL), fourth warmest (i.e. Tallahassee, FL, Charleston, SC, Raleigh-Durham, NC, Washington-Dulles), and fifth warmest (i.e., San Juan, PR, Charlotte Amalie, Saint Thomas) July on record. The heat and humidity were particularly noteworthy across Florida as well as coastal sections of Georgia and South Carolina. Clermont, FL (1948-2023), located west of Orlando, recorded its highest maximum temperature on record of 102 degrees F (38.9 degrees C) on the 4th of the month. The following day, Plant City, FL (1892-2023), located east of Tampa, tied its highest maximum temperature on record of 104 degrees F (40 degrees C). The heat index reached 110 degrees F (43.3 degrees C) in Miami, FL on consecutive days (the 9th and 10th) for the first time in a record going back to 1948. Key West, FL tied its highest minimum temperature on record of 87 degrees F (30.6 degrees C) on the 12th and 18th. On the 17th of the month, Miami, FL ended a streak of 16 consecutive days with a heat index of at least 105 degrees F (40.6 degrees C), which broke the old record of eight consecutive days set back in 2017. Excessive heat was also observed around Charleston, SC on the 20th of the month, with heat index values exceeding 110 degrees F (43.3 degrees C) in places. The following day, Brunswick, GA recorded a temperature of 102 degrees F (38.9 degrees C), which is just two degrees shy of its warmest temperature on record. On the 22nd, Miami, FL recorded a heat index of 111 degrees F (43.9 degrees C), which is the fourth highest value on record (since 1948). The following day, Miami, FL tied its highest mean daily temperature on record of 90 degrees F (32.2 degrees C). On the 26th, Miami, FL ended a streak of 46 consecutive days with a heat index of at least 100 degrees F (37.8 degrees C), which broke the old record of 32 consecutive days set back in 2020. Most other locations in the region were slightly above average for the month, with pockets of slightly below average temperatures scattered across the middle portion of the region. Mean temperatures were above average across Puerto Rico and the U.S. Virgin Islands.
Precipitation
As is often the case during the summer, precipitation was variable across the Southeast in July. The wettest locations were found across much of Alabama, Virginia, and eastern portions of Florida, Georgia, and the Carolinas, where monthly precipitation was 2 to 4 inches (51 to 102 mm) above average (about 150 percent of normal), while a few locations were more than 5 inches (127 mm) above average (at least 200 percent of normal). Lynchburg, VA (1893-2023) recorded its wettest July on record with 10.39 inches (264 mm) of precipitation. It also recorded its second greatest one-day total for July with 4.29 inches (109 mm) on the 11th. Of this, 2.23 inches (57 mm) fell in one hour, which ranks as the fifth greatest one-hour total on record since 1947. Melbourne, FL (1937-2023) recorded its second wettest July on record with 11.79 inches (299 mm), while Vero Beach, FL (1942-2023) recorded its fourth wettest July on record with 11.95 inches (304 mm). Lisbon, FL (1958-2023), located near Orlando, recorded its greatest one-day total for July with 4.5 inches (114 mm). Fort Lauderdale (1912-2023) also recorded its greatest one-day total for July with 6.19 inches (157 mm) on the 27th. In contrast, the driest locations were found across central portions of Georgia and the Carolinas as well as the West Coast of Florida, where monthly precipitation ranged from 2 to 5 inches (51 to 127 mm) below average (33 to 75 percent of normal), with a few locations recording less than a quarter of their normal monthly amount. Sarasota, FL (1911-2023) recorded its second driest July on record with 1.1 inches (28 mm) of precipitation, which is only 12 percent of normal. Monthly precipitation was also below average across much of Puerto Rico and the U.S. Virgin Islands. Cyril King Airport on the island of Saint Thomas tied its fifth driest July on record (since 1953) with just 0.81 inches (21 mm) of precipitation, while Henry Rohlsen Airport on Saint Croix recorded 1.26 inches of precipitation (32 mm), which is a little less than half of normal.
Drought
The greatest improvements in the Drought Monitor were observed across northern Alabama and northern and central portions of Virginia, where only small areas of moderate (D1) drought remained by the end of the month. Small pockets of abnormal dryness (D0) were also eliminated across the state of Georgia. On the other hand, moderate (D1) drought emerged across extreme southwestern Virginia, while small pockets of abnormal dryness (D0) emerged across the Carolinas. Hot and dry conditions during the month resulted in a two-category degradation along the West Coast of Florida, with severe (D2) and extreme (D3) drought emerging in Pinellas and Hillsborough counties. Overall, by the end of the month, only about 6 percent of the region was at least abnormally dry, which is the lowest percentage since September 2021. In the Caribbean, severe (D2) drought expanded across northwest Puerto Rico. Abnormal dryness (D0) persisted across the southern and northern slopes but contracted over the eastern part of the island. Severe (D2) drought emerged on Saint John, while extreme (D3) drought emerged on Saint Thomas. Conditions on Saint Croix improved from exceptional (D4) to extreme (D3) drought by the end of the month.
Agriculture
After a slow start to the year, many crops were making strong progress across much of the region. Vegetable crops and early-planted corn were being harvested, and many operators were conducting second cuttings of hay. Precipitation was generally beneficial as it helped increase or maintain adequate soil moisture levels. However, above average precipitation and high temperatures did limit some field work and placed stress on some crops. Flooded fields prevented weed control and fungicide applications, which could lead to yield losses. Cattle and livestock were in fair to good condition across most of the region. Operators prioritized access to shade and water due to the heat and humidity. Pastures were also in generally good condition. Warm weather grasses benefited from the high temperatures, while fescue fields were showing signs of heat stress.
Notable Weather
There were 1,214 reports of severe weather across the Southeast in July, which is nearly double the median frequency of 616 reports over the period 2000 to 2022 (197 percent of normal). There were seven confirmed tornadoes (3 EF-0s, 3 EF-1s, 1 EF-3), which is below the median frequency of 10 (70 percent of normal). The strongest tornado was an EF-3 that tracked for about 16 miles (26 km) across Nash and Edgecombe counties in eastern North Carolina around mid-day on the 19th of the month. The tornado destroyed several manufactured homes in the community of Dortches and bent and snapped about two dozen power poles. Other homes sustained major structural damage, including the collapse of exterior walls. The tornado produced significant damage to a large Pfizer manufacturing plant, which supplies about 25 percent of all sterile injectable medications used by hospitals nationwide. A few semi-trucks were flipped and destroyed in a nearby parking lot. At least 16 injuries were reported. This marks the first EF-3 tornado recorded in North Carolina in the month of July and only the third tornado of EF-3 and greater strength recorded in the state during meteorological summer (since 1950). On the 16th of the month, an EF-1 tornado touched down in the town of Aguada in northwest Puerto Rico. Numerous trees were snapped and uprooted and a few homes sustained damage to the roof and siding. The tornado eventually transitioned into a waterspout and resulted in no injuries or fatalities. There were 1,157 wind reports in July, which is more than double the median frequency of 554 reports (209 percent of normal). On the 1st, thunderstorm gusts between 70 and 85 mph (31 and 38 m/s) were observed across Limestone County in northern Alabama. Straight-line winds between 70 and 90 mph (31 and 40 m/s) produced considerable damage across Martin County in eastern North Carolina on the afternoon of the 3rd. The worst damage occurred from a microburst that struck the community of Smithwick. On the 13th, West Palm Beach, FL recorded a 67 mph (30 m/s) wind gust, making it the highest gust on record for July (since 1943). A large thunderstorm complex caused significant wind damage across parts of northern Georgia and South Carolina on the 20th of the month. A few weak tornadoes were also confirmed. Based on damage surveys, peak wind gusts were estimated between 85 and 95 mph (38 and 42 m/s), mostly in the vicinity of the J. Strom Thurmond reservoir located along the Georgia-South Carolina border. State parks on both sides of the lake reported hundreds of downed trees, some of which fell on camping vehicles. On the 23rd of the month, a supercell thunderstorm produced multiple damaging downbursts across Chesterfield County in central South Carolina with peak gusts between 70 and 95 mph (31 and 42 m/s). On the 26th, Fort Myers, FL recorded a 68 mph (30 m/s) wind gust, making it the highest gust on record for July (since 1943). There were 45 hail reports in July, which is below the median frequency of 52 reports (87 percent of normal). The largest observed hailstone was 2 inches (51 mm) in the town of Old Fort in western North Carolina. On the 13th of the month, heavy precipitation resulted in flash flooding in the town of Livingston in west-central Alabama. A mesonet located at the University of West Alabama recorded a rainfall rate of 3 inches (76 mm) per hour. Several cars were swept away and multiple water rescues were required. On the 17th, heavy precipitation resulted in flash flooding across parts of Alexander County in central North Carolina. One person drowned and a second person was found hanging from a tree after their car was swept away in the flood waters near the community of Ellendale. There were six rip current fatalities in the Southeast in July (four in Florida, one in North Carolina, and one in Puerto Rico).
2023 Atlantic Hurricane Season
Only one tropical cyclone, Hurricane Don, formed in the Atlantic basin in July but did not impact land. Based on preliminary data, Don is the fifth longest-lasting system on record for the month (including its time as a subtropical storm). Seasonally, the amount of accumulated cyclone energy is about 68 percent above average (from 1991-2020), while the number of named storms in the basin is running several weeks ahead of schedule.
For more information, please visit the Southeast Regional Climate Center Home Page.
High Plains (Information provided by the High Plains Regional Climate Center)
July was a mixed bag of weather for the High Plains. Precipitation was greatly needed for some, while others received next to nothing. Cooler temperatures dominated much of the region, despite a heatwave late in the month. Wheat harvest in Kansas began at the beginning of June, with most of it harvested by the fourth of July. Around this time, however, storms pushed through the state nearly every other day which caused numerous delays. Weeds became a significant issue, and the quality of the wheat began to decline. Some places, such as Morton County, didn’t have the first loads of wheat to the Co-op until early July. The same county also reported 70 to 75 percent of planted acres and were zeroed out by crop insurance due to the ongoing multi-year drought. The average yield for the state is expected to be historically low, with an average of 32 bushels an acre. Corn and soybeans are in decent shape throughout the region, with a large portion of crops in fair to good shape. Pasture and range conditions are improving, with only small numbers in very poor shape. Conditions could see further improvement in August, with the majority of agricultural production areas having a chance of above-normal precipitation.
Temperature
Temperatures were cooler for many places, however, an oppressive heatwave occurred towards the end of the month with temperatures well above 100 degrees F (37.8 degrees C). Western Colorado experienced well above-normal temperatures throughout the month, with the heatwave only adding fuel to the fire. Alamosa tied with 2003 for the 2nd warmest and narrowly missed the record, with an average temperature of 68.2 degrees F (20.1 degrees C). Grand Junction also ranked 2nd warmest, with an average temperature of 83.3 degrees F (28.5 degrees C). The average high temperature for Grand Junction was 99.3 degrees F (37.4 degrees C) for July, which is the 2nd warmest month on record. The heatwave that impacted the region late in the month not only brought scorching temperatures but also set some notable records. On the 17th, Grand Junction tied with July 9th, 2021 for the highest all-time temperature of 107 degrees F (41.7 degrees C). Lawrence, Kansas recorded its highest July low temperature 84 degrees F (28.9 degrees C) on the 27th. It was also the 4th highest low temperature of all time.
Precipitation
Aside from scattered pockets of above-normal precipitation, the region was fairly dry this month. Western Colorado and the majority of North Dakota were well below normal, with places of near-record dryness. While eastern Colorado has received normal to above normal precipitation these past few months, the western part of the state has not been so lucky. Grand Junction tied with 1898 for the driest on record, while Alamosa was the driest. Next to zero precipitation occurred in both places this month and combined with the recent heat, drought conditions have begun to be reintroduced in the southwestern part of the state. Among those who missed the rain this month include McCook, Nebraska, and the surrounding area. Just a few months ago, they recorded their wettest month ever by a large margin and greatly improved the ongoing drought. This month was a setback, as only 0.50 inches (12.7 mm) precipitation occurred, and it was ranked 5th driest. At the end of June, they ranked 10th wettest for January through June period. Currently, they rank 25th after a meager July precipitation. For the portions of the region that did receive precipitation, the majority of it was related to severe weather. Kansas, Colorado, and Nebraska recorded their highest number of severe thunderstorm warnings issued (period of record 2002 to present). Over 350 were issued in each state, with Colorado also recording their most tornado warnings as well. On the 20th, a whopping 115 mph (185 km/h) gust was recorded outside of Wallace, Kansas. A building was completely destroyed by the winds, while other locations were pummeled by the combination of the wind and up to 2.5 inch (6.35 cm) hail.
Drought
Drought conditions improved this month, particularly in Kansas and Nebraska. However, North Dakota and southwestern Colorado were extremely dry, resulting in drought conditions rapidly intensifying. Overall, abnormally dry to exceptional drought (D0-D4) was reduced by a little over 2 percent in the region. The drought that has plagued Kansas and Nebraska has seen steady improvement this summer. Above-normal precipitation across eastern Nebraska reduced D4 in the state by nearly 11 percent this month. On the opposite end of the spectrum, southwestern Colorado was near bone dry and observed a 25 percent increase in D0-D4. North Dakota also experienced a rapid increase in moderate to exceptional drought (D1-D4).
For more information, please visit the High Plains Regional Climate Center Home Page.
South (Information provided by the Southern Regional Climate Center)
A persistent heat wave in Texas and Louisiana led to several fatalities and a high number of emergency room visits in July.
Temperature
Above normal temperatures were prevalent in the southern portions of the region, with areas from far west Texas to the Gulf Coast of Mississippi ranging from two to six degrees above normal. In the northern portions of the region, near normal temperatures were common, generally between two degrees below and two degrees above normal. Statewide averages for July were above normal for Louisiana (2nd warmest, out of 129 years), Texas (4th warmest), the Southern Region as a whole (9th warmest), Mississippi (13th warmest), and Arkansas (45th warmest). Oklahoma and Tennessee were near their respective historical median values. The warmest recorded temperature in the region was 115 F at Rio Grande Village, Texas on July 13th and 14th. The coldest observed temperature in the region was 39 F at Mt. Leconte, Tennessee on July 13th. The coldest recorded lowland temperature was 48 F at Lawrenceburg, Tennessee on July 10th. Three long-term stations set records for highest July maximum temperature: Kingsville NAAS, Texas (108 F on July 16th), New Iberia, Louisiana (104 on July 31st), and Leesville, Louisiana (108 F on July 31st). No stations set records for lowest minimum temperatures during July. Twelve long-term stations set records for highest minimum temperature in July, the warmest being 87 F at Wink FAA Airport, Texas on July 24th.
Precipitation
Precipitation was below normal for the southern portions of the region during July, with the largest departures across central and western Texas. Precipitation was generally above normal for the northern portions of the region, with some locations in western Oklahoma and the Texas Panhandle exceeding 300 percent of normal precipitation. State totals were above normal for Oklahoma (7th wettest), Arkansas (21st wettest), Tennessee (31st wettest), and Mississippi (50th wettest). Statewide totals were below normal for Louisiana (17th driest) and Texas (23rd driest). Between the two extremes in regional totals, the Southern Region as a whole was near its historical median value for precipitation. Six stations exceeded twelve inches of precipitation for the month of July, spread across three states, and consisted of one WBAN, four CoCoRaHS, and one COOP site: Scooba 0.2 SSW, Mississippi (15.14 inches), Scooba 1.2 ESE (15.01 inches), near Decatur, Tennessee (12.77 inches) Monticello Airport, Arkansas (12.53 inches), near Moss Point, Mississippi (12.31 inches), and near Starkville, Mississippi (12.06 inches). A total of 58 stations, all in Texas, recorded no precipitation during the month of July. Two stations, both in Arkansas had single-day accumulations exceeding 6 inches: near Buckner (8.45 inches, July 12th) and Lewisville (8.45 inches on July 12th). Two long-term stations set single day accumulation records for July: Fayetteville Drake Field, Arkansas (3.33 inches, July 14th) and Mountain City 2, Tennessee (3.62 inches, July 16th).
Drought/Flooding
During July the Southern Region saw improvement of drought conditions across the Texas Panhandle, much of Oklahoma, northern Arkansas, northern Mississippi, and much of Tennessee. Some regions of Oklahoma saw as many as three classes of improvement according to the US Drought Monitor. In the southern portions of the Region degradation of drought status was common, particularly in far west Texas and central Texas where some areas saw as much as three categories of degradation. Areas experiencing extreme or exceptional drought remained confined to central Texas and north-central Oklahoma. Much of the Texas Panhandle, northeastern Texas, Oklahoma, Arkansas, Tennessee, Mississippi, and northern Louisiana remained free of drought as of July 25th. Drought conditions, combined with little rain, and hot temperatures have led to short to very short topsoil conditions across much of Texas and have negatively impacted the state’s cotton crop, with only 17 percent of Texas cotton being reported to be in good to excellent condition as of July 30th. In contrast to dry conditions across Louisiana and Texas, heavy rain events throughout the month led to reports of flash flooding events in Oklahoma, Arkansas, Mississippi, and Tennessee.
Notable Weather
One of the big stories for July in the Southern Region was the continued heat wave that impacted much of the southern portions of the Region beginning in June. The extreme heat in the region has particularly impacted Texas, where 123 stations in the state reported 3 weeks or more of 100+F days during July. Rio Grande Village was 100 F or greater on all 31 days in July. Louisiana has also been experiencing extreme heat, with 28 stations recording more than 3 weeks of 95 F or greater high temperatures. In eastern Texas and Louisiana, these high temperatures have often been accompanied by high humidity. This combination of extremes has led to several deaths across the region and more will likely be attributed to the heat as time goes on. In the last two weeks, a CDC region that includes Texas and the states that border it set three new daily records for the number of heat-related emergency department visits since 2017, the first year for which data is available, according to the CDC. July saw less severe weather than previous months in 2023. Three tornadoes were reported across the Southern Region in July, impacting two states in the Southern Region: Arkansas (2 tornadoes) and Texas (1 tornado). All three were rated as EF-1. Minor structural damage was reported from the EF1 tornado in Sebastian, Arkansas on July 14th. There were no injuries or fatalities associated with tornadoes in the Southern Region during July. There were 45 reports of hail during July in the Southern Region, the largest being 2.75 inch hail in Texline, Texas on July 14th. There were 614 severe wind reports in the Southern Region during July, the fastest being 95 mph near Lipscomb, Texas on July 8th.
For more information, please visit the Southern Regional Climate Center Home Page.
West (Information provided by the Western Region Climate Center)
July brought prolonged periods of extreme heat to the Southwest with record warmth at many locations. This was partially due to the delayed onset of the Southwest monsoon as the semi-permanent summer sub-tropical high-pressure center was shifted further south than normal with little moisture making it into the core of the monsoon region: Arizona and New Mexico. Outside of the southwest temperatures were above normal and precipitation below normal across much of the West.
Temperature
The lack of monsoon rains across the Southwest brought decreased cloud cover, lower humidities, a drier and hotter land surface, and extreme heat with record high mean monthly temperatures over large areas of Arizona and New Mexico. Parts of California and Nevada also saw record temperatures. Phoenix, Arizona shattered the previous July temperature record of 98.9 degrees Fahrenheit set in 2020 with a new record of 102.7 degrees Fahrenheit (7.2 degrees Fahrenheit above normal) based on observations dating back to 1933. Other notable record high July average temperatures include Las Vegas, Nevada at 97.3 degrees Fahrenheit (4.1 degrees Fahrenheit above normal), Needles, California at 101.8 degrees Fahrenheit (3.3 degrees Fahrenheit above normal), and Santa Rosa, California at 70.6 degrees Fahrenheit (3.7 degrees Fahrenheit above normal). With the exception of central and eastern Montana the rest of the West also saw a hot July with temperatures 2-4 degrees Fahrenheit above normal.
Precipitation
July is typically one of the wettest months of the year in Arizona and New Mexico due to the onset of the monsoon but little precipitation, and in some cases no measurable precipitation, fell this year. For the first time since records began in 1892, there was no measurable precipitation in Albuquerque, New Mexico where normal July precipitation is 1.64 inches; several days with trace amounts of precipitation did occur. Southwest New Mexico was also extremely dry with Hillsboro (0.03 inches and 1 percent of normal) and Redrock (0.35 inches and 13 percent of normal) also saw record low July precipitation totals. Flagstaff, Arizona logged just 0.71 inches of precipitation (27 percent of normal) coming in as the ninth driest July on record. Most of California and Oregon saw no precipitation in July and precipitation was below normal across the entire Pacific Northwest with many locations seeing 0-50 percent of normal.
Drought
According to the U.S. Drought Monitor at the end of July, 21 percent of the West was in drought. Drought conditions have worsened over Arizona, New Mexico, southwest Colorado, and southeast Utah due to a lackluster start to the monsoon season with little precipitation in July. Several areas of severe drought (D2) can be found in New Mexico. Drought also expanded across the Pacific Northwest with D2 condition in Oregon, Washington, Idaho, and Montana.
Alaska Summary
Temperatures across Alaska were above normal except for areas of the southwest part of the state, where temperatures were 1-2 degrees Fahrenheit below normal. Record July warmth was found in the middle and upper Yukon Basins where temperatures were generally 3-6 degrees Fahrenheit above normal. Notable records include Big Delta at 65.3 degrees Fahrenheit (4.6 degrees Fahrenheit above normal) and Northway at 65.5 degrees Fahrenheit (5.6 degrees Fahrenheit above normal). Utqiagvik, on the North Slope, saw a monthly mean temperature of 48.4 degrees Fahrenheit (6.7 degrees Fahrenheit above normal) and set a July record. Precipitation was above normal for much of south-central, western, and the North Slope of Alaska with below normal precipitation for the Interior and Panhandle. Homer saw its wettest July since records began in 1933 with a monthly total of 4.25 inches (293 percent of normal) and Anchorage had its sixth wettest July with 4.08 inches (224 percent of normal). On the Panhandle Yakutat had a record dry July with 1.14 inches of precipitation (15 percent of normal) and Juneau saw its fourth driest July with 1.79 inches of precipitation (35 percent of normal).
Hawaii Summary
Across Hawaii precipitation was below normal and temperatures were near-to-above normal. Hana had its driest July since records began in 1951 with 2.34 inches of precipitation (43 percent of normal). On the Big Island, Hilo received 4.97 inches of precipitation (54 percent of normal) in July, making it the tenth driest on record. Temperature-wise, Lihue had its warmest July on record at 81.9 degrees Fahrenheit (2.3 degrees Fahrenheit above normal) and Molokai had its sixth warmest July at 79.4 degrees Fahrenheit (0.3 degrees Fahrenheit above normal). Maui is currently the only island with drought conditions present where much of the island is in moderate drought (D1) with a small area on the western shores in severe drought (D2).
Notable Weather
Extreme heat in Arizona: July shattered many heat records in Phoenix, Arizona with 17 days having a maximum temperature above 115 degrees Fahrenheit being one notable record (previous record was six days in 2020). Overnight temperatures were also extremely warm leading to major human health impacts. Data from the Arizona Department of Health Services shows 712 visits to Arizona emergency rooms during the week of July 16 for heat-related illness with 140 heat-related deaths (many still under investigation) in Maricopa County alone.
For more information, please go to the Western Regional Climate Center Home Page.