National Overview

May Highlights
May Temperature

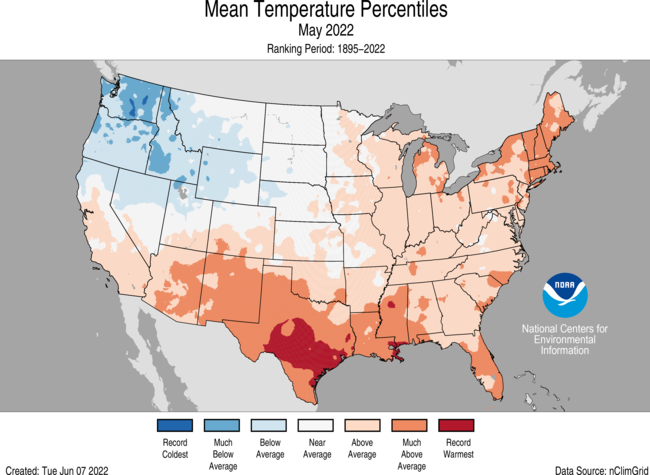
- The average contiguous U.S. temperature during May was 61.9°F, 1.7°F above the 20th century average, ranking in the warmest third of the 128-year period of record.
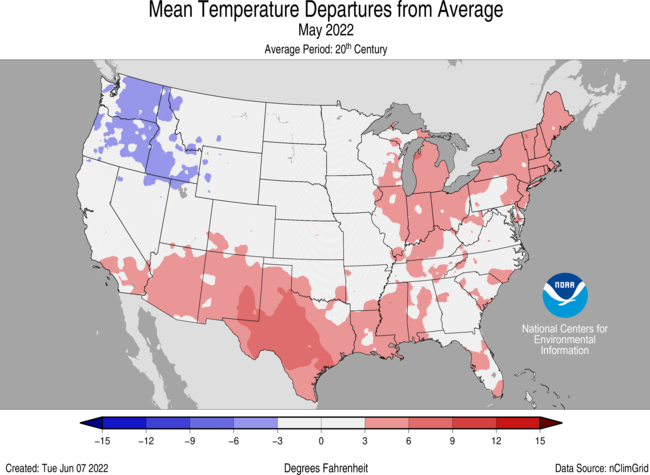
- For May, a persistent trough of low pressure over the Pacific Northwest contributed to Washington state ranking eighth coldest on record while the downstream ridge brought unseasonable warmth to the Deep South, resulting in Texas ranking second warmest.
- Temperatures across the Northwest and northern Rockies were below average, with much of the Southwest, Deep South and locations east of the Mississippi River above average. Triple-digit heat scorched portions of the South throughout the month, setting a number of temperature records across Texas.
- Amarillo set a record on May 7 for the earliest 100°F day in the calendar year (prior record was May 15).
- Abilene had 14 100°F days in May, shattering the previous record of 7 days set in 1927 and 2000.
- Portions of south Texas reached 105°F on May 17 with temperatures from Nebraska to Texas ranging as much as 25°F above average.
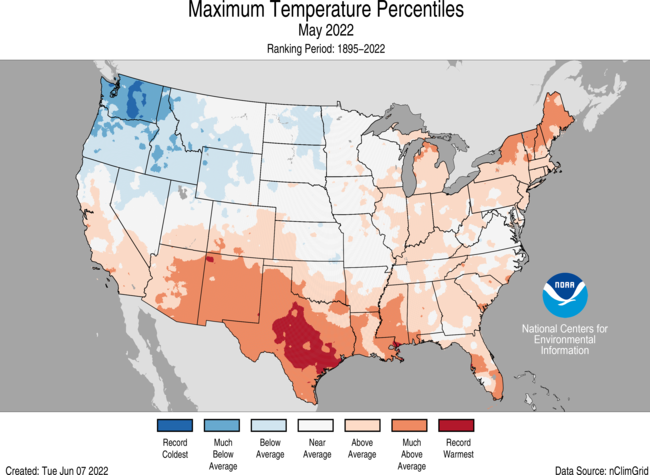
- The contiguous U.S. average maximum (daytime) temperature during May was 74.4°F, 1.4°F above the 20th century average, ranking in the warmest one-third of the record. Above-average maximum temperatures were observed across the Southwest and Deep South as well as parts of the Southeast, Great Lakes and Northeast. Texas tied with 1998 for warmest daytime temperatures on record during May. Below-average daytime temperatures occurred across the Northwest and portions of the northern Plains. Washington ranked second coldest on record for daytime temperatures in May.
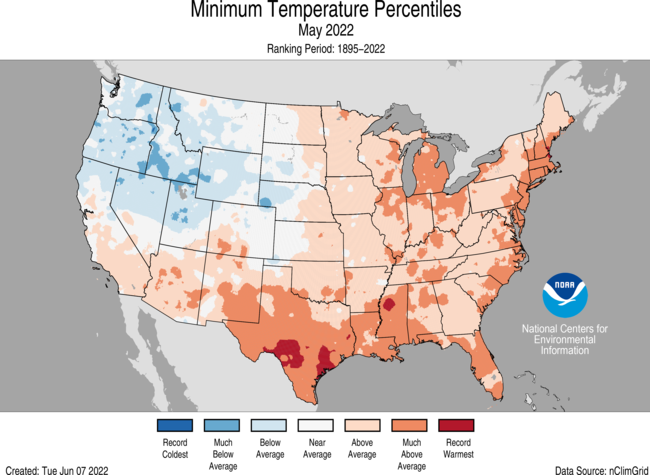
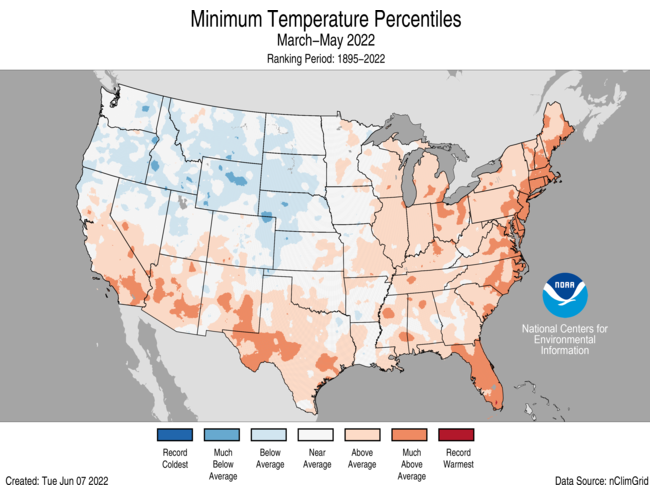
- The contiguous U.S. average minimum (nighttime) temperature during May was 49.4°F, 2.0°F above the 20th century average, ranking in the warmest one-third of the record. Above-average minimum temperatures were observed across portions of the Southwest, Deep South and the eastern half of the contiguous U.S. Massachusetts and Rhode Island ranked second warmest for nighttime temperatures during May while an additional 9 states across the South, Southeast, Great Lakes and Northeast had one of their warmest 10 Mays on record. Nighttime temperatures were below average across the Northwest, portions of the Great Basin and northern Rockies.
- The Alaska average May temperature was 39.9°F, 2.1°F above the long-term mean, ranking in the warmest third of the record for the state. Temperatures were above average across much of southern mainland Alaska as well as the northern Panhandle and parts of the North Slope. Temperatures were near average across much of the rest of the state.
- Based on data records as of June 6, there were 6,543 record warm daily high (3,022) and low (3,521) temperature records during May, which is just more than 1.5 times the 4,237 record cold daily high (2,396) and low (1,841) temperature records.
- Based on NOAA's Residential Energy Demand Temperature Index (REDTI), the contiguous U.S. temperature-related energy demand during May was 5 percent above average and the 55th-highest value in the 128-year period of record.
May Precipitation
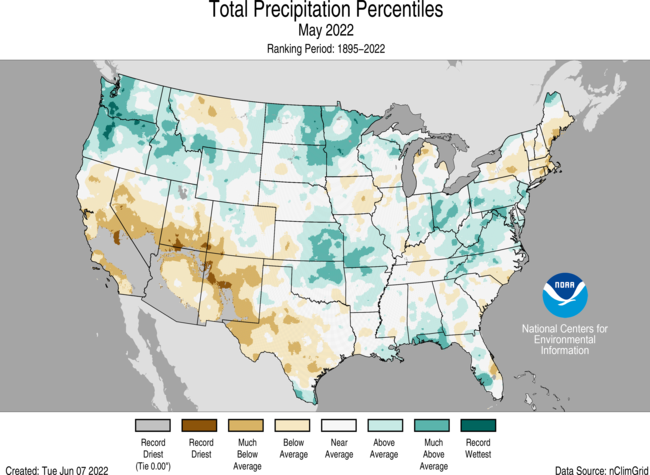
- The May precipitation total for the contiguous U.S. was 3.17 inches, 0.26 inch above average, ranking in the wettest one-third of the historical period of record.
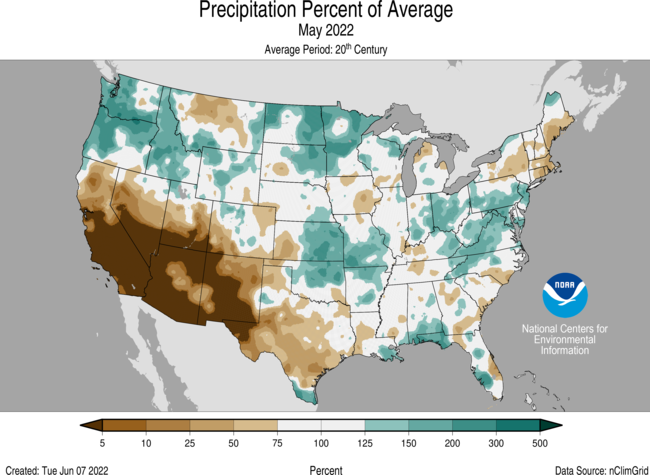
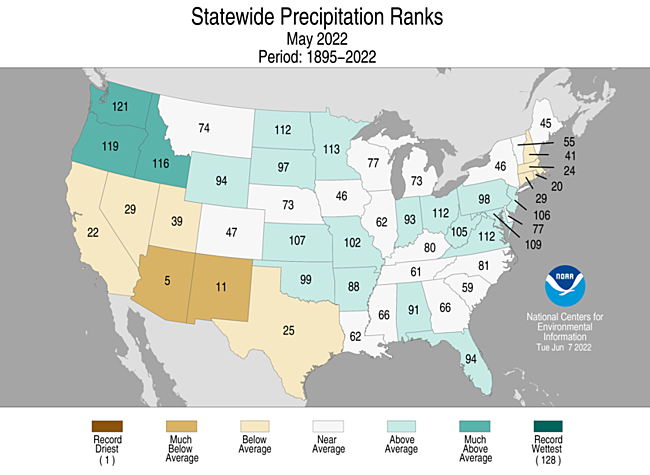
- A ridge of high pressure suppressed precipitation across the Southwest in May and resulted in Arizona ranking fifth driest for the month. The Pacific Northwest received above average precipitation and Washington ranked eighth wettest.
- In general, precipitation was above average across portions of the Northwest, northern and central Plains, Upper Mississippi Valley, Ohio Valley, eastern Gulf of Mexico coast and the Appalachians. Precipitation was below average from California to Texas and across portions of the Northeast.
- Precipitation across Alaska ranked fourth driest for May. Precipitation was above average across parts of the North Slope and eastern interior regions, but was generally very dry across much of the state.
- According to the May 31 U.S. Drought Monitor report, 49.3 percent of the contiguous U.S. was in drought, down about 4.5 percentage points from the beginning of May. Drought intensified and/or expanded across the Southwest, West, and parts of the Northeast. Exceptional drought expanded in southern Nevada, southern California, and in areas of the South, primarily along the Texas-New Mexico border. Areas of the Pacific Northwest, northern Rocky Mountains and High Plains saw drought conditions improve over the month of May. Moderate drought was introduced to portions of south-central Alaska, drought expanded across Puerto Rico and the extent of drought across Hawaii lessened during May.
Other Notable Events
- As of May 31, the largest fire on record in New Mexico, the Hermits Peak Fire, had consumed more than 315,000 acres and was 50 percent contained. Across all 50 states, 1.9 million acres have burned from January 1 through June 2 — more than two times the average for this time of year.
- Several severe weather events occurred across the U.S. during May, producing 196 preliminary tornado reports. This is 71 percent of the 1991-2010 average of 276 tornadoes for the month of May.
- Severe storms formed across the central Plains on May 4, producing several tornadoes including an EF3 near Lockett, TX.
- A line of severe storms, also known as a derecho, barreled across the central Plains into the Upper Midwest on May 12, causing extensive damage from at least 13 tornadoes and straight-line winds.
- The Upper Midwest was again impacted by severe weather over Memorial Day weekend, where more than 20 tornadoes were reported, including an EF2 in Forada, MN and an EF3 in Altamont, SD.
Spring Highlights

March-May Temperature
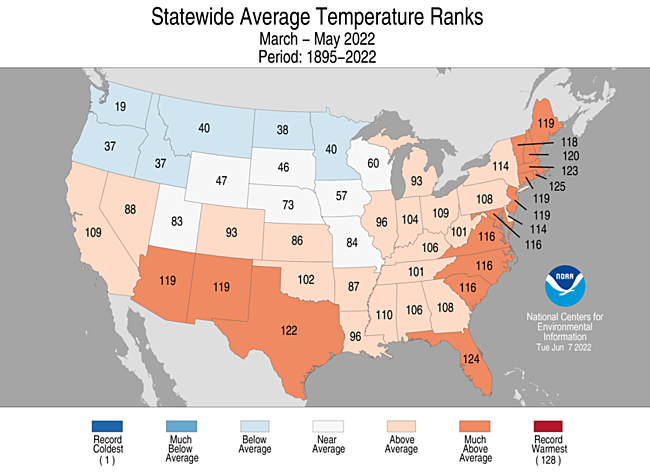
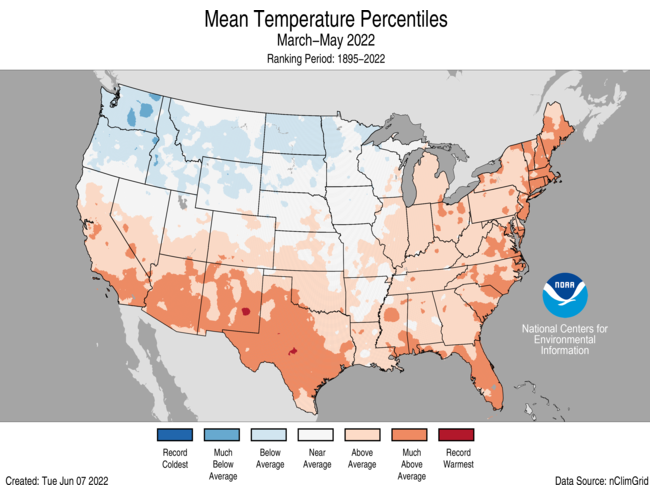
- The spring (March-May) average contiguous U.S. temperature was 52.2°F, 1.3°F above average, ranking in the warmest third of the record.
- Temperatures were above average from California to the Deep South and, in general, from the Mississippi River to the East Coast. Temperatures were below average from the Pacific Northwest to the Upper Midwest. Rhode Island ranked fourth warmest while nine additional states across the Northeast, Southeast and Southern Tier ranked among their warmest 10 spring seasons on record.
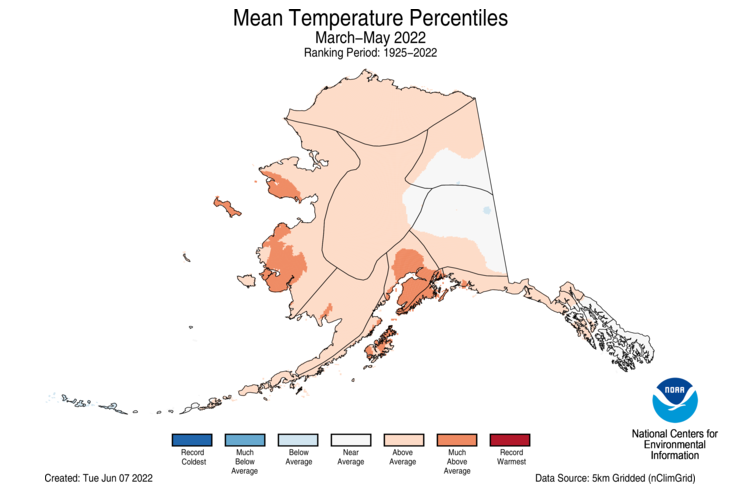
- The Alaska spring temperature was 23.7°F, 3.3°F above the long-term average, ranking in the warmest third of the record for the state. Temperatures were above average across most of the state with the eastern Interior regions and parts of the Panhandle region near average for the season.
- The contiguous U.S. average maximum (daytime) temperature during March-May was 64.8°F, 1.6°F above the 20th century average, ranking among the warmest one-third of the record. Above-average daytime temperatures were observed across much of the southern half of the contiguous U.S. as well as from the Ohio Valley to the Northeast. Temperatures were below average across portions of the Northwest and Upper Mississippi Valley.
- The contiguous U.S. average minimum (nighttime) temperature during March-May was 39.7°F, 1.0°F above the 20th century average, ranking in the warmest third of the record. Nighttime temperatures were above average across parts of the Southwest, Deep South and from the Mississippi River to the East Coast. Temperatures were below average from parts of the Northwest to the High Plains.
- Based on REDTI, the contiguous U.S. temperature-related energy demand during the spring season was 74 percent of average and was the 31st-lowest value on record.
March-May Precipitation
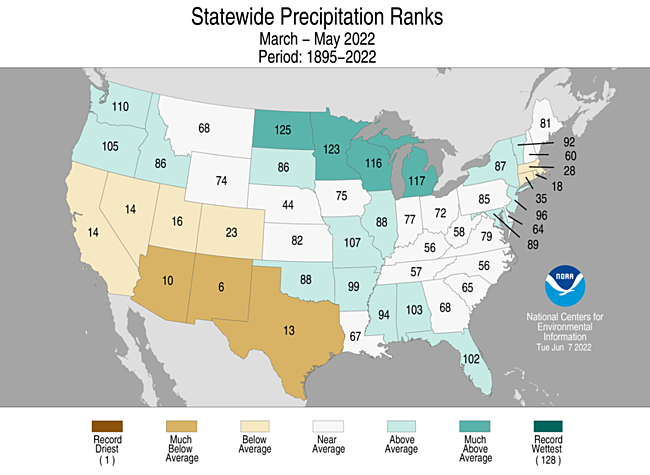
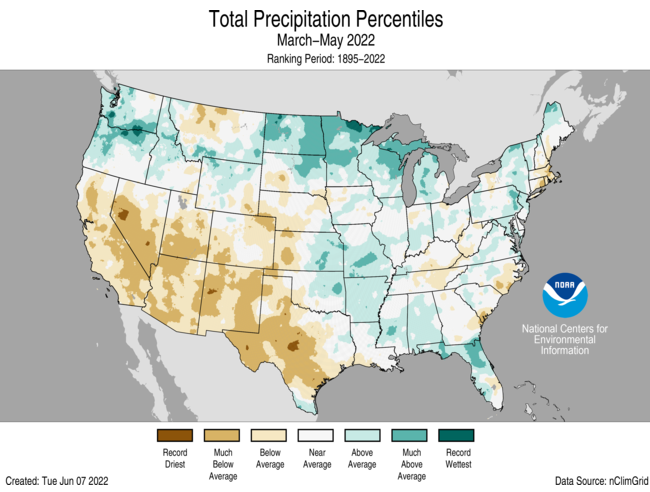
- The spring precipitation total was 8.07 inches, 0.13 inch below average, ranking in the middle one-third of the March-May record.
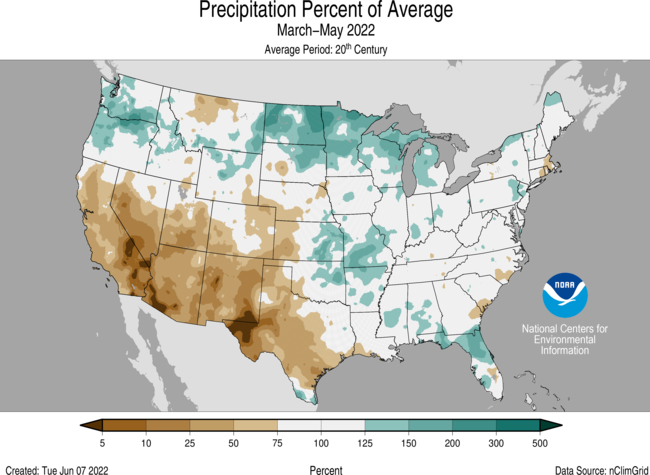
- Precipitation was above average across parts of the Northwest, northern Plains, Great Lakes, central Plains, along portions of the central and eastern Gulf Coast and across parts of the Northeast for the season. Precipitation during March-May was below average from California to the High Plains and western Gulf Coast. North Dakota ranked fourth wettest while New Mexico ranked sixth driest for the spring season.
Extremes
-
The U.S. Climate Extremes Index (USCEI) for the spring season was 14 percent above average, ranking in the upper third of the 113-year period of record. Despite the near-average national value, there were elevated extremes in warm maximum temperatures, the spatial extent of dry PDSI and the number of days with precipitation. The USCEI is an index that tracks extremes (falling in the upper or lower 10 percent of the record) in temperature, precipitation and drought across the contiguous United States.
- On the regional scale, the Southwest, South, Northeast and West regions had a CEI value that ranked in the top one-third of the historical record for the season. All of these regions experienced elevated extremes in warm maximum temperatures during the season. The Northeast also experienced elevated extremes in warm minimum temperatures, wet PDSI and the number of days with precipitation. In contrast, the Southwest, South and West had elevated extremes in dry PDSI and the number of days without precipitation for the West Region.
Year-to-Date Highlights
January-May Temperature
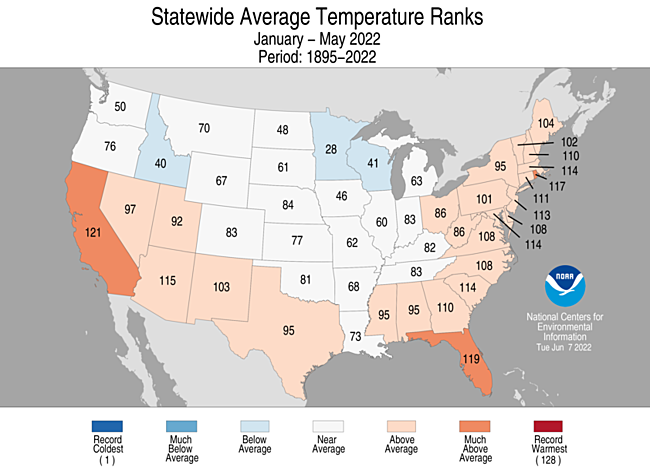
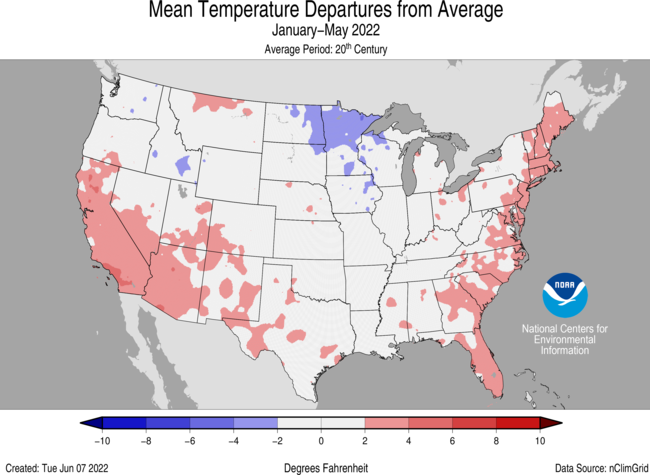
- The year-to-date (January-May) average contiguous U.S. temperature was 44.3°F, 1.0°F above average, ranking in the warmest third of the record.
- Temperatures were above average from California to Texas and from the central Gulf Coast to New England. California ranked eighth warmest on record for this period. Temperatures were below average in parts of the Northwest and from the northern Plains to parts of the Midwest.
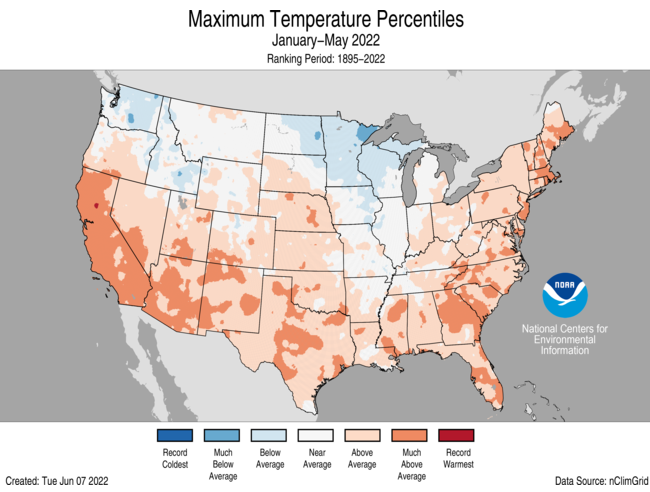
- The contiguous U.S. average maximum (daytime) temperature during January-May was 56.7°F, 1.7°F above the 20th century average, ranking in the warmest third of the historical record. Above-average daytime temperatures were observed across much of the West, central and southern Plains and from the Gulf Coast to the Northeast. Temperatures were below average across portions of the Northwest and Upper Mississippi River Valley.
- The contiguous U.S. average minimum (nighttime) temperature during January-May was 31.9°F, 0.2°F above the 20th century average, ranking in the middle one-third of the record. Nighttime Temperatures were above average across portions of the West and along the East Coast. Temperatures were below average across parts of the Rocky Mountains and from the southern Plains to the Upper Mississippi River Valley.
- The Alaska year-to-date temperature was 18.8°F, 3.0°F above average, ranking in the warmest third of the historical record. Temperatures were above average across most of the state with the eastern Interior regions and parts of the Panhandle and North Slope regions near average for the season.
- Based on REDTI, the contiguous U.S. temperature-related energy demand during January-May was 82 percent of average and was the 34th-lowest value on record.
January-May Precipitation
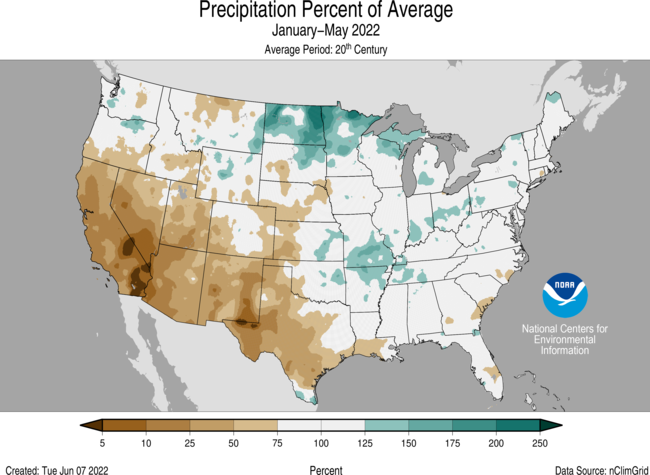
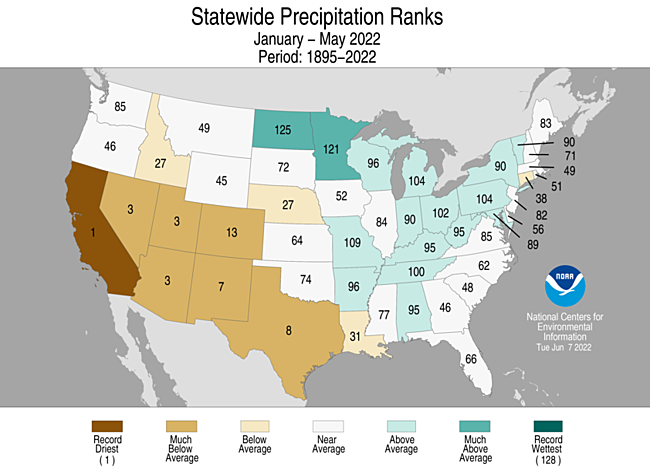
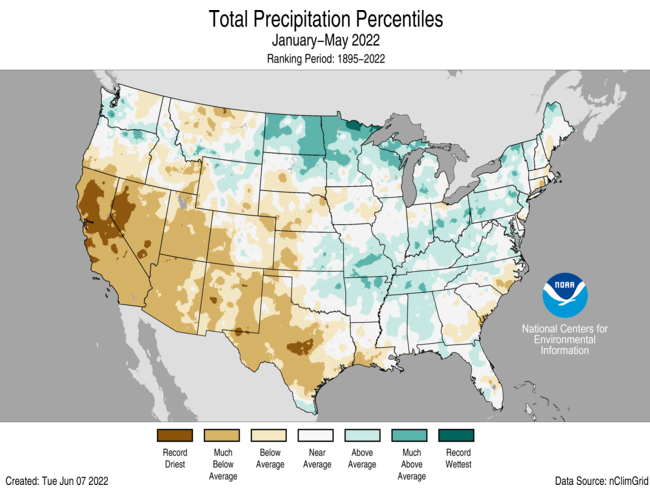
- The year-to-date national precipitation total was 11.48 inches, 0.91 inch below average, ranking in the driest third of the January-May record.
- Precipitation was above average from the northern Plains to the Great Lakes and from the mid-Mississippi Valley to the Northeast. Precipitation was below average across much of the West and Deep South, as well as portions of the central Plains, during the January-May period. California ranked driest on record while Nevada, Utah and Arizona ranked third driest for this five-month period. North Dakota ranked fourth wettest for January-May.
- Despite the dry May and Spring season across Alaska, precipitation averaged across the state for the January-May period ranked in the wettest third of the record and was generally above average across much of southeastern Alaska and near or below average for much of the rest of the state. Record precipitation received in early 2022 contributed to the Southeast Interior division ranking wettest on record for the January-May period.
Extremes
-
The U.S. Climate Extremes Index (USCEI) for the year-to-date period was 10 percent above average, ranking in the middle one-third of the 113-year period of record. Extremes in warm maximum temperatures and dry PDSI were the major contributors to this near-average CEI value. The USCEI is an index that tracks extremes (falling in the upper or lower 10 percent of the record) in temperature, precipitation and drought across the contiguous United States.
- On the regional scale, the West, Northwest, Southwest and Northern Rockies and Plains ranked in the highest third of their record for this five-month period. Elevated extremes were the result of large regions of warm maximum temperatures across the West and Southwest, extremes in 1-day precipitation and the number of days with precipitation across the Northwest and Northern Rockies and Plains as well as dry PDSI values for all four regions.
Monthly Outlook
- According to the May 31 One-Month Outlook from the Climate Prediction Center, above-normal temperatures are likely across California, the Southwest, Gulf Coast States, and along the East Coast. A relatively cool start to June favors below-normal temperatures from the Pacific Northwest east to the northern Plains. Parts of the Northwest and south Florida have the greatest chance of above-normal precipitation. Drought is likely to persist over most of the West with some improvement expected across portions of the Pacific Northwest, northern Rockies, Plains and portions of Florida.
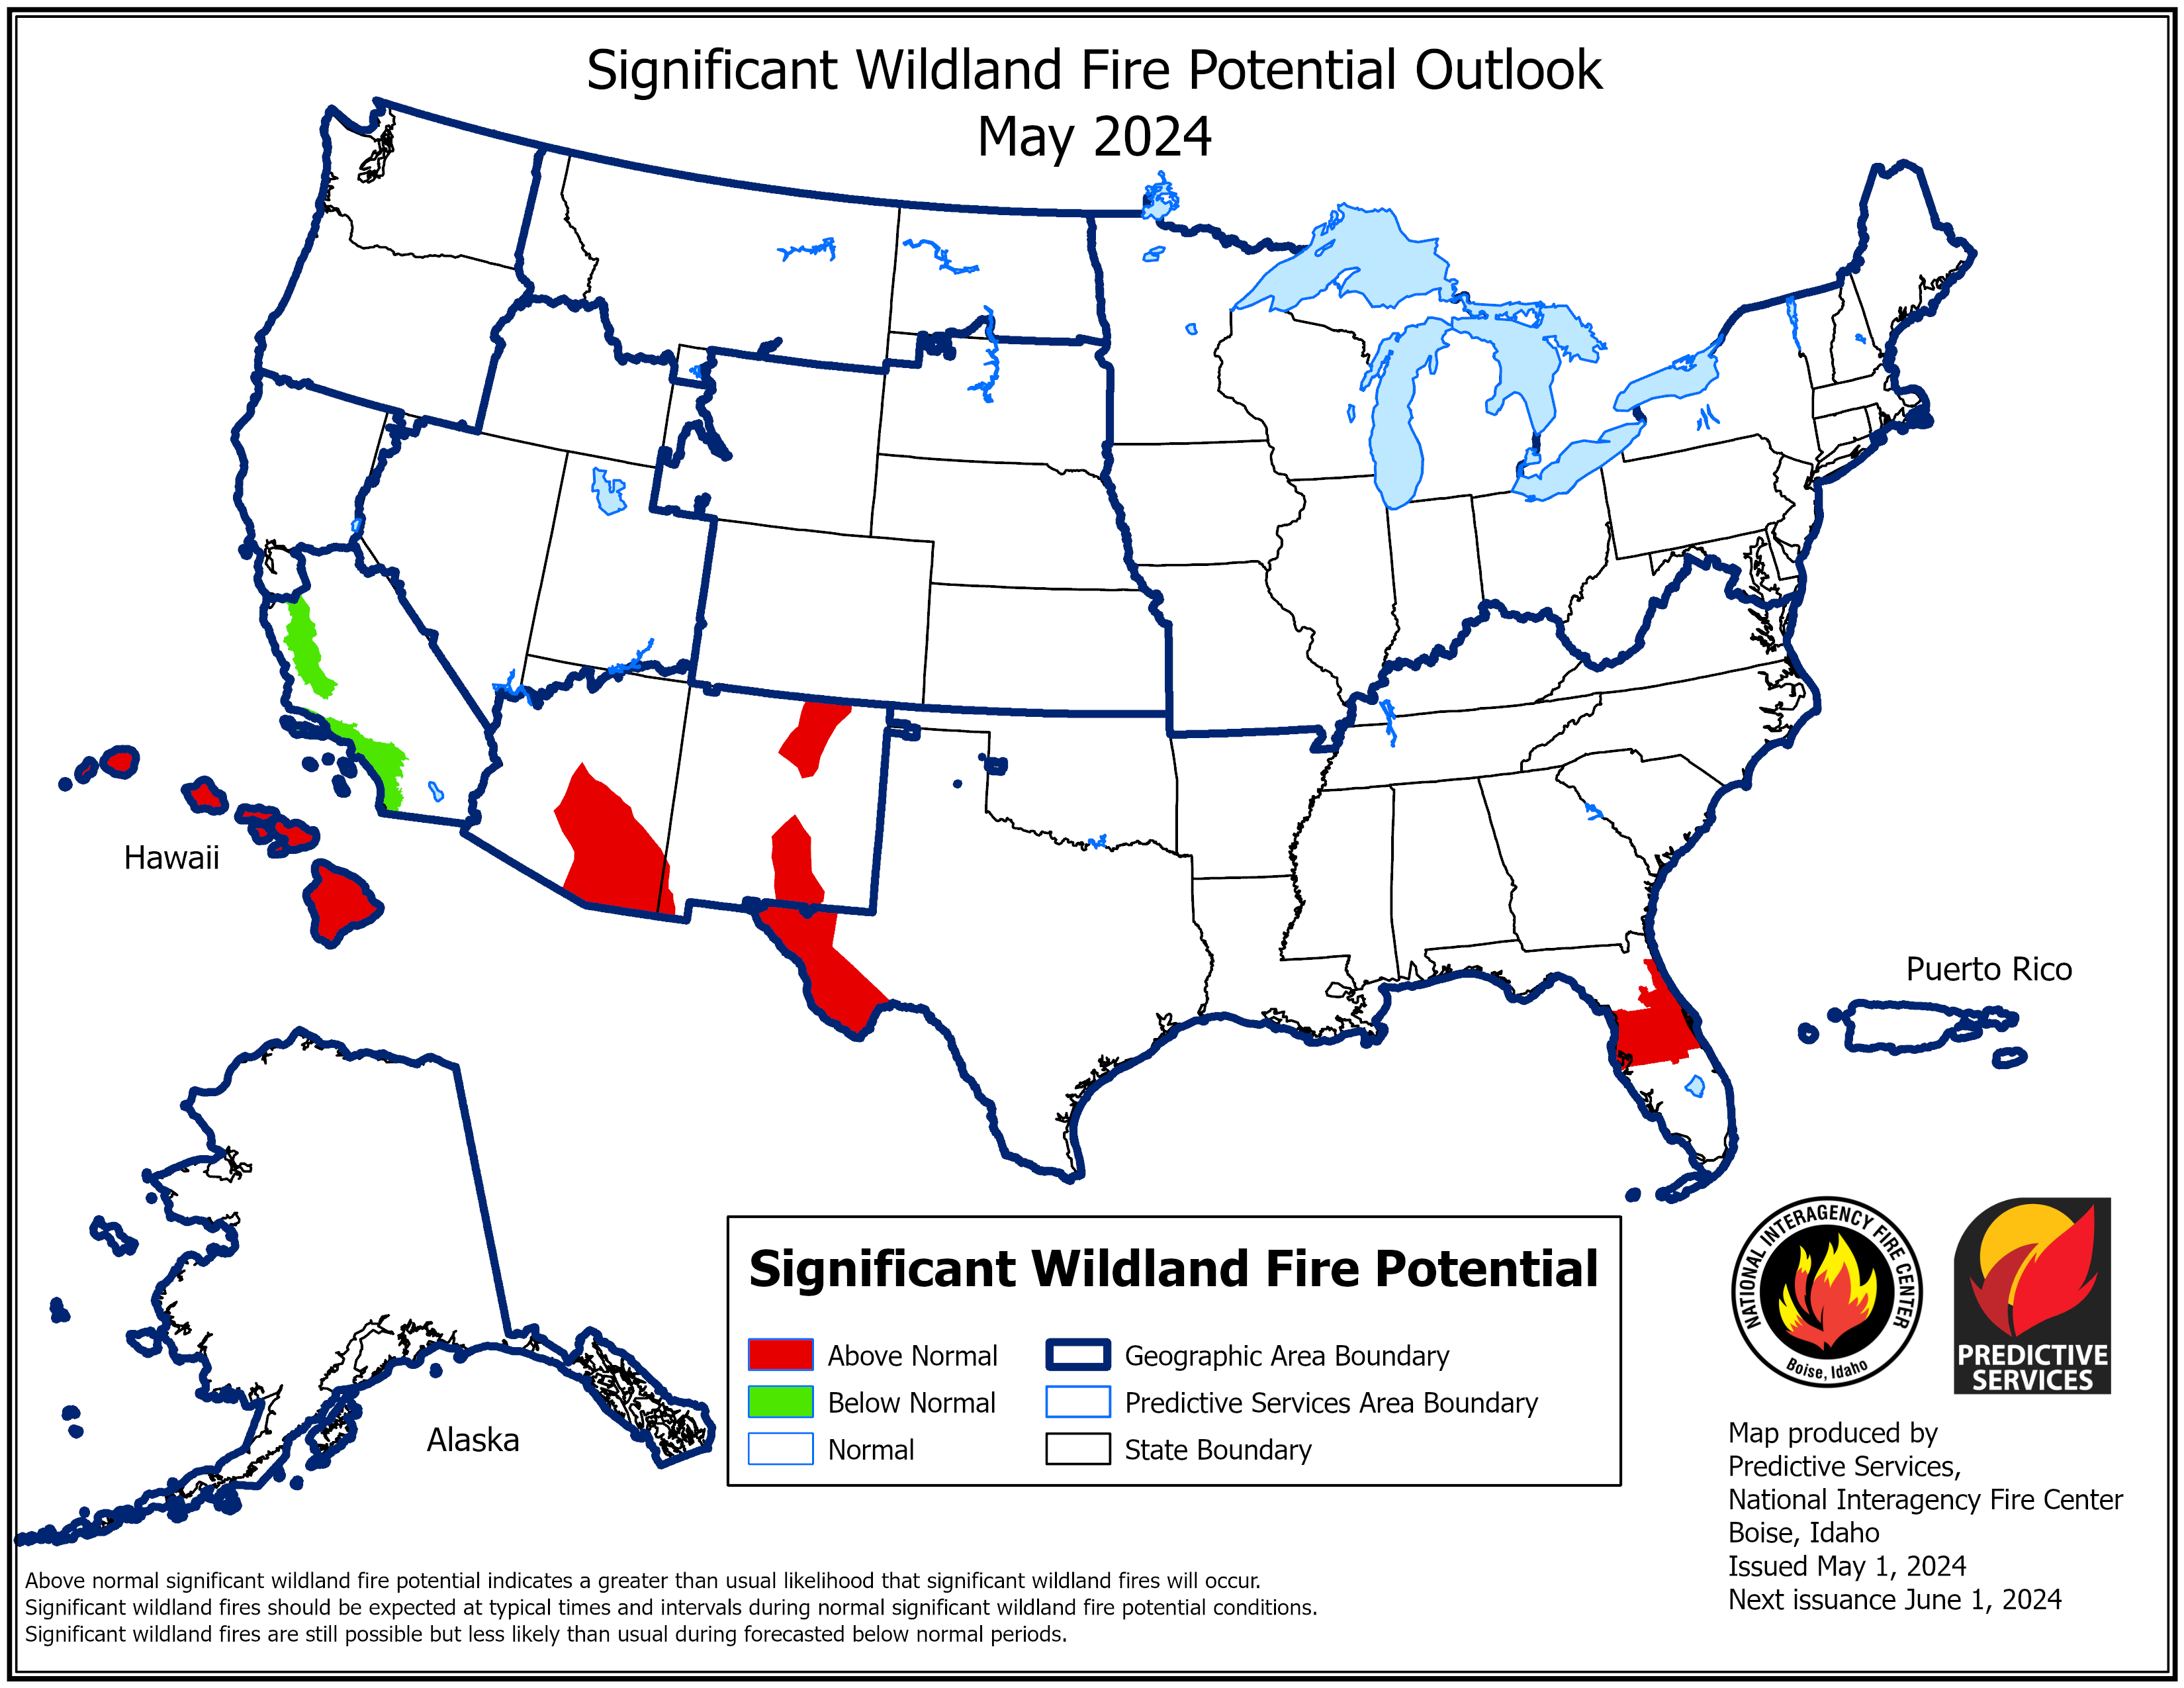
- According to the One-Month Outlook issued on June 1 from the National Interagency Fire Center, Hawaii, northern California, central Oregon, parts of the Great Basin, the western Plains and the central and southern Rocky Mountains have above normal significant wildland fire potential during June.
Regional Highlights
These regional summaries were provided by the six Regional Climate Centers and reflect conditions in their respective regions. These six regions differ spatially from the nine climatic regions of the National Centers for Environmental Information.
Northeast Region (Information provided by the Northeast Regional Climate Center)
The Northeast experienced a warmer-than-normal May and spring but precipitation varied.
- Temperature
The Northeast had its 18th warmest May since records began in 1895 with an average temperature of 58.7 degrees F, 1.8 degrees F above normal. May average temperature departures for the 12 Northeast states ranged from 0.5 degrees F above normal in Maryland to 3.1 degrees F above normal in Vermont. This May ranked among the 20 warmest Mays on record for seven states: Vermont, 11th warmest; New Hampshire and Rhode Island, 12th warmest; Massachusetts, 13th warmest; Connecticut and Maine, 14th warmest; and New York, 17th warmest. It was the Northeast’s 16th warmest spring on record, with an average temperature of 47.1 degrees F, 1.3 degrees F above normal. State temperature departures for May ranged from 0.7 degrees F above normal in West Virginia to 1.9 degrees F above normal in five New England states. This spring ranked among the 20 warmest on record for ten of the 12 Northeast states: Rhode Island, fourth warmest; Massachusetts, ninth warmest; New Hampshire, 11th warmest; Connecticut, 12th warmest; New Jersey and Vermont, 14th warmest; Maine, 15th warmest; Delaware, 16th warmest; and Maryland and New York, 19th warmest.
- Precipitation
During May, the Northeast received 3.93 inches of precipitation, 99 percent of normal. May precipitation for the 12 Northeast states ranged from 52 percent of normal in Rhode Island, its 20th driest May, to 144 percent of normal in Maryland, its 17th wettest May. Overall, seven states were on the dry side of normal. The Northeast’s spring precipitation was 11.16 inches, 99 percent of normal. Seven states were drier than normal with precipitation for all 12 Northeast states ranging from 66 percent of normal in Rhode Island, its 18th driest spring, to 113 percent of normal in New Jersey.
- Drought
The U.S. Drought Monitor from May 5 showed 1 percent of the Northeast in moderate drought and 17 percent as abnormally dry. Increasing precipitation deficits, declining soil moisture, and below-normal streamflow and groundwater levels led to the introduction of moderate drought in eastern Massachusetts, northern Rhode Island, and northeastern Connecticut and the introduction/expansion of abnormal dryness in coastal New England and western New York. Moderate drought and abnormal dryness persisted but contracted in western Maine. However, in southern parts of the Northeast, northern New Hampshire, and northern Vermont, plentiful precipitation allowed areas of moderate drought and abnormal dryness to ease. The U.S. Drought Monitor released on May 26 showed 2 percent of the Northeast in moderate drought and 13 percent as abnormally dry. A few Massachusetts communities implemented or enhanced water restrictions due to dry conditions. There were several brushfires in New England including a fire in New Hampshire’s White Mountains that took a week to contain and consumed 250 acres.
- Notable Weather
The Northeast experienced a few rounds of severe weather in May. On May 1 and 3, straight-line winds of 60 to 100 mph caused damage to buildings and blew down trees in southwestern Pennsylvania and northern West Virginia. From May 6 to 7, a storm dropped 3 to 5 inches of rain on parts of Maryland, West Virginia, and Pennsylvania, with Harrisburg, Pennsylvania, having its second wettest May day with 2.17 inches of rain. Flash flooding led to road closures, water rescues, and a few mudslides. Portions of West Virginia were hit particularly hard, with water inundating buildings and a fatality. A widespread severe weather event occurred on May 16, with multiple reports of straight-line wind damage across the region. An EF-1 tornado in western New Hampshire snapped/uprooted around 1,000 trees. Unusually large hail, the size of limes and baseballs (2 to 3 inches), damaged homes and dented cars in parts of Delaware and Maryland. According to the National Centers for Environmental Information’s storm database, a 3-inch hailstone in Calvert County, Maryland, was the state’s largest hailstone for any May since records began in 1950, while a 2.25-inch hailstone in Sussex County, Delaware, was the state’s second largest hailstone on record. The hailstones were each county’s largest on record. Severe weather once again affected the Northeast from May 20 to 22, with storm reports noting downed trees and wires, roof damage, a few fires due to lightning strikes, and localized flash flooding. An EF-0 tornado in Monmouth County, New Jersey, snapped/uprooted trees and caused mostly minor damage to at least a dozen homes. Small hail fell in several areas; however, Camden and Burlington counties in New Jersey saw hail as large as tennis balls (2.5 inches), tying as New Jersey’s largest hailstones for any May since records began in 1950. It tied as Burlington County’s largest hailstone on record and was Camden County’s second largest hailstone on record. Another round of severe weather occurred on May 27, with five tornadoes touching down in the region. In Pennsylvania, an EF-1 tornado destroyed several large barns and sheds, damaged silos, blew down crops, and left three people injured along its over three-mile track in Lancaster County, while EF-0 tornadoes in Franklin and Cumberland counties damaged homes and trees. Damage from two tornadoes in Maryland, an EF-1 near the St Mary’s County-Charles County border and an EF-0 in Montgomery County, mostly consisted of downed or snapped trees, some of which fell on houses and vehicles or blocked roads.
- For more information, please visit the Northeast Regional Climate Center Home Page.
Midwest Region (Information provided by the Midwest Regional Climate Center)
- Temperature
The May average temperature for the Midwest was 61.1 degrees F (16.2 degrees C), which was 1.4 degrees F (0.8 degrees C) above the 1991-2020 normal. Statewide monthly average temperatures ranged from 0.3 degrees F (0.2 degrees C) above normal in Minnesota to 2.4 degrees F (1.3 degrees C) above normal in Ohio. An unusual mid-May heatwave brought hot and humid conditions across the region from May 8-14, with over 1,500 daily high temperature records broken or tied during that week. Columbia, Missouri had six consecutive days with record high temperatures (dating back to 1890). Three heat-related fatalities were reported in Chicago, where a new 3-day minimum temperature record was set (72.3 degrees F / 22.4 degrees C). Many locations across the region exceeded 90 degrees F (32 degrees C) for the first time this season, which is about a month earlier than normal across the central and northern Midwest. Dew point temperatures in the upper 70s and lower 80s pushed heat index values over 100 degrees F (38 degrees C) in portions of Iowa, Illinois, and Wisconsin during the height of the heatwave.
The average spring (March-May) temperature for the Midwest was 0.5 degrees F (0.3 degrees C) below normal, with areas in the northwest up to 4 degrees F (2.2 degrees C) below normal and areas in the southeast up to 3 degrees F (1.7 degrees C) above normal.
- Precipitation
May precipitation was 4.81 inches (122 mm) for the Midwest, which was 0.43 inches (11 mm) above normal, or 110 percent of normal. Statewide precipitation totals ranged from 1.24 inches (31 mm) below normal in Iowa to 1.95 inches (50 mm) above normal in Minnesota. Based on preliminary data, Minnesota had the 7th wettest May and the 5th wettest spring since 1895. Ohio had the 15th wettest May since 1895. Regionwide there were 355 daily high precipitation records broken or tied for the month. Collegeville, Minnesota had its wettest May on record (since 1892). Columbus, Ohio had the 3rd wettest May on record (since 1878).
Spring (March-May) precipitation for the Midwest totaled 11.55 inches (293 mm), which was 0.93 inches (23.6 mm) above normal. International Falls, Minnesota had the wettest spring since 1895 with over 14 inches (355.6 mm) of precipitation, breaking the previous record by nearly 4 inches (101.6 mm).
- Flooding
Above-normal winter snowpack, delayed ice-out, and repeated heavy rainstorms in April and May spurred widespread flooding across northern Minnesota. Record high monthly average streamflows were reported in May along the Rainy River (Minnesota/Canadian border) and the Red River of the North (western boundary of Minnesota). Damage along the Red River of the North was minimal, while the Rainy River basin had significant impacts including damaged homes, National Guard deployments, and numerous closures of roads, trails, and recreational areas. In northeast Minnesota, historic raging waterfalls caused substantial damage to bridges, docks, and roads with many paths and overlooks closed. Flooding across northern Minnesota is expected to continue into June.
- Corn Planting
Midwest corn planting started the month behind schedule following a cool and damp April. By May 8, corn planting was 18-49 percent behind the 5-year average across the region. Indiana, Illinois, and Iowa reported just 11 percent, 15 percent, and 14 percent of the total corn crop planted, respectively. However, as conditions rapidly warmed in mid-May, farmers moved quickly to close the gap on delayed planting. By May 29, corn planting was 0-14 percent behind the 5-year average. Only two states, Minnesota and Ohio, had double-digit planting delays at 14 percent and 10 percent behind the 5-year average, respectively. In Iowa, 94 percent of the total corn crop had been planted by month’s end.
- Notable Weather Events
A straight-line wind event (derecho) on May 12 traversed the north-central US, affecting Iowa and Minnesota in the Midwest. There were 228 preliminary storm reports across those two states, including 20 tornado reports, that resulted in one fatality and extensive damage to buildings, vehicles, and trees. Osceola County, Iowa recorded an 82-mph wind gust while a 94-mph gust was measured in Madison, Minnesota. Strong winds also produced a dust storm, called a haboob, that traveled across portions of Iowa and Minnesota.
- For further details on the weather and climate events in the Midwest, see the weekly and monthly reports at the Midwest Climate Watch page.
Southeast Region (Information provided by the Southeast Regional Climate Center)
- Temperature
Temperatures were near to above average across much of the Southeast region for the month of May. Monthly mean temperatures were within 2 degrees F (1.1 degrees C) of average for over 58 percent of the 217 long-term (i.e., period of record equaling or exceeding 50 years) stations across the region. There were only a handful of stations that observed monthly mean temperatures that were ranked within their five warmest values on record, including Mobile, AL (1871-2022; 3rd warmest) and Wilmington, NC (1871-2022; 3rd warmest). Maximum temperatures ranged from 4.2 degrees F (2.3 degrees C) above normal in Lumberton, NC (1903-2022) to 1.7 degrees F (0.9 degrees C) below normal in Norfolk, VA (1871-2022). Daily temperature minimums ranged from 4.6 degrees F (2.6 degrees C) above normal in Wilmington, NC (1871-2022) to 0.5 degrees F (0.3 degrees C) below normal in Fort Piero, FL (1904-2022). The warmest weather of the month occurred from the 19th through the 22nd, as the circulation around the Bermuda High, situated off the Atlantic coast, transported warm, humid air over much of the Southeast region. Daily maximum temperatures exceeded 90 degrees F (32 degrees C) across portions of every state, and much of the region observed mean temperatures more than 10 degrees F (5.6 degrees C) above normal. Indeed, Lumberton, NC (1903-2022) had a daily maximum temperature of 99 degrees F (37 degrees C) on the 19th, and Richmond, VA (1871-2022) had a daily maximum temperature of 97 degrees F (36 degrees C) on the 20th, both setting daily records. On May 18th, a heat advisory was issued for parts of Puerto Rico, which was only the third time one was issued since 2006. In contrast, the coldest weather of the month across the Southeast occurred on the 8th through the 11th, as the circulation around a departing mid-latitude cyclone ushered in cooler air from the northwest. Daily minimum temperatures fell below 45 degrees F (7.2 degrees C) across portions of every state north of Florida.
- Precipitation
Precipitation was variable across much the Southeast region for May, with only a few wet and dry extremes reported. The driest locations were found across southern Florida, northern Georgia, parts of eastern North Carolina, and Puerto Rico. Monthly precipitation totals ranged from 70 to less than 25 percent of normal across these locations. Coloso, PR (1940-2022) only observed 2.66 inches (68 mm) of precipitation, more than 7 inches (178 mm) below normal, making this the second driest May on record. In contrast, the wettest locations for the month were located across southern Alabama, the Florida Panhandle, and western North Carolina. Precipitation totals ranged from 100 to 200 percent of normal. Pensacola, FL (1879-2022) measured 12.05 inches (306 mm) of precipitation for the month, over 8 inches (203 mm) above normal, making this the second wettest May on record. On the 21st, a line of thunderstorms produced heavy rainfall across South Carolina, with 1-hour precipitation totals exceeding 2.5 inches (64 mm). Columbia, SC (1887-2022) reported 2.17 inches (55 mm) of rainfall within 30 minutes, causing flash flooding and road closures.
- Drought
Drought conditions improved for parts of Virginia and Florida but intensified for parts of South Carolina, Georgia, and Puerto Rico in May. By the end of the month, only pockets of abnormally dry conditions (D0) remained in Virginia. Drought conditions stayed the same throughout the month in North Carolina, with a pocket of severe drought (D2) along the eastern North Carolina coast ringed by moderate drought (D1) and abnormally dry conditions (D0). Moderate drought (D1) ringed by abnormally dry conditions stretch from eastern South Carolina down into southern Georgia, with an embedded pocket of severe drought (D2) developing by the end of the month. In southern Florida, drought conditions improved with a pocket of moderate drought (D1) ringed by abnormally dry conditions (D0). Drought conditions slightly intensified across Puerto Rico for the month, with pockets of moderate drought (D1) ringed areas of abnormally dry conditions (D0) across the Island and pockets of moderate drought (D1) to extreme drought (D3) across the Virgin Islands.
- Agriculture
Due to the lack of adequate rainfall across the citrus growing region of Florida, farmers had to run irrigation in all areas. Heavy rainfall eased the dry conditions in the northern part of the state and the Panhandle, which allowed producers to pick up planting peanuts and cotton after some had halted the planting due to the dryness. Moderate drought conditions in southern Georgia required farmers to run irrigation in fields. Cotton planting was halted due to a lack of soil moisture in some areas. Some cotton and peanut plantings were delayed due to wet soil conditions in Alabama. Strawberries were reported to have received too much rain and many berries fell. However, cattle and pastures remained in good conditions throughout the state. Warm conditions with sporadic rainfall across much of South Carolina resulted in favorable planting conditions, although many producers had to run irrigation for their crops. Peach harvest was off to a strong start, although some early peaches were still showing signs of the freeze damage from the late freeze in March.
- Severe Weather & Other Impacts
There were 888 reports of severe weather across the Southeast during May, which is 196 percent of the median monthly frequency of 452 reports during 2000-2019. There were 24 confirmed tornadoes reported for the month (8 EF-0, 14 EF-1, and 2 EF-2), 218 percent of the monthly average of 11. The strongest tornado was in Bedford County, VA and was rated EF-2, with winds of 135 mph (60 m/s) on May 27th. This tornado damaged many homes, structures, and trees. Fortunately, there were no fatalities and only two injuries. Another EF-2 tornado in Iredell County, NC, with winds of 115 mph (51 m/s) occurred on May 26th. This tornado snapped trees and damaged the roof of a barn. Fortunately, only one injury was reported. An EF-1 tornado with winds of 107 mph (48 m/s) damaged industrial buildings in Arecibo, PR, on May 1st. This was only the third EF-1 tornado in Puerto Rico since records began in 1950. No injuries were reported. There were 169 reports of hail for the month, with the largest being tennis-ball sized (2.5 inches) in Cleveland County, NC on May 6th. Quarter-sized hail (1 inch) occurred in Coamo County, PR on May 26th. This was only the seventh time hail this size or larger was reported in Puerto Rico since 1950. There were 685 wind reports for the month, which is 233 percent of the average (294 reports). Straight line winds of 85 mph (40 m/s) were observed in Rockbridge County, VA on the 6th, downing multiple trees.
- For more information, please visit the Southeast Regional Climate Center Home Page.
High Plains Region (Information provided by the High Plains Regional Climate Center)
May ended on a high note for many places in the High Plains, with much-needed precipitation arriving. Another derecho impacted the region on the 12th of May, with 67 reports of 75+ mph. This surpassed the event on December 15th of last year and broke the record for the most significant wind gusts in one day. Notable impacts include a 105-mph wind gust recorded near Tripp, South Dakota and 13 tornadoes in the state. Unfortunately, there were three deaths from this event. On the same day, a very rare haboob crossed through Nebraska and South Dakota. Haboobs are walls of dust in front of thunderstorms resulting from high downdraft speeds. This led to low visibility and near blackout conditions. A state of emergency was declared in South Dakota to help those impacted by the storms. Despite temperatures near normal for the region, an unseasonable heat wave led to many broken daily records. Between May 8th and 14th, 267 high maximum temperature and 453 high minimum temperature records were broken, for a total of 720 records (minimum of 30 years of data). Every state recorded at least one record, with Colorado, Kansas, and Nebraska primarily impacted.
- Temperature
Temperatures for the month of May were near-normal throughout the region, with pockets of below-normal observed in Wyoming. Despite the near-normal temperatures, there were large swings present during the month. Hundreds of daily high and low temperatures were broke during the heat wave in Mid-May. Every state in the region broke either a high maximum temperature or high minimum temperature. On the opposite end of the spectrum, Wyoming broke 73 low maximum or low minimum temperature records during this period.
Below-normal temperatures in Wyoming led to one location to rank in the top 10 coldest on record. The city of Casper observed their 8th coldest month on record, with an average temperature of 48.3 degrees F. Several other locations in Wyoming came close to being in the top 10 due to the cooler temperatures this month.
The near normal to cooler than normal temperatures have also been beneficial in the prevention of intensifying drought conditions. Many areas in eastern Wyoming and southwestern South Dakota observed well below normal precipitation this month, however, the temperatures helped prevent a significant expansion of drought conditions.
- Precipitation
Precipitation for the region was mixed. Some parts of the region such as eastern Kansas were well above-normal, while areas such as southwest South Dakota were well below-normal. Several locations in Kansas, North Dakota, and South Dakota observed their top 10 wettest months on record.
Eastern Kansas was extremely wet in May, with multiple rounds of storms occurring. Wichita observed its 2nd wettest month on record, with 12.95 inches of precipitation. Topeka observed their 3rd wettest, and Salina recorded their 4th wettest month on record, with 11.68 and 8.72 inches, respectively. In North Dakota, Williston and Grand Forks observed the 3rd and 5th wettest on record. Aberdeen, South Dakota also ranked in the top 10 wettest. Back-to-back months of above-normal precipitation have led to serious flooding issues along the Red River in North Dakota. Near the Canadian border, river levels crested at 52.27 feet on May 8th. This was well above the flood stage of 39 feet for that location. The flooding and heavy precipitation have led to significant issues for agriculture, with planting well behind the normal schedule.
Overall, severe weather was less active than normal throughout the region, except for South Dakota. During May, there were 108 more than the average (2002-2022) severe thunderstorm and tornado warnings issued in South Dakota. In contrast, Kansas was 155 warnings below the average for May. There were numerous reports of large hail this month, but a storm on the 29th was particularly dangerous. In central Nebraska, a storm over Loup County had several reports of 5-inch hail with unconfirmed reports of hailstones in the 6-inch range.
- Drought
Across the region, drought conditions improved in May as a result of beneficial precipitation. The High Plains region observed a 14 percent decrease in severe to exceptional (D2-D4) drought, there was also a 10 percent increase in areas that are not in any drought or abnormally dry conditions.
After back-to-back months of well above-normal precipitation, North Dakota is now drought-free. Currently, only 12 percent of the state is in abnormally dry (D0) conditions. Conditions in South Dakota and Wyoming also improved significantly, with extreme drought (D3) and D2 reduced by 30 and 36 percent, respectively. While eastern Kansas is nearly free of drought, the western part of the state observed a 12 percent increase in D3 and D4 conditions. Colorado also recorded an 11 percent increase in D3-D4 conditions. Elsewhere in the region, other improvements and degradation were observed.
- For more information, please visit the High Plains Regional Climate Center Home Page.
Southern Region (Information provided by the Southern Regional Climate Center)
May 2022 was the fourth warmest May ever observed across the Southern Region.
- Temperature
In the Southern Region, temperatures were well above normal. The average temperature was 75.2 F, 3.4 F warmer than the 1991-2020 normal and 4.0 F warmer than the 20th century average. Texas tied its second warmest May ever, at 78.0 F, 4.4 F above normal, behind only 1996, and Louisiana and Mississippi were both sixth warmest on record. Tennessee, Arkansas, and Oklahoma were 25th, 27th, and 29th warmest, respectively. Overall, the regional average temperature was fourth warmest on record, behind only 2018, 1896, and 1996. The hottest temperature in the region was 113 F, recorded at Rio Grande Village in Big Bend National Park, Texas on May 30. About half the state reached triple digits at least once during May. One station dropped below freezing in May: Bravo, in the Texas Panhandle, recorded a minimum temperature of 31 F on May 3. In central Texas, Junction and Goldthwaite set all-time May maximum temperature records, at 106 F for Junction and 104 F for Goldthwaite; both cities have at least sixty years of weather records. The May average temperature was the hottest on record across a large swath of Texas, from Abilene and San Angelo to Victoria and Galveston and including the major cities of Austin and San Antonio. No stations in the region set records for coldest temperature recorded in May.
- Precipitation
Precipitation was close to normal across the Southern Region, averaging 3.82 inches, 0.30 inches below the 1991-2020 average. Both Oklahoma and Arkansas were relatively wet. Oklahoma received an average of 6.32 inches, 1.39 inches above normal, while Arkansas received 6.38 inches, 0.93 inches above normal. Louisiana, Mississippi, and Tennessee were all near normal, while Texas was 25th driest on record, averaging 2.25 inches. At least one station in every state except Texas recorded at least ten inches of rain. The largest totals were 13.17 in Terlton and 13.09 in Drumright, both of which are located west of Tulsa, Oklahoma. These values were almost equalled by Donaldsonville, Louisiana at 12.99 inches and Newfound Gap, Tennessee, at 12.98 inches. The largest single-day total was 7.71 inches at Muskogee, Oklahoma on May 5. Tied for second was 6.65 inches at Viney Grove, Arkansas on the same day and at Colmesneil, Texas, on May 22. The preceding day, Rio Grande City, in south Texas, reported 6.50 inches.
- Drought/Flooding
Drought conditions generally improved across the Southern Region. As with the nation as a whole, the area in drought dropped below 50%. Severe drought coverage declined from 46% to 40%, extreme drought declined from 32% to 25%, and exceptional drought declined from 11% to 9%, despite peaking at 16% on May 17. Arkansas and Mississippi were free of drought, and Tennessee had drought appear for just one week. Louisiana showed slight improvement to 45% drought coverage and Texas showed slight improvement to 78% drought coverage. The largest change was in Oklahoma, where drought coverage decreased from 65% of the state to 43% of the state and extreme drought declined from 39% to 17%. Primary impacts continue to be agricultural (farming and ranching), but water supply impacts will intensify over the summer if drought persists. Meanwhile, the floods associated with the heavy rainfall in northeastern Oklahoma and northwestern Arkansas on May 4 and 5 led to dozens of water rescues and numerous flooded homes, damaging roads, bridges, and culverts.
- Notable Weather
There were 42 confirmed tornadoes across the Southern Region in May. Most were in Texas or Oklahoma, but there were also two in Mississippi and one in Louisiana. The largest outbreak was on May 4, with 13 tornadoes extending into the early morning of May 5. These included long-track tornadoes of 26 miles (near Crowell, Texas; EF1), 23 miles (Lockett, Texas; EF3, the only EF3+ of the month), 14 miles (near Bearden, Oklahoma; EF1), and 12 miles (Seminole, Oklahoma; EF2). Another tornado had come within a mile of Seminole three days earlier. The following day produced three tornadoes in eastern Texas, including an EF2 near Henderson that caused the only injury of any tornado in the month. There were 579 reports of damaging wind and 428 reports of large hail. Two injuries were caused by the strong winds, one a car accident in Texas on May 22 and one a tree falling on a house in Mississippi on May 16. The largest hail observed was 4.5 inches in diameternear Okemah, Oklahoma; two four-inch hailstones were found in Seminole, Oklahoma on May 2 and near Knickerbocker, Texas on May 24. The strongest measured wind gust was 87 miles per hour near Amherst, Texas on May 10.
- For more information, please visit the Southern Regional Climate Center Home Page.
Western Region (Information provided by the Western Region Climate Center)
A continuation from April of an active weather pattern in the Pacific Northwest persisted throughout May. Most of the Pacific Northwest saw above normal precipitation and the entire Pacific Northwest, northern California, and northern Great Basin saw below normal temperatures. The southern tier of the Southwest remained dry and warm with several large wildfires remaining active throughout the month in Arizona and New Mexico.
- Temperature
Persistent cold temperatures were found across the Pacific Northwest with much of the region 3-6 degrees Fahrenheit below normal for the month. In southeast Washington, Walla Walla tied the 1962 record for coldest May since records began in 1949 at 54.5 degrees Fahrenheit (12.4 degrees Celsius), -5.9 degrees Fahrenheit (-3.4 degrees Celsius) below normal. Thompson Falls in northwest Montana saw its second coldest May since 1956 at 50.6 degrees Fahrenheit (10.3 degrees Celsius), -4.3 degrees Fahrenheit (-2.4 degrees Celsius) below normal. Seattle, Washington recorded the seventh coldest May at 52.6 degrees Fahrenheit (11.4 degrees Celsius), -4.9 degrees Fahrenheit (-2.8 degrees Celsius) below normal. Arizona and New Mexico saw temperatures 2-4 degrees Fahrenheit above normal. Roswell, New Mexico was +3.7 degrees Fahrenheit (+2 degrees Celsius) above normal at 76 degrees Fahrenheit (24.4 degrees Celsius) for the third warmest May since 1949 and Albuquerque, New Mexico recorded 69.3 degrees Fahrenheit (20.7 degrees Celsius), +3.2 degrees Fahrenheit (+1.8 degrees Celsius) above normal for the eighth warmest since records began in 1892.
- Precipitation
Oregon, Washington, and Idaho all had large areas with 150-200+ percent of normal precipitation for the month. In Seattle, Washington a trace or more of precipitation was recorded on 21 of 31 days in May with a total of 3.82 inches (97 millimeters), 203 percent of normal, and the second wettest since records began in 1945. Along the northern coast of Oregon, Astoria logged 6.24 inches (158.5 millimeters) at 184 percent of normal and coming in as the third wettest on record since 1953. A large swath of the Southwest recorded zero or trace amounts of precipitation in May including California from about the San Francisco Bay area southward, southern Nevada, southern Utah, all of Arizona, and much of New Mexico. May is climatologically a dry month for locations that received no measurable precipitation and most stations have seen several other years without any measurable precipitation in May.
- Drought
According to the US Drought Monitor at the end of May, 87 percent of the West was in drought with 38 percent of the West in extreme (D3) or exceptional (D4) drought. Reductions in drought severity and spatial extent were found in Oregon, Washington, Idaho, and southern Montana due in part to the cool and wet conditions during May. Most of the Southwest was already in drought at the start of May and spatial extent of area covered by any drought did not change; however, drought severity increased in California, Nevada, Utah, Arizona, and New Mexico.
Temperatures in Alaska were a mixed bag and were above normal in Southcentral, Southwest Mainland, and the North Slope, and below normal in the Northwest Arctic and Eastern Interior. Precipitation also varied by region with below normal in Southcentral, Southwest, and most of the Panhandle, and above normal in the Northwest Arctic and parts of the Interior. Anchorage was warm and dry with a temperature of 50.9 degrees Fahrenheit (10.5 degrees Celsius), +2.8 degrees Fahrenheit (+1.6 degrees Celsius) above normal for the third warmest on record, and total precipitation of 0.26 inches (6.6 millimeters), at 40 percent of normal and the 13th driest on record. Kodiak logged a temperature of 47.5 degrees Fahrenheit (8.6 degrees Celsius), +1.6 degrees Fahrenheit (+0.9 degrees Celsius) above normal and sixth warmest on record. Moderate drought (D1) was introduced into Southcentral Alaska for the first time since August, 2021. Snowfall in May at Denali National Park pushed the seasonal total to 176 inches making it the snowiest season since records began in 1922.
- Hawaii Summary
Precipitation anomalies were highly variable across Hawaii. On the Big Island it was wetter than normal on the northern and eastern parts of the island and drier on the southern tip. Hilo saw its 13th wettest May with 12.65 inches (321.3 millimeters) and 181 percent of normal. For O’ahu it was wetter than normal on the southern parts of the island and drier on the northern parts. Honolulu logged 1.4 inches (35.6 millimeters) at 171 percent of normal for the 14th wettest since records began in 1940. Overall, drought extent was reduced on most islands with 40 percent of Hawaii in moderate drought (D1) or worse at the end of May compared to 79 percent three months earlier.
- Significant Events for May 2022
Wildfire in New Mexico becomes largest in state history: The Calf Canyon and Hermits Peak fires both ignited in April in the Sangre de Cristo Mountains in northern New Mexico. Both fires remained active in May due to persistent hot, dry, and windy conditions and merged into one fire in mid-May that has grown to over 300,000 acres in size and became the largest fire in New Mexico history. Over 700 structures have been destroyed and thousands of residents have been evacuated from their homes. At the end of May the fire was about 50 percent contained.
- For more information, please go to the Western Regional Climate Center Home Page.