National Overview

March Highlights
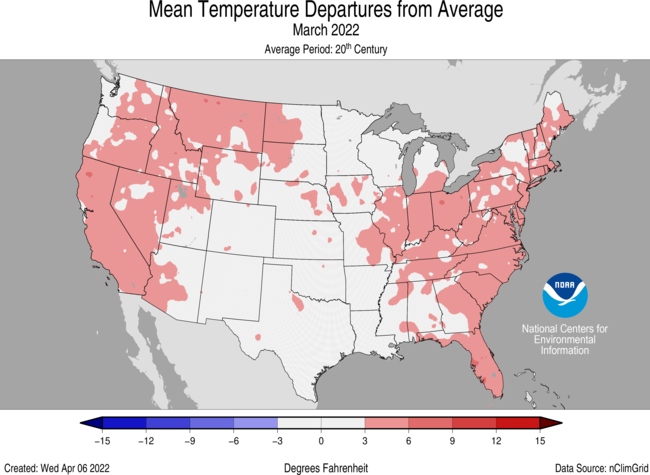
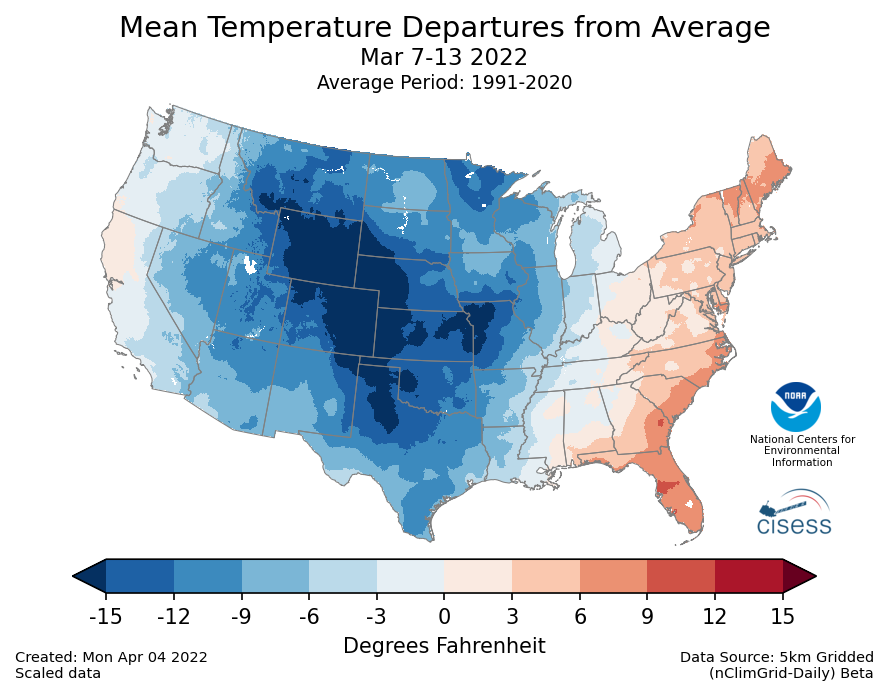
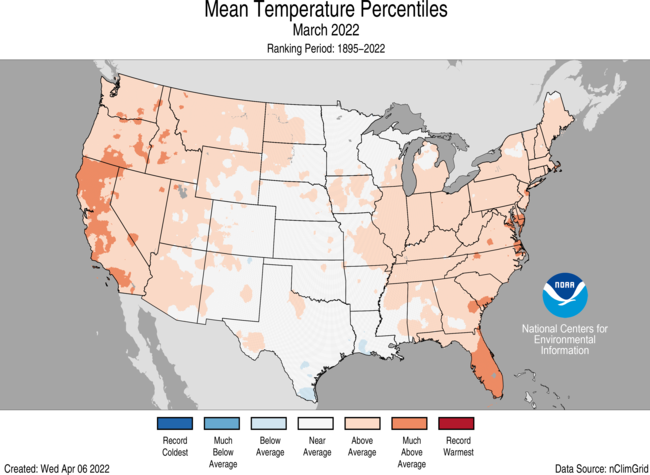
March Temperature
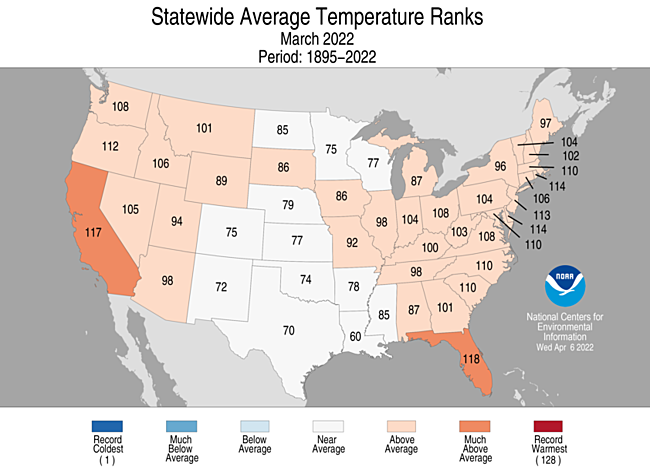
- During March, the average contiguous U.S. temperature was 44.1°F, 2.6°F above the 20th-century average. This ranked in the warmest third of the 128-year period of record.
- A large cold-air outbreak across the central U.S. occurred during the second week of March. Despite this cold spell, temperatures for the month as a whole were above average across much of the West and from the Midwest to the East Coast. Temperatures were below average in pockets along the western Gulf Coast during March.
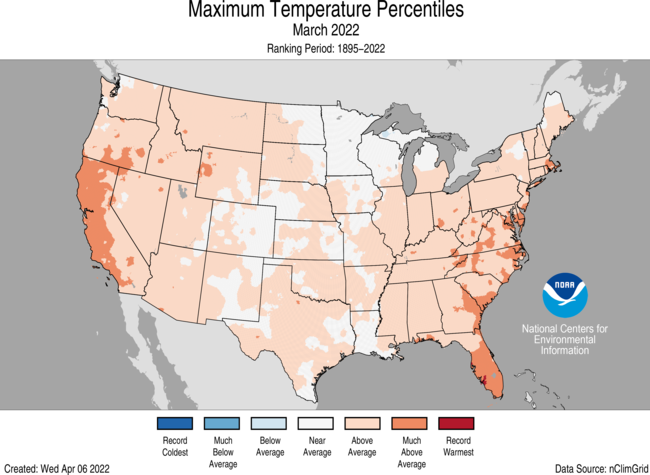
- The contiguous U.S. average maximum (daytime) temperature during March was 56.8°F, 3.8°F above the 20th-century average, ranking in the warmest third of the record. Above-average maximum temperatures blanketed much of the contiguous U.S. Near average daytime temperatures were observed from the Upper Mississippi Valley to the Gulf Coast and portions of the Southwest.
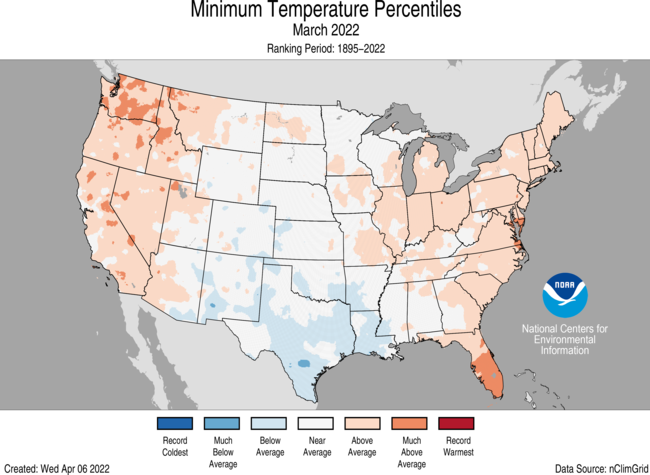
- The contiguous U.S. average minimum (nighttime) temperature during March was 31.5°F, 1.5°F above the 20th-century average, ranking in the warmest third of the record. Above-average temperatures were observed across much of the West and from the Midwest to the East Coast. Below-average nighttime temperatures were observed from the western Gulf Coast to portions of the Southwest.
- The Alaska March temperature was 16.6°F, 5.8°F above the long-term average. This ranked in the warmest third of the 98-year period of record for the state. Temperatures were above average across much of the state with Anchorage and Talkeetna reporting a top-10 warm March.
- During March there were approximately 2 times as many warm daily records as compared with cold records. As of April 5, there were 7,190 record warm daily high (3,722) and low (3,468) temperature records and 3,838 record cold daily high (1,944) and low (1,894) temperature records.
- Based on NOAA's Residential Energy Demand Temperature Index (REDTI), the contiguous U.S. temperature-related energy demand during March was 62 percent of average and ranked 16th lowest in the 128-year period of record.
March Precipitation
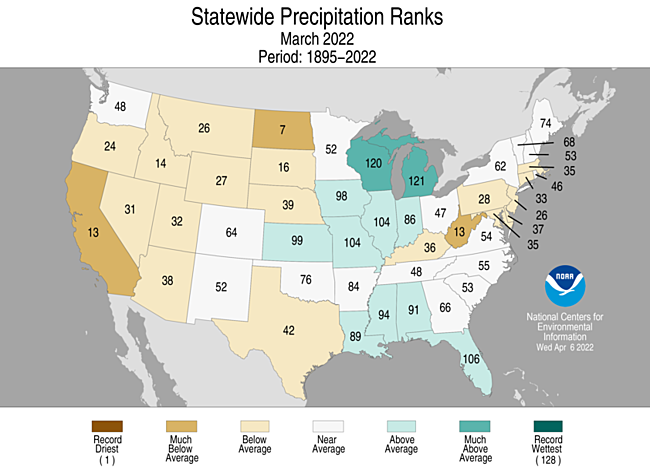
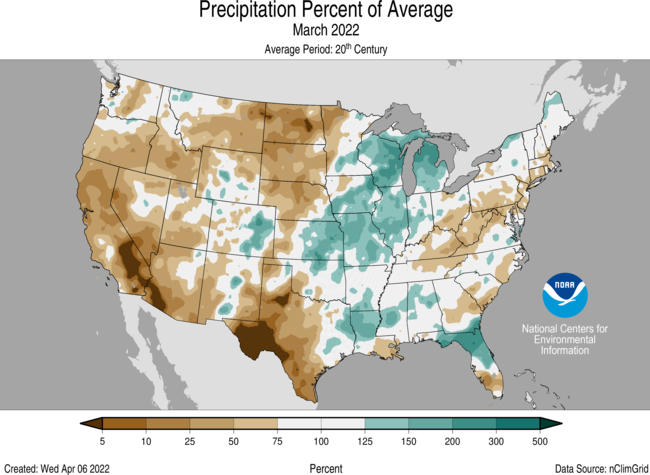
- The March precipitation total for the contiguous U.S. was 2.26 inches, 0.25 inch below average, and ranked in the driest third of the 128-year period of record.
- Precipitation was above average from the central Plains to the Great Lakes, as well as across parts of the Deep South and Southeast. Precipitation was below average across much of the West, northern and southern Plains and from the Tennessee Valley to the Mid-Atlantic and parts of the Northeast. North Dakota ranked seventh driest on record, while Michigan ranked eighth wettest for the month.
- Several severe weather outbreaks produced strong and damaging tornadoes during March.
- On March 5, supercell thunderstorms produced at least 13 confirmed tornadoes across Iowa including a confirmed EF4 tornado in Winterset.
- On March 21-22, severe weather and tornadoes were reported from Texas to Alabama including an EF3 tornado that substantially damaged two Jacksboro, Texas, schools and an EF3 tornado that ripped through the New Orleans metro area.
- Another severe weather outbreak impacted the Gulf Coast states on March 30-31 from Louisiana to Florida with at least 14 tornadoes and 2 fatalities confirmed.
- Precipitation across southeastern Alaska during March was above average. Following the wettest January and February on record, Juneau remained wet in March, ranking 10th wettest. As a result, the first three months of the year were the wettest on record and also the wettest January-April on record with the entire month of April still in play. End-of-March snowpack was above average across much of mainland Alaska with some locations near record high levels.
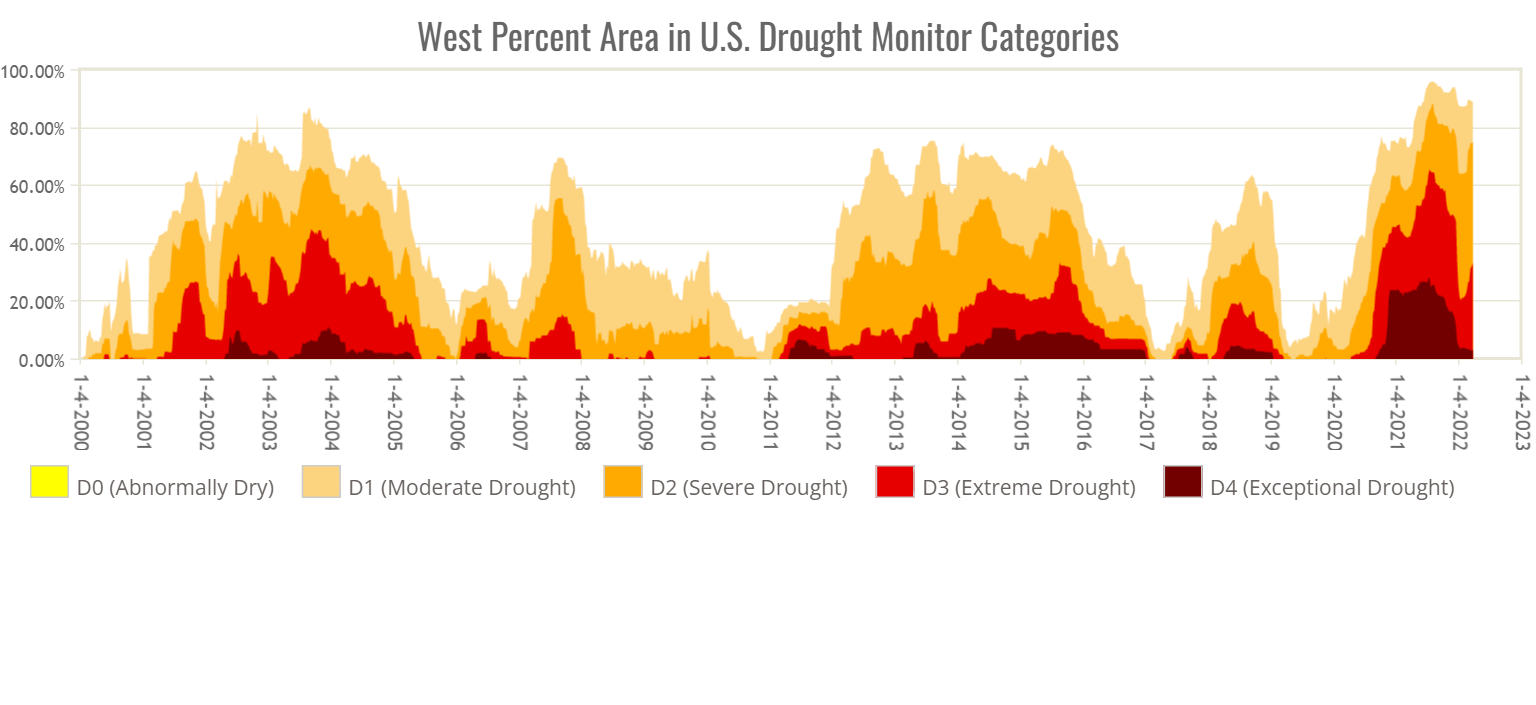
- According to the March 29 U.S. Drought Monitor report, nearly 58 percent of the contiguous U.S. was in drought, down from 59 percent at the beginning of March. Drought conditions intensified and/or expanded across portions of the Southeast, Plains, southern Rockies, parts of the West Coast and Hawaii. Drought intensity and/or coverage lessened across parts of the northern Great Lakes. During March, the contiguous U.S. drought footprint reached 61 percent — the largest observed extent of drought since the fall of 2012.
Year-to-Date Highlights
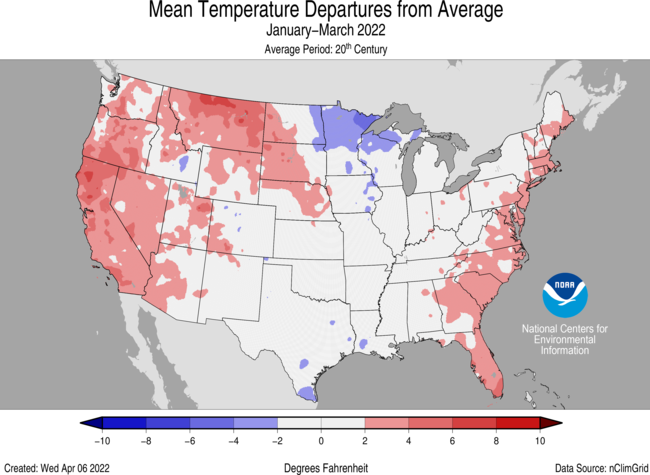
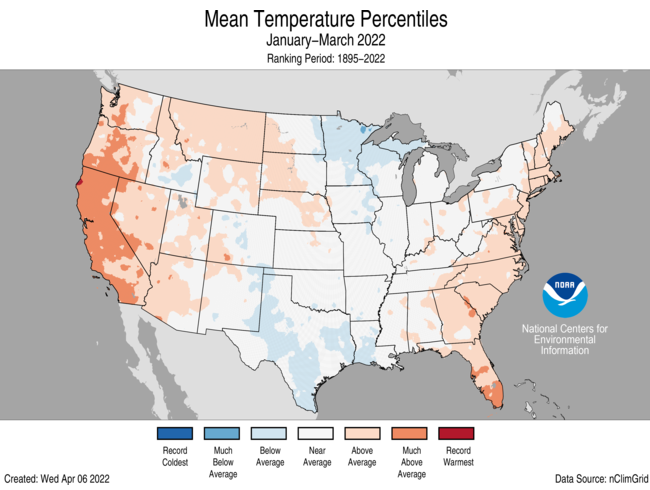
January-March Temperature
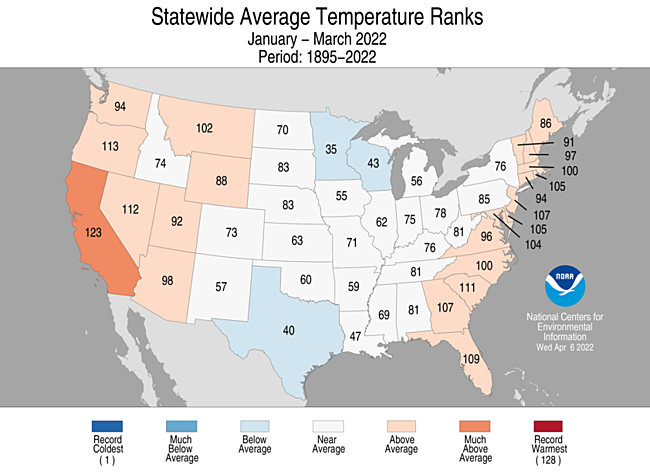
- The year-to-date (January-March) average contiguous U.S. temperature was 36.3°F, 1.2°F above average, ranking in the middle third of the record.
- Temperatures were above average across much of the West and along the East Coast. California ranked sixth warmest for the January-March period. Temperatures were below average across portions of the Upper Mississippi Valley and the Deep South.
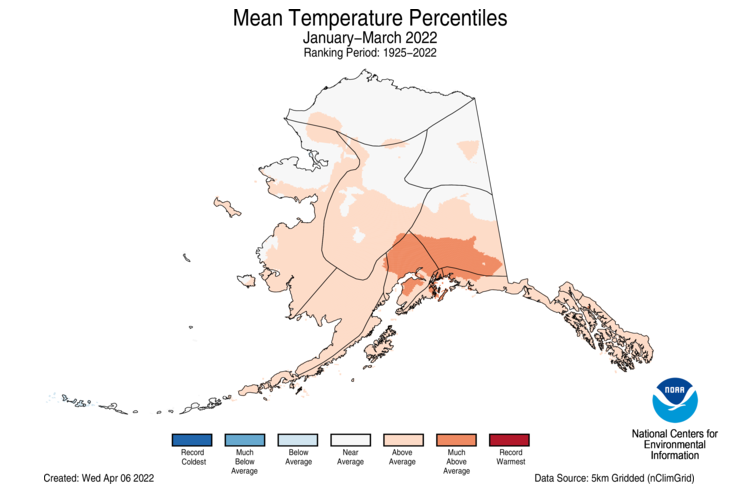
- The Alaska January-March temperature was 9.6°F, 3.7°F above the long-term average, ranking in the warmest third of the record for the state. Above-average temperatures were observed across much of the southern half of the state with the warmest departures from average occurring in portions of southcentral Alaska.
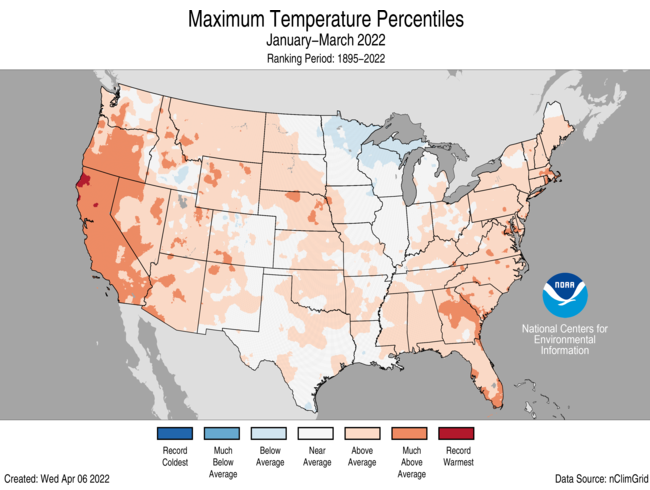
- The contiguous U.S. average maximum (daytime) temperature during January-March was 48.6°F, 2.5°F above the 20th-century average, ranking in the warmest third of the historical record. Above-average daytime temperatures were observed from the West Coast to parts of the Plains and from the central Gulf Coast to New England. California ranked third warmest and Oregon fourth warmest for this three-month period. Below-average daytime temperatures were present across parts of the northern Great Lakes.
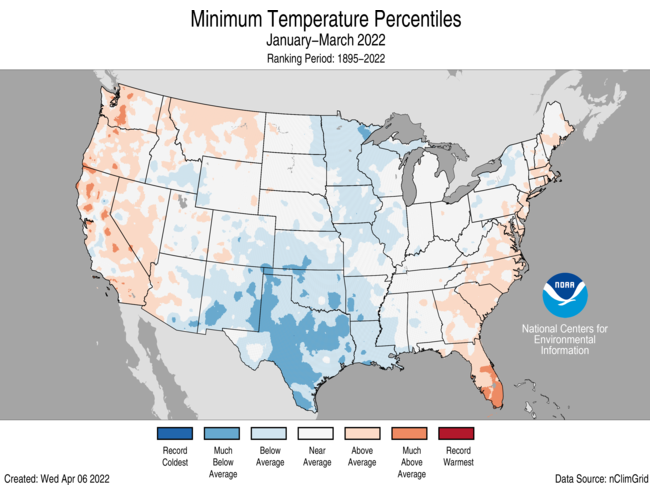
- The contiguous U.S. average minimum (nighttime) temperature during January-March was 24.0°F, 0.2°F below the 20th-century average, ranking in the middle third of the record. Above-average nighttime temperatures occurred across potions of the West and East Coast. Nighttime temperatures were below average from the Great Lakes to the Deep South, where Texas ranked 11th coldest for this three-month period.
- Based on REDTI, the contiguous U.S. temperature-related energy demand during January-March was 78 percent of average and was the 31st-lowest value on record.
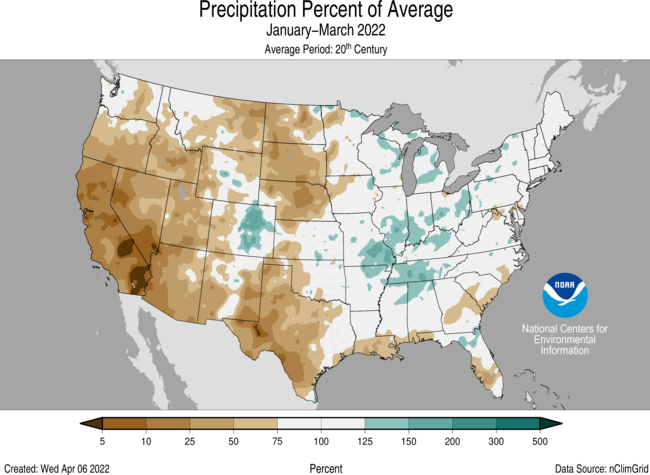
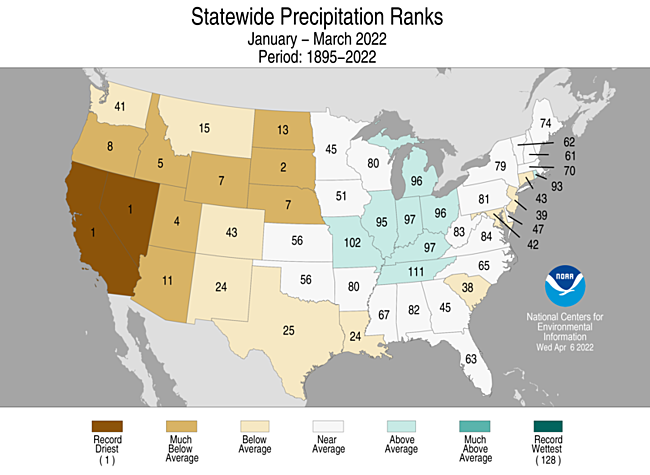
January-March Precipitation
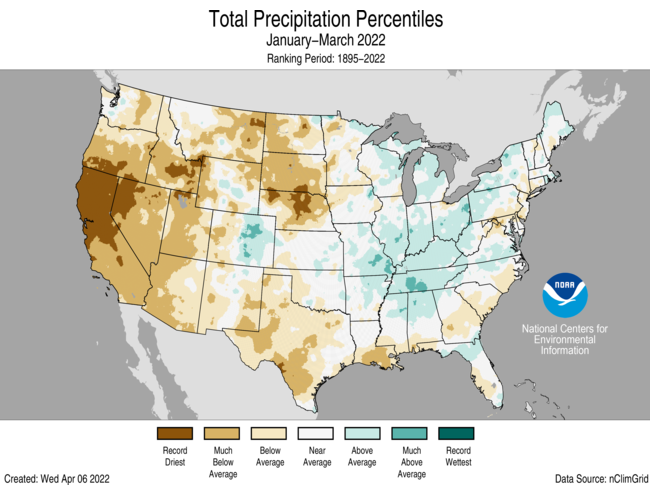
- The year-to-date precipitation total was 5.66 inches, 1.30 inches below average, ranking seventh driest in the January-March record.
- Precipitation was above average across eastern Colorado and from the Mid-Mississippi Valley to the Great Lakes and into the Northeast. Precipitation was below average across much of the West, northern Plains, Deep South and parts of the Southeast and Mid-Atlantic states during the January-March period. California and Nevada ranked driest on record while South Dakota ranked second driest for this three-month period.
- Precipitation averaged across Alaska for the January-March period was generally above average with the Southeast Interior and portions of the Panhandle regions ranking wettest on record.
- Wildfires during the first three months of 2022 were above average in both numbers of fires and number of acres consumed.
- Through March 29, 14,781 wildfires burned 517,839 acres across the U.S. This is 163 percent of the 10-year average (2011-2020) and 118 percent of average for the total number of acres consumed.
- The Eastland Complex wildfire scorched more than 54,000 acres southwest of Dallas. The fires destroyed at least 147 structures and were 100 percent contained as of March 31.
- Exacerbated by dry conditions, above-average temperatures and high winds, the NCAR wildfire near Boulder, Colorado, spread rapidly on March 26 forcing the evacuation of nearly 20,000 people. This wildfire scorched approximately 200 acres. No structures were damaged or injuries reported associated with this fire.
- A wildfire broke out in Sevier County, Tennessee, near the Great Smoky Mountain National Park on March 30 and burned at least 3,700 acres, damaged at least 100 structures and injured at least three people. More than 11,000 homes were evacuated during this event.
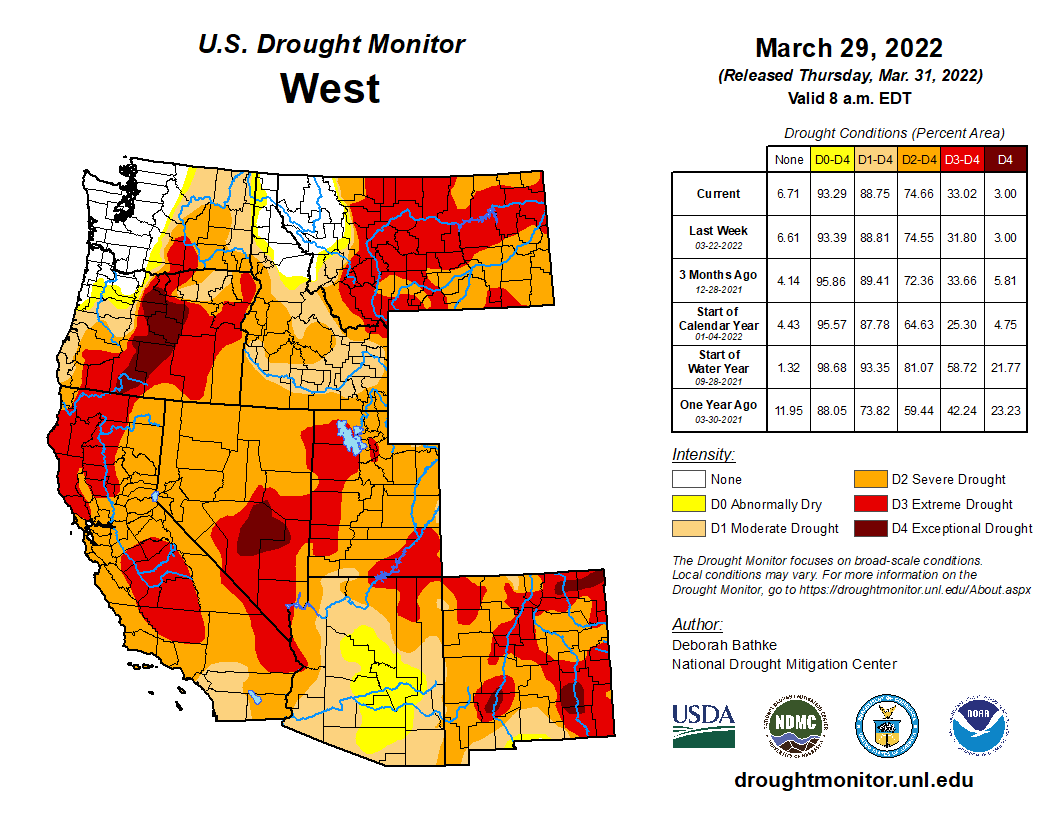
- The current multi-year drought across the West is the most extensive and intense drought in the 22-year history of the U.S. Drought Monitor. Precipitation deficits during the first three months of 2022, across parts of the western U.S., are at or near record levels. As the climatological wet season ends across portions of the West, with below average snow cover and reservoirs at or near record-low levels, concerns for expanding and intensifying drought and water resource deficits are mounting.
- Water year (October-September) precipitation received through March 31 was much-below normal across portions of the West, Southwest, central and southern Plains, Gulf Coast and central East Coast. In Arizona, Lake Powell water levels have dipped below a critical threshold to generate hydroelectric power at full capacity. At the end of March, the lake level was approximately 3523 feet deep, which is 25% of capacity — the lowest level observed on the lake since the Glen Canyon Dam was built in the early 1960s. If the lake drops an additional 33 feet, it will reach the “minimum power pool” required to generate electricity. Portions of the West rely on this reservoir to provide them with electricity, irrigation and drinking water throughout the year.
Extremes
-
The U.S. Climate Extremes Index (USCEI) for the year-to-date was 4 percent above average and ranked in the middle third of the 113-year period of record. Extremes in dry PDSI were third highest on record with all other indicators near or below average for this three-month period. The USCEI is an index that tracks extremes (falling in the upper or lower 10 percent of the record) in temperature, precipitation and drought across the contiguous United States.
- On the regional scale, the Northwest and West regions had CEI values which were above average. For the Northwest, extremes in dry PDSI, 1-day precipitation and the number of days without precipitation were at or near record high extent. Across the West, extremes in warm maximum temperatures, dry PDSI values and days without precpitation were above average. Across the Upper Midwest, CEI values were almost 50 percent below average and ranked in the lowest third of the 113-year period of record.
Billion Dollar Disasters
- During the first quarter of 2022, no new billion-dollar weather and climate disasters have been identified, although several events are currently being evaluated.
- In early April 2022, NCEI added an additional 13 historical weather and climate events which, through inflation and review, surpassed the billion-dollar threshold.
- To date, the U.S. has sustained 323 weather and climate disasters since 1980 where overall damages/costs reached or exceeded $1 billion (based on Consumer Price Index adjustment to 2022).
- The total direct cost for these 323 events exceeds $2.195 trillion.
Regional Highlights
These regional summaries were provided by the six Regional Climate Centers and reflect conditions in their respective regions. These six regions differ spatially from the nine climatic regions of the National Centers for Environmental Information.
Northeast Region (Information provided by the Northeast Regional Climate Center)
March was warmer than normal and generally drier than normal in the Northeast.
- Temperature
The Northeast’s March average temperature of 36.8 degrees F was 2.3 degrees F warmer than normal. Average temperature departures for the 12 Northeast states ranged from 1.9 degrees F above normal in Maine to 3.1 degrees F above normal in Delaware and Maryland. This March ranked among the 20 warmest Marches since recordkeeping began in 1895 for five states: Delaware and Rhode Island, 15th warmest; New Jersey, 16th warmest; and Maryland and Massachusetts, 19th warmest.
- Precipitation
During March, the Northeast received 2.91 inches of precipitation, which was 82 percent of normal. Eleven of the twelve Northeast states experienced a drier-than-normal March, with precipitation for all states ranging from 58 percent of normal in West Virginia, its 13th driest March, to 103 percent of normal in Maine.
- Drought
The U.S. Drought Monitor from March 1 showed 1 percent of the Northeast in severe drought, 1 percent in moderate drought, and 16 percent as abnormally dry. During March, areas of drought and abnormal dryness were trimmed in northern New England due to near- to above-normal precipitation, decent snowpack, and improving streamflow and groundwater levels. However, moderate drought was introduced and abnormal dryness persisted or expanded in southern parts of the Northeast where short-term precipitation deficits led to declining streamflow and soil moisture. The U.S. Drought Monitor from March 29 showed 1 percent of the Northeast in severe drought, 1 percent in moderate drought, and 25 percent as abnormally dry.
- Notable Weather
A powerful cold front moved across the Northeast on March 7. Wind gusts of up to 72 mph, with straight line winds of up to 90 mph in central New Jersey, downed trees and wires, snapped power poles, and damaged roofs and outbuildings. Tens of thousands of customers in the Northeast lost power, with National Weather Service in Boston noting that, “Some towns in western and central Massachusetts have 50 to 75 percent of residents without power…” A fatality occurred in western New York due to the storm. A storm on March 12 brought a mix of precipitation to the region. Several areas including western West Virginia, southwestern Pennsylvania, and central New York saw 8 to 12 inches of snow, with locally higher amounts of up to 20 inches in northern Vermont. Binghamton, New York, and Pittsburgh, Pennsylvania, each had one of their 10 snowiest March days with 10.6 inches of snow and 8.0 inches, respectively. Wind gusts of up to 64 mph also accompanied the storm. The snow, which fell at a rate of up to 2 inches per hour, and gusty winds led to difficult travel and multiple accidents including a pileup involving 73 vehicles in central Pennsylvania. On March 31, severe thunderstorms spawned two tornadoes and caused wind damage in Pennsylvania. An EF-2 tornado in Armstrong County snapped/uprooted hundreds of trees and destroyed two barns, while an EF-1 tornado in Bucks County downed trees and caused minor damage to buildings such as removing shingles. In addition, straight line winds of 80 to 90 mph in Lycoming County damaged roofs, blew out windows, and caused two barns to collapse.
- For more information, please visit the Northeast Regional Climate Center Home Page.
Midwest Region (Information provided by the Midwest Regional Climate Center)
- Temperature
The average temperature for the Midwest was 36.7 degrees F (2.6 degrees C) for March, which was 0.2 degrees F (0.1 degrees C) below the 1991-2020 normal. While the Midwest monthly temperature was near-normal, temperatures throughout the month oscillated between warm and cold extremes week by week. This temperature “see-saw” resulted in 139 daily high maximum temperature records from March 1-7 followed by 129 daily low maximum temperature records from March 10-13. An additional 125 low maximum temperature records occurred March 27-31. Statewide temperatures were mixed across the region, with temperature departures above normal across the lower Midwest and below normal across the upper Midwest. The monthly average temperature ranged from 2.1 degrees F (1.2 degrees C) above normal in Ohio to 2.7 degrees F (1.5 degrees C) below normal in Minnesota. Monthly maximum and minimum temperatures followed a similar geographic pattern.
- Precipitation
Average Midwest precipitation for March was 3.26 inches (83 mm), which was 0.69 inches (18 mm) above normal, or 127 percent of normal. Precipitation was above normal for most of the Midwest, except for the extreme northwestern and southeastern portions of the region. Statewide precipitation totals ranged from 1.49 inches (38 mm) above normal in Illinois and Wisconsin to 1.06 inches (27 mm) below normal in Kentucky. Based on preliminary data, Wisconsin had the 6th (tied) and Michigan had the 7th wettest March on record (since 1895). Green Bay, Wisconsin recorded its wettest March in 136 years with 6.03” for the month. A total of 16 stations across the Midwest set a new monthly maximum precipitation record for March while 489 daily high precipitation records were set or tied.
- Drought
Drought conditions improved throughout March with reductions in both the intensity and spatial extent. By month’s end, 10 percent of the region was in moderate (D1) or severe (D2) drought with 19 percent abnormally dry. Drought and dry conditions were confined to the northwest portion of the Midwest with the largest affected area centered over southern Wisconsin.
- Snowfall
March snowfall in northwest Missouri and Kentucky ranged from 2-7.5 inches (5.1-19.1 cm), which was up to 5 inches (12.7 cm) above normal for the month. Most of the Midwest, however, had near- or below-normal snowfall for March. Across the upper Midwest, monthly totals ranged from less than 1 inch (2.5 cm) in southern Minnesota to about 10-20 inches (25.4-50.8 cm) across the upper Great Lakes. A wide swath from southern Missouri to Ohio recorded less than 1 inch (2.5 cm). There were 172 daily high snowfall records across the Midwest, with most from the lower Midwest where little snowfall typically occurs in March.
- Flooding
Above-normal precipitation paired with saturated soils resulted in periodic minor to moderate river flooding throughout March. The most affected areas included the Wabash River and tributaries in Illinois, Indiana, and Kentucky and also the Red River of the North in western Minnesota.
- Notable Weather Events
A tornado outbreak on March 5-6 affected Iowa, Illinois, and surrounding areas with over 60 reported tornadoes. In Iowa, three supercells produced 10 confirmed tornadoes, including an EF-4 tornado that killed six people and injured five others as it cut a 69.5 mile (112 km) path through Madison, Warren, Polk, and Jasper Counties. Locations in Iowa saw hail sizes ranging from golf ball to baseball diameters. Twenty wind reports were in excess of 65 mph (105 kph), and a peak wind gust of 81 mph (130 kph) was recorded at the Rockford, Illinois Airport.
- For further details on the weather and climate events in the Midwest, see the weekly and monthly reports at the Midwest Climate Watch page.
Southeast Region (Information provided by the Southeast Regional Climate Center)
- Temperature
Temperatures were above average across much of the Southeast region for the month of March. Monthly mean temperatures were at least 2 degrees F (1.1 degrees C) above average for over 70 percent of the 214 long-term (i.e., period of record equaling or exceeding 50 years) stations across the region. There were at least eight stations that observed monthly mean temperatures that were ranked within their five warmest values on record, including Fort Myers, FL (1902-2022; 1st warmest). Maximum temperatures ranged from 6.6 degrees F (3.7 degrees C) above normal in Lynchburg, VA (1896-2022) to 1.1 degrees F (0.6 degrees C) below normal in San Juan, PR (1898-2022). Daily temperature minimums ranged from 6.4 degrees F (3.6 degrees C) above normal in Melbourne, FL (1942-2022) to 1.7 degrees F (0.9 degrees C) below normal in Mobile, AL (1871-2022). The warmest weather of the month occurred from the 3rd – 7th, with much of the region recording mean temperatures more than 15 degrees F (8.3 degrees C) above normal. Daily maximum temperatures exceeded 80 degrees F (27 degrees C) across portions of every state. Charlotte, NC (1878-2022) reached its earliest 85 plus degrees F (29 degrees C) day on the 3rd. There were 31 long-term stations that observed a daily maximum temperature record on the 6th, including Lumberton, NC (1903-2022; 86 degrees F (30 degrees C)) and Sarasota, FL (1912-2022; 90 degrees F (32 degrees C)), which tied its second warmest March maximum temperature on record. In contrast, the coldest weather of the month across the Southeast occurred on the 13th through the 15th, as the circulation around a departing mid-latitude cyclone ushered in cold air from Canada. Daily minimum temperatures fell below 30 degrees F (-1.1 degrees C) across portions of every state, including Florida. Some locations even fell below 20 degrees F (-6.7 degrees C), including Asheville, NC (1869-2022) at 16 degrees F (-8.9 degrees C) and Augusta, GA (1873-2022) at 19 degrees F (-7.2 degrees C), which tied its fourth coldest March minimum temperature on record.
- Precipitation
Precipitation was variable across much the Southeast region for March, with a few wet and dry extremes reported. The driest locations were found across southern Florida, eastern Georgia, eastern South Carolina, and eastern North Carolina. Monthly precipitation totals ranged from 70 to less than 25 percent of normal across these locations. Fort Myers, FL (1902-2022) only observed 0.43 inches (11 mm) of precipitation, more than 1.5 inches (38 mm) below normal. In contrast, the wettest locations for the month were located across Puerto Rico, Alabama and northern Florida. Precipitation totals ranged from 100 to 200 percent of normal. Birmingham, AL (1895-2022) measured 10.98 inches (279 mm) of precipitation for the month, over 5 inches (127 mm) above normal, and Gainesville, FL (1890-2022) observed its wettest March on record at 12.59 inches (320 mm) of precipitation, more than 9 inches (229 mm) above normal. On the 22nd, a line of thunderstorms produced moderate rainfall across Alabama, with 24-hour precipitation totals exceeding 4 inches (102 mm). Tuscaloosa, AL (1948-2022) reported 3.56 inches (90 mm) of rainfall. As a result, emergency management officials in Tuscaloosa County, AL reported that several roadways were impassible or washed out due to flash flooding. The most snowfall for the month was observed at the Clintwood COOP station in Virginia at 10.8 inches (274 mm).
- Drought
Drought conditions slightly intensified across the Southeast region, except for Puerto Rico in March. At the beginning of the month, an area of moderate drought (D1) stretched across eastern North Carolina down into eastern Georgia and connected with an expanded area of moderate drought in northern Florida. Abnormally dry conditions (D0) ringed these areas as well and included most of the Florida Peninsula. By the end of the month, drought conditions improved across northern Florida, but expanded throughout southern Georgia. A pocket of severe drought (D2) developed along the North Carolina coast and abnormally dry conditions expanded throughout northern Virginia. Drought conditions remained the same across Puerto Rico for the month, with pockets of moderate drought (D1) ringed by an area of abnormally dry conditions (D0) in the southern part of the Island and pockets of moderate drought (D1) to severe drought (D2) across the Virgin Islands.
- Agriculture
Farmers in the citrus growing region of Florida had to run irrigation due to dry conditions. Rainfall in the northern part of Florida however, benefited newly planted crops. The freezing temperatures on March 12th-14th damaged early blooming fruit and early season blueberries in Georgia. This freeze also damaged some strawberry crops in Alabama, but they are expected to recover by harvest. Row crop farmers are behind schedule in preparing for spring planting, as frequent rains throughout the month saturated many fields throughout the state. Despite the dry conditions in over half of South Carolina, positive pasture growth helped keep livestock conditions good, while limiting the amount of supplemental hay needed. The warmer temperatures in late winter and early spring brought the cherry blossoms to a peak bloom on March 21st, ten days earlier than normal.
- Severe Weather & Other Impacts
There were 273 reports of severe weather across the Southeast during March, which is 138 percent of the median monthly frequency of 198 reports during 2000-2019. There were 45 confirmed tornadoes reported for the month (15 EF-0, 24 EF-1, 5 EF-2 and 1 EF-3), 237 percent of the monthly average of 19. The strongest tornado occurred in Washington County, FL and was rated EF-3, with winds of 150 mph (67 m/s) on March 31st. This tornado destroyed a double-wide home and swept away a single-wide home. Unfortunately, there were two fatalities in the double-wide home, and one person was injured in the single-wide home when he was thrown into a tree line grasping his mattress. A brief EF-1 tornado in Durham County, NC with winds of 100 mph (45 m/s) also occurred on March 31st. This was only the second tornado to occur in Durham County, NC for the month of March and the ninth one to occur overall since records began in 1950. There were 28 reports of hail for the month, with the largest being hen-egg sized (2.00 inches) in Seminole County, FL on March 16th. There were 193 wind reports for the month, which is 179 percent of the average (108 reports). Straight line winds of 75 mph (34 m/s) were observed in Citrus County, FL on the 12th, causing significant tree damage, downed powerlines and two injuries.
- For more information, please visit the Southeast Regional Climate Center Home Page.
High Plains Region (Information provided by the High Plains Regional Climate Center)
The dryness that has gripped parts of the region over the winter continued into March. This led to the intensification and growth of drought across South Dakota, Nebraska, and western Kansas. All three states ended the month with 45 percent of the state in severe drought (D2). In preparation for the continuation of the drought, cattle herds are being culled in Nebraska. Feedlots in the state are now near-record numbers, which is unusual for this time of the year.
Repercussions from the drought of 2021 are becoming noticeable in North Dakota. Many cattle producers within the state rely on water from surface water sources such as stock ponds. These water sources were dried up or contained substances toxic to livestock during the drought of previous years. As a result of the lack of snowpack this winter for recharge or the dilution of toxic substances, there are concerns about the availability of water this year. Ranchers within the state have been encouraged to find other sources of water to reduce the potential for issues this year.
Another side effect of the dryness across the region is the increased risk of wildfires. Optimal conditions for wildfires across western Kansas throughout the month led the governor to declare a state of disaster. Several large fires broke out in the southern part of the state, with the largest reported to the northwest of Wichita. Fires were also reported in Colorado, Nebraska, and South Dakota in the month of March.
Opposite of the dryness, eastern North Dakota has been extremely wet. There are concerns about flooding along the Red River after numerous snowstorms this winter. Flooding in this region would lead to delays in planting, which could impact wheat output this year.
- Temperature
Temperatures were near normal for the month of March. Isolated pockets of 8 degrees F (4.4 C) below normal were observed in north-central Colorado. Meanwhile, pockets of above normal temperatures were recorded in northeastern Wyoming, northeastern South Dakota, and southwestern North Dakota.
Despite temperatures being near normal throughout the region, temperatures fluctuated during the month. Temperatures were well above normal on the 21st, reaching 80 degrees F (26.7 C) in the southern High Plains. The highest temperature was recorded in northwestern Kansas, with an observation of 93 degrees F (33.9 C) near Wallace. Opposite of these warm temperatures, much below normal temperatures were recorded from March 10th to 11th. Low temperatures of -25 degrees F (-31.7 C) were observed in the higher elevations of Colorado, South Dakota, and Wyoming. A brisk temperature of -40 degrees F (-40 C) was reported near Yellowstone National Park in Wyoming.
The much above normal temperatures have also coincided with high winds during the month. Red flag warnings were issued on many days in March in all states except North Dakota. Conditions were ripe for fires to break out on the 29th, which led the Storm Prediction Center to issue a rare extremely critical fire day.
- Precipitation
Precipitation was well below normal again in Nebraska and the Dakotas in March. Pockets of above-normal precipitation were present in eastern Colorado, eastern Kansas, southeastern Nebraska, and parts of Wyoming. The precipitation observed at these locations helped alleviate drought conditions, but deficits remain.
Despite large portions of the region observing below normal precipitation, only two locations ranked in the top 10 driest. Williston, North Dakota recorded 0.06 inches (1.5 mm) of precipitation to rank 5th driest, while Rapid City, South Dakota observed 0.25 inches (6.35 mm) which ranked 8th driest. Several locations have also started the year among the driest on record. In Nebraska, Valentine and Norfolk were the 2nd driest on record since January 1st. Williston and Rapid City also ranked in the top 10 driest since January 1st.
Above normal precipitation this month alleviated drought conditions. Several storms moved across eastern Kansas, which helped remove abnormally dry and improved drought conditions. Precipitation towards the end of the month slightly eased drought conditions in eastern Colorado, however, long-term dryness continues to impact the area. After a very wet March, Casper, Wyoming observed its 3rd wettest start to the year, with 3.29 inches (8.36 cm) of precipitation falling.
The region also experienced its first severe weather of the season. On the 29th, a storm progressed across eastern Kansas with 1 inch (2.54 cm) hail and 60 miles per hour (96.56 km/h) wind gusts. An EF-1 tornado was observed in Jefferson County, with minor damage reported.
- Drought
Persistent dryness that has plagued parts of the region continued into March. Conditions rapidly deteriorated across the western parts of Nebraska and South Dakota, while drought intensified in western Kansas.
Exceptional Drought (D4) was reintroduced to the region for the first time since November of 2021. Long-term dryness led to the expansion of D4 into southwestern Kansas and the slight expansion over the course of the month. Another dry month in Nebraska led to a 20 percent increase to severe drought (D2) and the introduction of extreme drought (D3) in the north-central part of the state. Drought conditions also intensified in South Dakota, with 46 percent of the state now experiencing D2. Despite the dryness plaguing the region, some areas received above normal precipitation which led to improvements. Beneficial precipitation in eastern Colorado eased conditions and led to a 24 percent reduction of D2 area coverage for the state. In eastern Kansas, abnormally dry conditions were significantly reduced. Throughout the rest of the region, other improvements and degradations were observed. According to the Climate Prediction Center’s U.S. Monthly Drought Outlook for April, drought development is likely in south-central Nebraska.
- For more information, please visit the High Plains Regional Climate Center Home Page.
Southern Region (Information provided by the Southern Regional Climate Center)
Drought intensified in Texas during March 2022, and wildfire and severe weather affected much of the region. Mississippi saw more tornadoes in the last ten days of March than in an entire average year.
- Temperature
March 2022 temperatures across the Southern Region were generally warmer than the long-term average, but cooler than the most recent three-decade period, 1991-2020. Tennessee's temperatures ranked 31st warmest on record, at 51.7 F. Most other states were slightly warmer than their long-term averages, except for Louisiana, whose 58.9 F was 61st coldest on record. The first triple-digit days occurred along the Rio Grande in Texas, with the highest value being 103 F at Rio Grande Village on March 30. The coldest weather was found on Mt. Leconte, Tennessee, where the temperature dropped to -4 F on March 13. The coldest low-elevation station was Pickett State Park, also in Tennessee, which reached 4 F on the same day. The temperature stayed above freezing for the entire month in extreme southern Texas, parts of coastal southeast Texas, and extreme southern Louisiana. Three March maximum temperature records were tied at long-term stations in Texas on March 28 or March 30.
- Precipitation
The region-wide precipitation was close to the long-term mean, but that statistic masked large variations across the region. Both Texas and Tennessee were relatively dry: Texas was 42nd driest, at 1.20 inches, while Tennessee was 48th driest, at 4.57 inches. In contrast, Mississippi was 35th wettest, at 6.89 inches, and Louisiana was 40th wettest, at 5.75 inches. The wettest station overall was at Flowood, Mississippi, near Jackson, at 12.12 inches, while Texas had 52 stations without measurable precipitation for the month. The largest single-day rainfall observed was 6.58 inches in Blanchard, near Shreveport Louisiana, on March 22. March 22 was also the day with the largest snowfall total in the Southern Region, with 9.5 inches just south of Amarillo, Texas, contributing to the region's largest monthly accumulation, 11.3 inches. Another storm brought widespread snow to Tennessee, the largest total being 7.5 inches on March 12.
- Drought/Flooding
Drought conditions continued to get worse in the Southern Region. Over 68% of the region was in drought on March 29, about the same as at the beginning of the month, but extreme or worse drought expanded from 21% to 29% and exceptional drought expanded from 0.4% to 5%. The worst drought was in Texas, with 88% of the state in drought, 71% in at least severe drought, 42% in at least extreme drought, and 7% in exceptional drought. Oklahoma had 34% in at least extreme drought and Louisiana had 31% in at least extreme drought. The primary impacts from the drought so far are agricultural, with most of the winter wheat crop in Texas and Oklahoma rated poor to very poor, ranchers still providing supplemental feed, and spring planting off to a difficult start. The dry weather has developed mostly over the past several months; the combination of dry conditions now and wet conditions during the first half of 2021 have led to an enhanced risk of wildfire, with several large fires during March (see below).
- Notable Weather
Several severe weather events affected the Southern Region during March. On March 7, eight tornadoes touched down in Arkansas, including one EF2 tornado that injured six and an EF1 tornado that injured one. There were also ten reports of damaging winds and one report of hail; another hail report was made in Oklahoma. March 12 produced some hail in Louisiana. March 14 produced two tornadoes in Texas, but with no injuries, along with 23 hail reports. On March 17-18 there were eight reports of hail in Oklahoma, the largest being 2 inches, and three reports of damaging winds; Mississippi produced one hail report and three reports of damaging winds.
Most of the tornadoes in March occurred during two tornado outbreaks late in the month. There were 34 tornadoes on March 21, all but two of which touched down in Texas. Five of them had damage tracks of 25 miles or longer. The strongest tornado was an EF3 that struck Jacksboro, northwest of Fort Worth, injuring nine. Eight tornadoes were rated EF2, which combined accounted for one death (in a tornado that touched down in Texas and crossed Lake Texoma into Oklahoma) and 48 injuries, and two of the EF1 tornadoes injured a total of five. The storm system moved east the next day, producing 32 more tornadoes. Most of the tornadoes were in Mississippi, but two struck Louisiana, including one EF3 that moved through eastern New Orleans, killing one person and injuring two others. There were also numerous reports of damaging winds, mostly in Texas, Louisiana, and Mississippi.
Eight days later, another severe weather outbreak produced tornadoes in all six states: one in Oklahoma, four in Texas, two in Arkansas (including an EF3), three in Tennessee, fifteen in Louisiana, and 23 in Mississippi. There were five injuries, all in Mississippi. In addition to the tornadoes, damaging winds were common: 16 reports were received from Texas, 4 from Oklahoma, 12 from Arkansas, 28 from Louisiana, 43 from Mississippi, and 22 from Tennessee. March 30-31 also produced a total of 6 hail reports. Overall, the last ten days of March produced more tornadoes in Mississippi than in a normal year.
The latter part of March also saw substantial wildfire activity in Texas and Oklahoma, as dry windy conditions combined with large amounts of dry fuel to allow fires to spread rapidly. Five wildfires or sets of exceeded 30,000 acres: the Eastland Complex in west-central Texas, the Crittenburg Complex on Fort Hood in central Texas, the Canadian River Bottom fire in the Texas Panhandle, the Washita River fire that threatened the town of Durham, Oklahoma, and the Borrega Fire in South Texas. Two firefighters lost their lives, one in Texas and one in Oklahoma. At the end of the month, a wildfire outbreak occurred in western Tennessee, triggered by dry conditions and very strong winds; the worst of the fires burned nearly 3000 acres and affected over 300 structures.
- For more information, please visit the Southern Regional Climate Center Home Page.
Western Region (Information provided by the Western Region Climate Center)
The trend of dry and warm conditions observed during the past several months continued through March for California, the Great Basin, and parts of the Northern Rockies with below normal precipitation and above normal temperatures; record dryness was found in these areas when considering the January-March 2022 period which led to an expansion of drought conditions. More active weather was found in the Four Corners states with some areas seeing above normal precipitation and below normal temperatures.
- Temperature
Above normal temperatures were widespread throughout the West Coast states and further inland into Idaho and Montana with anomalies in the range of +2 to +4 degrees Fahrenheit above normal. Some notable locations in the top ten percent of all years include Dallesport, Washington at 52.2 degrees Fahrenheit (11.2 degrees Celsius), +5.8 degrees Fahrenheit (+3.2 degrees Celsius) above normal and warmest on record since 1949, Redmond, Oregon at 43.8 degrees Fahrenheit (6.6 degrees Celsius), +2.5 degrees Fahrenheit (+1.5 degrees Celsius) above normal and third warmest on record, and Reno, Nevada at 49 degrees Fahrenheit (9.4 degrees Celsius), +2.4 degrees Fahrenheit (+1.3 degrees Celsius) above normal and fifth warmest on record. Below normal temperatures were found in eastern Utah, eastern Arizona, and throughout New Mexico with departures generally in the range of -1 to -2 degrees Fahrenheit below normal.
- Precipitation
Below normal precipitation was found generally in the same regions that experienced above normal temperatures with the driest anomalies (5-50 percent of normal) in California, western Nevada, southern Oregon, southern Idaho, and eastern Montana. Dillon, Montana recorded 0.03 inches (0.76 millimeters), six percent of normal, for the second driest March on record since 1940. Burley, Idaho logged 0.10 inches (2.54 millimeters), ten percent of normal, making it the third driest since 1949. Reno, Nevada received 0.03 inches (0.76 millimeters), four percent of normal, coming in at the fourth driest on record since 1937. San Francisco, California recorded 0.48 inches (12.19 millimeters), 15 percent of normal, for the 13th driest dating all the way back to 1850. Scattered areas of above normal precipitation were found in western Washington, northern Idaho, northwest Montana, central Nevada, northeast Arizona, and central New Mexico. One noteworthy observation with a wet anomaly was at Winnemucca, Nevada where 1.32 inches (33.53 millimeters) of precipitation fell making it the tenth wettest since records began in 1950.
- Drought
According to the US Drought Monitor at the end of March 89 percent of the West was in drought with 30 percent of the West in extreme (D3) or exceptional (D4) drought. The dry and warm March combined with the poor snowpack conditions led to drought expansion during March in parts of California, Oregon, Idaho, southwest Montana, Utah, and New Mexico. Drought improvements were found in northern Oregon, Washington, northern Idaho, and northwest Montana.
- Alaska Summary
Above normal temperatures were found nearly everywhere in Alaska with the greatest warm anomalies of about 5-7 degrees Fahrenheit above normal in the southcentral, western, and southwestern parts of the state. The monthly mean temperature at Anchorage was 32.3 degrees Fahrenheit (0.11 degrees Celsius), +6.4 degrees Fahrenheit (+3.5 degrees Celsius) above normal and seventh warmest on record since 1952. Utqiagvik was at -6 degrees Fahrenheit (-21.1 degrees Celsius), +4.5 degrees Fahrenheit (+2.5 degrees Celsius) above normal for the tenth warmest dating back to 1902. Precipitation was above normal for the southern half of Alaska, including the panhandle, and below normal in the northern half of the state. Kodiak logged 10.41 inches (264 millimeters), 216 percent of normal, for the second wettest since 1931 and Juneau recorded 5.66 inches (144 millimeters), 154 percent of normal, making it the tenth wettest on record since 1937.
- Hawaii Summary
Precipitation was below normal throughout the Hawaiian Islands with parts of Oahu, Molokai, Maui, and the Big Island seeing less than 50 percent of normal for the month. Kahului received 0.19 inches (4.83 millimeters), seven percent of normal, making it the fifth driest on record dating back to 1905. Hilo logged 4.31 inches (109 millimeters), 34 percent of normal, for the 12th driest on record. Temperatures were above normal across the entire region with Hilo seeing its warmest on record at 75.1 degrees Fahrenheit (23.9 degrees Celsius), +3.2 degrees Fahrenheit (+1.7 degrees Celsius) above normal. The warm and dry conditions led to expansion of drought with up to two category degradations in the US Drought Monitor with 74 percent of Hawaii in moderate drought (D1) or worse.
- Significant Events
Early season wildfire in the Front Range of Colorado: The NCAR fire ignited on March 26 in the foothills just south of Boulder, Colorado. The fire burned nearly 200 acres and forced evacuations of nearly 20,000 people and 8,000 homes. Gusty winds fueled rapid spread for a short time when the fire first ignited and snow remaining on the ground played a factor in helping to reduce and stall the spread of the fire.
- For more information, please go to the Western Regional Climate Center Home Page.