National Overview

February Highlights


February Temperature

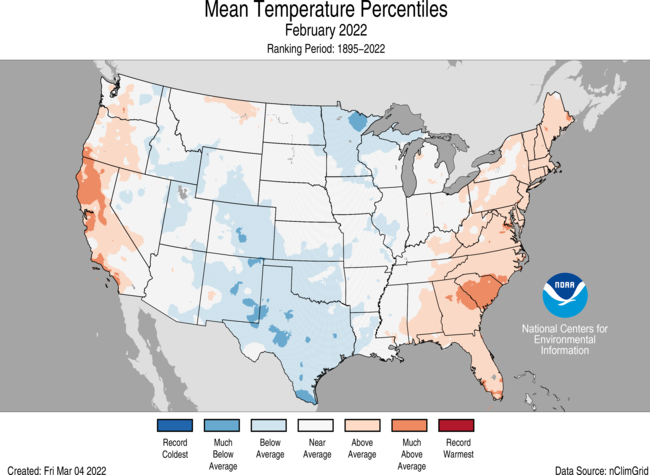
- The average contiguous U.S. temperature during February was 33.8°F, 0.1°F below the 20th-century average, ranking in the middle third of the 128-year period of record.
- Temperatures were below average across portions of the Upper Mississippi Valley as well as from the central Rockies to the Gulf Coast. Temperatures were above average across portions of the West Coast and from the Southeast to New England.
- The Alaska statewide February temperature was 8.6°F, 3.8°F above the long-term average. This ranked among the middle one-third of the 98-year period of record for the state.
- Temperatures were below average across parts of the North Slope while above-average temperatures were observed across the southern third of the state. King Salmon ranked fifth-warmest while Anchorage and Kodiak each had their sixth-warmest February on record.
- Bering Sea ice extent in February was the highest value observed since 2013, but fell rapidly the last 10 days of the month and was slightly below the 1991-2020 median by March 2.
- The contiguous U.S. average maximum (daytime) temperature during February was 46.3°F, 1.5°F above the 20th-century average, ranking in the middle third of the historical record. Above-average maximum temperatures were observed across parts of the West, northern and central Plains and from Florida to New England. Below-average daytime temperatures occurred across portions of the Rockies, South and Great Lakes. California ranked 10th warmest on record for maximum temperature.
- The contiguous U.S. average minimum (nighttime) temperature during February was 21.2°F, 1.6°F below the 20th-century average, ranking in the coldest third of the record. Above-average minimum temperatures were observed across portions of the East Coast. Below-average minimum temperatures dominated across much of the West, Plains, Midwest and Great Lakes. Texas ranked 11th coldest for nighttime temperatures during February.
- As of March 8, there were 3,165 record warm daily high (1,867) and low (1,298) temperature records in February, which was about 65 percent of the 4,870 record cold daily high (2,423) and low (2,447) temperature records observed during February.
- Based on NOAA's Residential Energy Demand Temperature Index (REDTI), the contiguous U.S. temperature-related energy demand during February was 20 percent below average and the 39th-lowest value in the 128-year period of record.
February Precipitation

- The February precipitation total for the contiguous U.S. was 1.73 inches, 0.40 inch below average, and ranked in the driest third of the historical period of record.
- Precipitation was above average from the Mid-Mississippi Valley to New England. Ohio had its sixth-wettest February. Precipitation was below average across most of the West and portions of the Plains, Southeast and Mid-Atlantic. California and Nebraska each had their second-driest February with Nevada ranking third driest.
- A Category 4 atmospheric river event brought significant rainfall, flooding and avalanche concerns to portions of Oregon and Washington during February 27-28.
- The state of Alaska, as a whole, ranked as the wettest February in the 98-year record. Juneau had its wettest February following its wettest January on record. King Salmon also experienced its wettest February on record, while Anchorage ranked second-wettest. Snowpack was above normal across most of the state.
- According to the March 1 U.S. Drought Monitor report, 59.2 percent of the contiguous U.S. was in drought, up nearly 4 percent from the beginning of February. Drought conditions expanded or intensified across portions of the northern and central Plains, as well as across parts of the West, Midwest, Great Lakes and from Florida to the Carolina coast. Drought contracted on the Big Island of Hawaii, but expanded across the islands of Kauai and O’ahu. Drought severity lessened across portions of the southern Plains and across Puerto Rico.
Winter Highlights


December-February Temperature

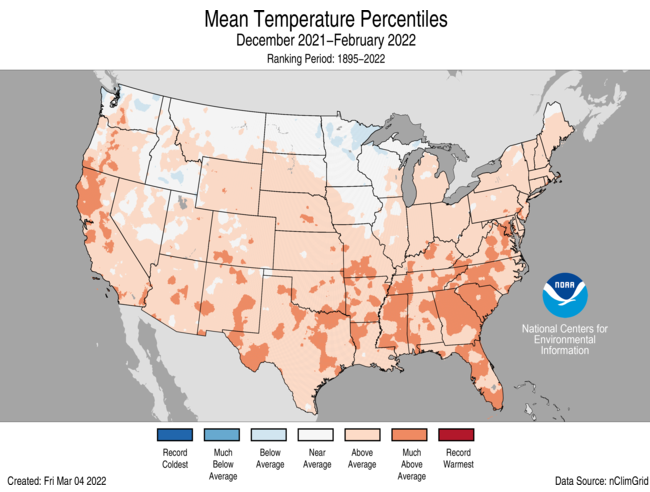
- The winter (December-February) average contiguous U.S. temperature was 34.8°F, 2.5°F above average, ranking in the warmest third of the winter record.
- Winter temperatures were above average across much of the Lower 48 with Georgia and South Carolina each experiencing their seventh-warmest winter on record. Temperatures ranked near average from the Pacific Northwest to the western Great Lakes with no states ranking below average for the winter season.
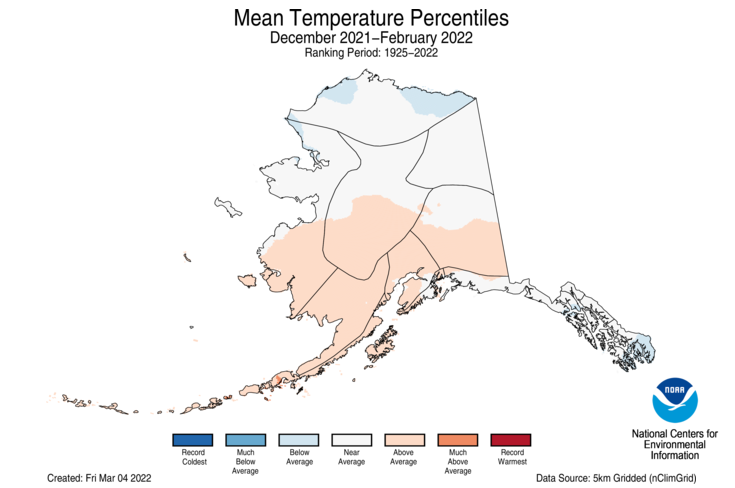
- The Alaska December-February temperature was 6.3°F, 2.7°F above the long-term average, ranking among the middle one-third of the 97-year record. Above-average temperatures were observed across the Aleutians, Bristol Bay, Cook Inlet and the southern half of the West Coast, Central Interior and Southeast Interior regions. Temperatures were below average across portions of the North Slope and the southern Panhandle.
- The contiguous U.S. average maximum (daytime) temperature during December-February was 46.4°F, 3.7°F above the 20th-century average, ranking eighth warmest in the historical record. Above-average temperatures were observed across most of the Lower 48 with Oklahoma ranking second warmest and Arkansas, third warmest on record. No states across the Lower 48 ranked below average for the winter season.
- The contiguous U.S. average minimum (nighttime) temperature during December-February was 23.1°F, 1.4°F above the 20th-century average, ranking in the warmest third of the record. Above-average temperatures were observed across parts of the West and from the Gulf Coast to the Northeast. Nighttime temperatures were below average across parts of the Upper Mississippi Valley and central Plains.
- Based on NOAA's Residential Energy Demand Temperature Index (REDTI), the contiguous U.S. temperature-related energy demand during the winter season was 45 percent of average and the 15th-lowest value in the 127-year period of record.
December-February Precipitation
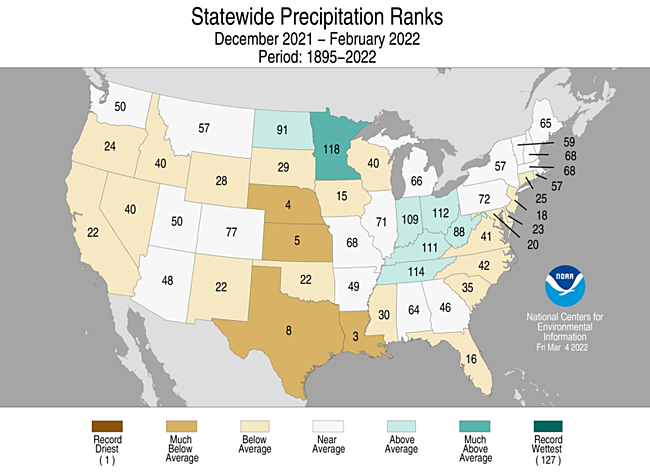
- The winter precipitation total for the contiguous U.S. was 5.76 inches, 1.03 inches below average, and ranked as the 12th-driest winter in the 127-year period of record.
- Precipitation was above average across parts of the Upper Mississippi, Ohio, and Tennessee valleys. Minnesota had its 10th-wettest winter. Precipitation was below average across portions of the West, central and southern Plains, Gulf Coast and across parts of the Southeast and Mid-Atlantic. Louisiana had its third-driest winter on record with Nebraska ranking fourth driest and Kansas, fifth driest.
- Climatologically speaking, winter is the wet season across much of the western U.S. If the dry conditions experienced in January and February across portions of the West were to continue into March and April, insufficient water resources may result during the dry season (summer), as well as an increased potential for drought intensification and wildfires in the fall.
- Lake Powell, the second-largest reservoir in the U.S., is nearing its lowest water level since it was filled more than 50 years ago. By mid-March, the water level is expected to drop below 3,525 feet above sea level, threatening the region's water supply and ability to generate hydropower.
- Five regions in Alaska — Bristol Bay, West Coast, North Slope, Northeast Interior and Southeast Interior — ranked wettest on record for the winter season, contributing to a record-wet winter for the state of Alaska, eclipsing the previous record set in 1928-29. Nome experienced its wettest winter since 1943-44 and King Salmon had its wettest winter on record.
Extremes
-
The U.S. Climate Extremes Index (USCEI) for the winter season was 26 percent above average and ranked in the middle third of the 113-year period of record. Extremes in warm maximum temperatures, dry PDSI values and extremes in 1-day precipitation each contributed to this elevated CEI value for this season. The USCEI is an index that tracks extremes (falling in the upper or lower 10 percent of the record) in temperature, precipitation and drought across the contiguous United States.
- On the regional scale, the Northwest and Southeast regions had CEI composite values that were above average for the winter season. Across the Northwest, extremes in dry PDSI across the eastern portion of the region were juxtaposed with elevated extremes in 1-day precipitation along the Pacific Coast. In the Southeast, extremes in warm maximum temperature as well as extremes in 1-day precipitation were elevated.
Regional Highlights
These regional summaries were provided by the six Regional Climate Centers and reflect conditions in their respective regions. These six regions differ spatially from the nine climatic regions of the National Centers for Environmental Information.
Northeast Region (Information provided by the Northeast Regional Climate Center)
February featured large temperature swings and multiple storms that produced a mix of precipitation types, with the month wrapping up on the warm side of normal for much of the Northeast.
- Temperature
The Northeast’s February average temperature of 28.1 degrees F was 1.8 degrees F warmer than normal. February average temperatures for the 12 Northeast states ranged from 0.7 degrees F above normal in West Virginia to 3.6 degrees F above normal in Maine and New Hampshire. This February ranked among the 20 warmest Februarys on record for eight of the Northeast states: New Hampshire, 11th warmest; Maine, 12th warmest; Massachusetts and Rhode Island, 14th warmest; Vermont, 18th warmest; Delaware and New Jersey, 19th warmest; and Connecticut, 20th warmest. The winter average temperature in the Northeast was 27.5 degrees F, which was 0.7 degrees F warmer than normal. Winter average temperatures for the 12 Northeast states ranged from 0.1 degrees F above normal in New York to 1.7 degrees F above normal in Maryland. This winter ranked among the 20 warmest winters on record for six states: Maryland, 12th warmest; Delaware and Rhode Island, 15th warmest; Massachusetts and New Jersey, 16th warmest; Connecticut, 18th warmest.
- Precipitation
February precipitation in the Northeast totaled 3.31 inches, which was 120 percent of normal. Nine of the 12 Northeast states were wetter than normal, with precipitation for all states ranging from 58 percent of normal in Delaware, its 17th driest February on record, to 140 percent of normal in Rhode Island. This February was Vermont’s 19th wettest on record. The Northeast’s winter precipitation totaled 8.58 inches, which was 87 percent of normal. Winter precipitation for the 12 Northeast states ranged from 65 percent of normal in New Jersey to 98 percent of normal in West Virginia. This winter ranked among the 20 driest winters on record for four states: New Jersey, 11th driest; Maryland, 12th driest; Connecticut, 15th driest; and Delaware, 18th driest.
- Drought
The U.S. Drought Monitor from February 1 showed 1 percent of the Northeast in severe drought, 1 percent in moderate drought, and 16 percent as abnormally dry. There were only a few changes in conditions during February, with abnormal dryness easing in south-central Pennsylvania and introduced in northwestern New York. Drought and abnormal dryness persisted in northern New England where long-term precipitation deficits exist, while abnormal dryness lingered in northeastern Delaware, eastern Pennsylvania, southern/northwestern New Jersey, and southeastern New York due primarily to short-term precipitation deficits and reduced streamflow. The U.S. Drought Monitor from March 1 showed 1 percent of the Northeast in severe drought, 1 percent in moderate drought, and 16 percent as abnormally dry.
- Notable Weather
February featured large temperature swings and storms that produced a mix of precipitation types. From February 3 to 4, waves of low pressure moving along a slow-moving frontal boundary brought a mix of precipitation types to the Northeast. Locations that were on the cold side of the front, particularly an area stretching from western New York into the northern halves of Vermont and New Hampshire and across portions of Maine, saw the greatest snowfall totals of 12 to 18 inches. Areas to the south and east were on the warm side of the front at the storm’s onset, allowing more rain, freezing rain, and sleet to fall and limiting snowfall totals. For instance, Allegheny County (where Pittsburgh is located) in southwestern Pennsylvania saw rain, up to 0.35 inches of ice, and up to 5 inches of snow. Similarly, Lackawanna County (where Scranton is located) in northeastern Pennsylvania saw rain, up to 0.75 inches of freezing rain, and up to 0.5 inches of snow. The southeastern corner of the region including parts of southeastern Pennsylvania, Delaware, and Maryland saw rain and little, if any, ice or snow. Flooding, in some cases due to ice jams, was reported in parts of West Virginia, Pennsylvania, and southeastern New York. As the front crossed the region, Harrisburg, Pennsylvania, was at 37 degrees F while 20 miles away York, Pennsylvania, was at 59 degrees F, an unusually warm morning temperature for early February. On February 17, warm air moved into the Northeast ahead of an approaching low-pressure system, with some locations warming by as much as 40 degrees F compared to the previous day. Precipitation initially fell as rain, totaling 2 inches or less in most areas. Warm temperatures, rain, and snowmelt led to flooding, in some cases due to ice jams, in western parts of West Virginia, Pennsylvania, and New York. For instance, an ice jam caused water levels on the East Branch of the Ausable River in northern New York to spike to 15.19 feet, its third highest level on record, flooding vehicles and buildings, leaving some uninhabitable. The storm’s cold front moved across the region during the overnight hours of February 17 into the morning of February 18, causing temperatures to drop rapidly. For example, the National Weather Service office in State College, Pennsylvania, noted that Indiana, Pennsylvania, went from 61 degrees F to 37 degrees F in one hour. Behind the front, rain quickly changed to snow, producing light snowfall accumulations in some western and northern parts of the region. The front sparked thunderstorms as it pushed through parts of New Jersey and southeastern Pennsylvania. The system also produced winds gusts of up to 66 mph with locally higher gusts on Cape Cod, resulting in downed trees, wires, and scattered power outages. The next day, on February 19, a line of snow squalls associated with an Arctic front produced a brief period of heavy snow and gusty winds, creating whiteout conditions and a dangerous travel situation. For instance, 0.50 inches of snow fell in 20 minutes in Westchester County, New York. A few lightning strikes were noted as the squall moved through southeastern Massachusetts. Wind gusts of up to 63 mph were recorded along and behind the front. From February 24 to 25, another storm brought more mixed precipitation to the region. The greatest snow totals of 8 to 12 inches were in parts of New York, Massachusetts, and northern New England. Meanwhile, areas to the south saw rain, ice, and limited snowfall, with ice accumulations of 0.25 inches or greater from freezing rain in parts of Pennsylvania, Maryland, Delaware, and New Jersey. The icy conditions brought down trees and wires, closing roads and leading to scattered power outages, particularly in eastern Pennsylvania, northern/central New Jersey, and northern Delaware.
- For more information, please visit the Northeast Regional Climate Center Home Page.
Midwest Region (Information provided by the Midwest Regional Climate Center)
- Temperature
For the second consecutive month, below-normal temperatures dominated the Midwest. The average temperature for the region was 21.9 degrees F (-5.6 degrees C), which was 4.4 degrees F (2.4 degrees C) below the 1991-2020 normal. Cooler-than-normal temperatures were felt in all nine states, with average temperatures ranging from 1 degree F (0.6 degrees C) below normal in Kentucky to 9.5 degrees F (5.3 degrees C) below normal in Minnesota. Four stations in northeast Minnesota set a record for the coldest monthly minimum temperature. The average winter (December-February) temperature for the Midwest was 0.9 degrees F (0.5 degrees C) below normal, with areas in the upper Midwest up to 8 degrees F (4 degrees C) below normal and regions in the lower Midwest up to 4 degrees F (2 degrees C) above normal.
- Precipitation
February was wetter than normal for the Midwest, with sharp regional differences. Average Midwest precipitation was 2.73 inches (69 mm), which was 0.89 inches (23 mm) above normal, or 148 percent of normal. Preliminary data indicates Ohio had the 3rd wettest February on record while Iowa tied for the 5th driest. A persistent atmospheric pattern brought frequent storms across the lower Midwest and extreme upper Midwest, with a lack of precipitation in between. A large swath from southern Missouri through the Ohio River Valley received up to 300 percent of normal precipitation. Nineteen stations in Ohio, Indiana, and Illinois set a maximum monthly precipitation record. Rockville, Indiana, measured 10.66 inches (271 mm), making it the wettest February in 123 years. In contrast, northwest Missouri to central Wisconsin saw less than 50 percent of normal precipitation. Winter (December-February) precipitation for the Midwest totaled 6.62 inches (168 mm), which was 0.65 inches (16.5 mm) above normal.
February snowfall totals ranged from 5-30 inches (12.7-76.2 cm) from Missouri to northwest Ohio and across upper Minnesota, putting these locations at 200-300 percent of normal snowfall for the month. Snowfall across Michigan’s Upper Peninsula was near normal, ranging from 20-80 inches (50.8-203.2 cm). Iowa, southern Minnesota, southern Wisconsin, and Kentucky snowfall ranged from 0.01-5 inches (0.3-12.7 cm), which was 10-50 percent of normal. Regionwide, 296 daily high snowfall records occurred in February. Winter (December-February) snowfall was mixed across the region. The extreme upper Midwest, Missouri, central Illinois, central Kentucky, and eastern Ohio had above-normal winter snowfall. The most significant winter snowfall deficits were focused downwind of Lake Michigan, where lake effect snow was lower than usual. Iowa, southern Wisconsin, and Indiana also reported below-normal winter snowfall.
- Drought
Moderate to severe drought and abnormal dryness affected 45 percent of the Midwest, confined to the northwest portion of the region. The lower Midwest remained free of drought in February. Over the previous month, drought expanded in Iowa, Wisconsin, northern Illinois, and western Michigan. Conditions improved slightly in Missouri and Minnesota, although areas of drought and abnormal dryness were still present. Over the winter (December-February), the percent of land in drought across Minnesota fell from 49 percent to 27 percent. The epicenter of the drought shifted from Minnesota to the southeast into Wisconsin.
- Flooding
Above-normal precipitation, frozen and saturated soils, and melting snow led to action stage and minor flooding on the Wabash and Ohio Rivers during the second half of February, which was typical for that time of year. Rapid temperature swings and heavy precipitation led to ice jam flooding on the Vermillion River in northeast Ohio, resulting in multiple swift-water rescues and road closures.
- Notable Weather Events
A significant winter storm affected the lower Midwest February 3-4, bringing 6-15 inches (15.2-38.1 cm) of snow across Missouri, Illinois, Indiana, Michigan, and Ohio, in addition to ice and sleet accumulations. For many, this was the first significant snowstorm of the winter season, and with it came widespread school closures, delayed flights, and roadway closures. In central Illinois, traffic accidents shut down parts of Interstates 39, 74, 55, and 57.
The winter season was unusually windy across northern Minnesota, resulting in frequent whiteout conditions. The NWS Grand Forks office issued 12 Blizzard Warnings, the most on record in the searchable database back to 2005.
- For further details on the weather and climate events in the Midwest, see the weekly and monthly reports at the Midwest Climate Watch page.
Southeast Region (Information provided by the Southeast Regional Climate Center)
- Temperature
Temperatures were near to above average across much of the Southeast region for the month of February. Monthly mean temperatures were within 2 degrees F (1.1 degrees C) of average for over 40 percent of the 216 long-term (i.e., period of record equaling or exceeding 50 years) stations across the region. Consequently, there were no long-term stations that observed their warmest or coldest February on record. However, Charleston, SC (1938-2022; at 3.6 degrees F (2 degrees C) above normal) observed its ninth warmest February on record. Maximum temperatures ranged from 5.9 degrees F (3.3 degrees C) above normal in Lynchburg, VA (1896-2022) to 1.7 degrees F (0.9 degrees C) below normal in San Juan, PR (1898-2022). Daily temperature minimums ranged from 5.4 degrees F (3 degree C) above normal in West Palm Beach, FL (1897-2022) to 3.1 degrees F (1.7 degrees C) below normal in Muscle Shoals, AL (1893-2022). The warmest weather of the month occurred from the 22nd – 25th, with much of the region recording mean temperatures more than 15 degrees F (8.3 degrees C) above normal. Daily maximum temperatures exceeded 70 degrees F (21 degrees C) across portions of every state. There were 23 long-term stations that observed a daily maximum temperature record on the 23rd, including Wilmington, NC (1871-2022) and Macon, GA (1892-2022), both reaching 82 degrees F (28 degrees C). A few stations observed or tied their warmest February day on record, including Florence, SC (1948-2022; on the 24th and 25th) at 86 degrees F (30 degrees C) and Augusta, GA (1873-2022; on the 24th) at 88 degrees F (31 degrees C). The University of South Carolina (1930-2022; on the 25th) in Columbia, SC, was one of a few stations that reported the highest daily maximum temperature in the region for the event at 89 degrees F (32 degrees C), making this its warmest February day on record. In contrast, the coldest weather of the month across the Southeast occurred on the 13th through the 15th, as the circulation around a departing mid-latitude cyclone ushered in cold air from Canada. Daily minimum temperatures fell below 30 degrees F (-1.1 degrees C) across portions of every state including Florida. Some locations in the higher elevations of North Carolina and Virginia fell below 10 degrees F (-12.2 degrees C), including Mt Mitchell (1925-2022) with a minimum temperature of 6 degrees F (-14.4 degrees C).
- Precipitation
Precipitation was variable across much the Southeast region for February, with a few wet and dry extremes reported. The driest locations were found across much of Florida, and the eastern half of the region. Monthly precipitation totals ranged from 70 to less than 25 percent of normal across these locations. Tallahassee, FL (1896-2022) only observed 1.28 inches (33 mm) of precipitation, more than 3 inches (76 mm) below normal, and New Bern, NC (1933-2022) tied its driest February at only 1 inch (25 mm) of precipitation. In contrast, the wettest locations for the month were located across Puerto Rico, northern Alabama and Georgia, and western North Carolina and Virginia. Precipitation totals ranged from 100 to 200 percent of normal. Highlands, NC (1902-2022) measured 13.1 inches (333 mm) of precipitation for the month, over 6 inches (152 mm) above normal, and San Juan, PR (1898-2022) observed its wettest February on record at 11.7 inches (297 mm) of precipitation, more than 9 inches (229 mm) above normal. On the 3rd and 4th, a low-pressure system tracked northward through the region and produced moderate rainfall across portions of Alabama, Georgia, western North Carolina, and Virginia. Columbus, GA measured over 4 inches (102 mm) of rainfall, and Montgomery, AL measured over 3 inches (76 mm). As a result, several roadways across Russell County, AL were reported as impassible or washed out due to flash flooding. The most snowfall for the month was observed in Hot Springs, VA at 4.5 inches (114 mm), on February 13th.
- Drought
Drought conditions slightly intensified across the Southeast region, except for Puerto Rico in February. At the beginning of the month, pockets of moderate drought (D1) were in Virginia, North Carolina, South Carolina and Alabama. Abnormally dry conditions (D0) ringed the areas of moderate drought and stretched through northern Florida. By the end of the month, the area of moderate drought stretched across eastern North Carolina down into eastern Georgia, with an expanded area of moderate drought in northern Florida. Abnormally dry conditions expanded throughout these areas as well, and by the end of the month (D0) covered most of the Florida Peninsula. Drought conditions improved across Puerto Rico for the month, with pockets of moderate drought (D1) ringed by an area of abnormally dry conditions (D0) in the southern part of the Island and pockets of moderate drought (D1) to extreme drought (D3) across the Virgin Islands.
- Agriculture
Farmers in the citrus growing region of Florida had to run irrigation due to increasingly dry conditions. Frost experienced at the beginning of the month impacted row crop production throughout the state. Damage assessments also revealed signs of leaf burn in the sugarcane crop. The cool temperatures in Georgia helped suppress weeds and insects. An early February freeze damaged some strawberry crops in Alabama, but they are expected to recover by harvest. The warmer weather toward the end of the month allowed farmers to prepare fields for spring planting in South Carolina.
- Severe Weather
There were 49 reports of severe weather across the Southeast during February, which is 58 percent of the median monthly frequency of 85 reports during 2000-2019. There were 9 confirmed tornadoes reported for the month (4 EF-0, 2 EF-1 and 3 EF-2), which is equal to the monthly average. A slow-moving cold front with a line of thunderstorms moved through central Alabama on February 3rd and produced five tornadoes. The strongest tornado occurred in Greene County, AL and was rated EF-2, with winds of 135 mph (60 m/s). This tornado destroyed several homes and lofted a double-wide manufactured home approximately 50 yards across the road, causing one fatality and two serious injuries. It also turned over a fish truck causing the load of fish to be dumped across the road and deposited another two pickup trucks into a pond. This tornado caused 8 injuries and 1 fatality in total. Another EF-2 tornado, associated with this line of storms, occurred in Hale County, AL. This tornado had winds of 125 mph (56 m/s) and uprooted several trees. No injuries or fatalities were reported. There were 2 reports of hail for the month, with the largest being quarter sized (1.00 inches) in Tuscaloosa County, AL on February 17th. There were 33 wind reports for the month, which is 52 percent of the average (64 reports). Thunderstorm wind gusts of 60 mph (27 m/s) were observed in Clarke County, AL on February 3rd, with significant tree damage and powerlines downed. No injuries were reported. There were 3 fatalities and 2 injuries from car accidents due to dense fog in Flagler County, FL on February 25th. Unfortunately, there was one rip current death for the month, a 12-year-old boy in Puerto Rico.
- Winter Season (DJF) Superlatives
- Counts with daily maximum temperature 80 degrees F (26.7 degrees C) and above: Macon, GA (1892-2022; 7 days; Tied 1st), Pensacola, FL (1879-2022; 5 days; Tied 1st), Wilmington, NC (1871-2022; 5 days; Tied 1st), Mobile, AL (1871-2022; 6 days; 2nd), Augusta, GA (1873-2022; 9 days; 2nd)
- Counts with daily maximum temperature 70 degrees F (degrees C) and above: Lumberton, NC (1903-2022; 30 days; Tied 1st), Elizabeth City, NC (1911-2022; 18 days; Tied 1st), Richmond, VA (1871-2022; 12 days; Tied 2nd), Raleigh, NC (1887-2022; 22 days; 2nd), Muscle Shoals, AL (1893-2022; 21 days; 2nd), Charlotte, NC (1878-2022; 19 days; 2nd), Cape Hatteras, NC (1874-2022; 17 days; 2nd), Lynchburg, VA (1893-2022; 11 days; 2nd)
- For more information, please visit the Southeast Regional Climate Center Home Page.
High Plains Region (Information provided by the High Plains Regional Climate Center)
February was a very dry month for most of the High Plains, which led to the expansion of drought across the region. Currently, 78 percent of the region is now engulfed in drought conditions. Kansas and Nebraska have been significantly impacted by the extreme dryness that was present not only in February, but throughout the winter. Agricultural producers and resource managers are being forced to make decisions based on the current situation to prepare for potential issues in the coming months.
Despite below normal temperatures throughout most of the region, temperatures fluctuated greatly throughout the month. This swing from above normal to below normal temperatures has created issues for many different sectors, particularly recreation. Ice fishing is down in areas due to lakes not having proper time to freeze over, while ski resorts had issues with creating snow.
In eastern North Dakota, cold temperatures and an above-normal number of blizzards have occurred recently. Since the beginning of 2022, 10 blizzard warnings have been issued by the National Weather Service office in Grand Forks. This has already tied the full-year record, which was set in 2014. As a result, snow has continued to accumulate, which has created the potential to create challenges during the upcoming planting season and has an increased risk of flooding this spring. Many areas along the Red River near Fargo and Grand Forks have a 50% or greater chance of exceeding flood levels this spring as a result of the accumulating snow.
- Temperature
Across the entirety of the region, temperature departures were below normal for February, aside from a few small areas. In northeastern North Dakota and the Rockies, temperatures were as much as 10 degrees F (5.6 C) below normal for February. Despite the below normal temperature departures in the High Plains, temperatures fluctuated throughout the month. In Topeka, KS, temperatures dropped from a high temperature of 70 degrees F (21.1 degrees C) on the 21st to 19 degrees F (-7.2 degrees C) on the 23rd, a decrease of 51 degrees F (28.3 C). These temperature fluctuations created many impacts in the region. For example, soil in the region was not able to freeze fully, which is a concern for farmers as the planting season approaches. Sandhill crane migrations for this year also started to arrive earlier than average from the south due to the unseasonably warm temperatures throughout the winter.
Despite the varying temperatures over the course of the 2021-2022 winter season, some areas ranked in the top 10 warmest winters on record. Lander, WY observed their 8th warmest winter on record, with a season average of 27.2 degrees F (-2.7 degrees C), while the record is 30.9 degrees F (-0.6 degrees C) in 1993-1934. In Colorado Springs, CO, the season-average temperature was 34.4 degrees F (1.3 degrees C) tying with the 1975-1976 season for the 9th warmest winter on record, the record being 37.6 degrees F (3.1 degrees C) from 1933 to 1934.
- Precipitation
The dryness continued to grip the southeastern part of the High Plains in February. Kansas and Nebraska were among the driest for not only the month but for the entire winter season. In contrast, eastern North Dakota and central Colorado recorded above-normal precipitation for the month and season.
Several locations within Nebraska and northern Kansas observed their driest February on record. McCook, Nebraska, observed their 2nd driest month on record, with only trace amounts of precipitation recorded. To the north, North Platte observed 0.03 inches (0.76 mm) of precipitation, leading to their 4th driest February. Grand Island tied with 1904 for the record driest, with only 0.01 inches (0.25 mm) of precipitation observed. Hastings and Lincoln both recorded their 3rd driest February on record with 0.01 and 0.03 inches (0.25 and 0.76 mm), respectively, of precipitation.
This dryness was not only prevalent during the month, but also throughout the winter in Nebraska. Lincoln and Hastings both observed their 2nd driest winters on record, while Norfolk and Grand Island observed their 3rd driest winters. Other locations that were extremely dry included Concordia, Kansas, and Pierre, South Dakota, which recorded their 3rd and 4th driest winters, respectively. In contrast to this dryness, several locations recorded above-normal precipitation. Sisseton, South Dakota observed their 5th wettest and 6th most snowfall for the winter. Grand Forks, North Dakota was also unusually wet, recording their 4th most snowfall and 10th wettest winter on record. Snowfall was also above-normal in Cheyenne, Wyoming, and Fargo, North Dakota, where the 7th and 10th most wintertime snowfall, respectively, was observed.
- Drought
Dryness continued in Nebraska and Kansas, which led to widespread expansion of drought conditions. Meanwhile, drought conditions improved in North Dakota and northeastern Colorado. The region has remained free of exceptional drought (D4) conditions since November of 2021.
Drought significantly expanded across Nebraska as a result of extremely dry conditions. The state began the month with 38 percent in D1 (moderate drought) to D4 (exceptional drought), and ended with 91 percent of the state in D1 to D4. The lack of precipitation South Dakota and Kansas both observed increases of 22 and 10 percent, respectively, to D1 to D4 conditions. Contrary to this dryness, Colorado observed an 11 percent decrease to extreme drought (D3) conditions after the eastern part of the state received above normal precipitation. Drought conditions also improved after beneficial precipitation in central and northern North Dakota. Throughout the rest of the region, other improvements and degradations were observed. According to the Climate Prediction Center’s U.S. Monthly Drought Outlook for March, drought development is likely in northern Nebraska and western Colorado.
- For more information, please visit the High Plains Regional Climate Center Home Page.
Southern Region (Information provided by the Southern Regional Climate Center)
February was a moderately cold month across the South, with a very uneven distribution of precipitation.
- Temperature
February 2022 was only slightly warmer than January throughout the Southern Region, ranking 39th coldest overall at 45.0 F out of 128 years of record-keeping. Texas was especially chilly in a relative sense, averaging 45.8 F (22nd coldest), while Mississippi was very close to its long-term average at 48.8 F. The month featured fairly large lemperature swings, with two particularly cold episodes in early and late February. The coldest temperature was observed in Muleshoe, Texas, at -12 F on Feb. 4, while the warmest temperature was observed in Laredo and Alice, Texas, at 97 F on Feb. 22. Both Port Arthur, Texas and McComb, Mississippi set maximum temperature records for February: 88 F on Feb. 2 in Port Arthur and 85 F on Feb. 22 in McComb. There were no February minimum temperature records set across the region.
- Precipitation
Precipitation was wildly variable across the region. With respect to historical rankings, Texas (0.98 inches) and Louisiana (2.97 inches) were driest, both recording their 30th driest February on record. Wetter were Oklahoma (1.52 inches, 58th wettest), Mississippi (5.52 inches, 50th wettest), Arkansas (4.41 inches, 39th wettest), and Tennessee (8.35 inches, 10th wettest). Five stations in Tennessee (Newfound Gap, Mousetail Landing State Park, Montgomery Bell State Park, and two CoCoRaHS observers near Finger and Henderson) recorded more than a foot of precipitation, with the largest being Newfound Gap at 13.45 inches. In Texas, Wink and Lipscomb both reported no measurable precipitation. As in January, all six states reported measurable snow accumulation, though just barely: Baldwin was the only such station in Mississippi, at 0.1 inches. Meanwhile, three stations recorded more than a foot of snowfall: 17 inches in Helena, Oklahoma; 14.5 inches in Lead Hill, Arkansas; and 12” in Seminole, Oklahoma.
- Drought/Flooding
Drought dominated the picture across most of the Southern Region, with the primary exceptions being Tennessee, northern Arkansas, and northeastern Mississippi. Overall, 59% of the region was in drought as of March 1, 40% was in severe drought or worse, 13% was in extreme drought or worse, and 1% was in exceptional drought. Most of these numbers were up slightly from the previous month. The exceptional drought was limited to the Oklahoma Panhandle, but large swaths of extreme drought covered western Oklahoma, much of western Texas, and more isolated locations in eastern Oklahoma, northeastern and central Texas, southern Arkansas, and Louisiana. The primary agricultural impacts were with winter wheat and rangeland. Texas winter wheat was rated 75% poor to very poor on February 27, and soil moisture was rated 76% short to very short. Oklahoma winter wheat was rated 65% poor to very poor, and soil moisture was rated 75% short to very short.
- Notable Weather
An ice storm swept across the region on February 3 from Texas to Tennessee. Ice and snow shut down nearly all travel from west-central Texas to north Texas. Ice accumulations in the Memphis, Tennessee area caused over 100,000 customers to lose power, many for several days. At least two fatalities were associated with the ice storm.
No tornadoes were reported in the Southern Region during February, but there were numerous reports of damaging winds on Feb. 3 (Mississippi), Feb. 17 (Oklahoma, Louisiana, Mississippi, and Tennessee), and Feb. 22 (Arkansas, Tennessee, and Mississippi). February 22 also brought large hail to some locations in Mississippi and Tennessee.
- For more information, please visit the Southern Regional Climate Center Home Page.
Western Region (Information provided by the Western Region Climate Center)
A stubborn and strong ridge of high pressure persisted in the northeast Pacific for the first three weeks of February which kept significant moisture and precipitation away from the Western US. Deep low pressure developed over the Intermountain West the last week of February as the Pacific high migrated north bringing cold temperatures and mostly light precipitation to the West due to the continental origin of the airmass. Overall, precipitation was well below normal, and temperatures were below normal (with some exceptions along the West Coast states) across the West during February.
- Temperature
The location of the Pacific high during the first three weeks of February and the cold low pressure the last week of the month allowed for well below normal temperatures to persist for much of the month in the Great Basin and Intermountain West. While record cold did not develop, several locations were in the lower ten percent of all February temperatures. Elk, New Mexico, in the southeast part of the state, recorded its second lowest February temperature since 1948 at 35 degrees Fahrenheit (1.7 degrees Celsius), -5 degrees Fahrenheit (-2.7 degrees Celsius) below normal and Hillsboro in southeast New Mexico saw its fifth coldest at 39.4 degrees Fahrenheit (4.1 degrees Celsius), -4.6 degrees Fahrenheit (-2.6 degrees Celsius) below normal. The northern Great Basin saw the greatest magnitude of cold anomalies with Baker City, Oregon at 22.9 degrees Fahrenheit (-5.1 degrees Celsius), -10.6 degrees Fahrenheit (-5.9 degrees Celsius) below normal and the fifth coldest on record, and Swan Valley, Idaho was at 18.6 degrees Fahrenheit (-7.4 degrees Celsius), -5.6 degrees Fahrenheit (-3.1 degrees Celsius) below normal and ranked fourth coldest on record. The Sierra Nevada and northwest California was a region with well above normal temperatures and in the top ten percent on record for February.
- Precipitation
Record February dryness occurred in California, Oregon, Idaho, and Utah, and well below normal precipitation was found across nearly the entire West with a few exceptions. Several long-term stations in California and Nevada recorded zero or trace amounts of precipitation including Sacramento, Bishop, and Stockton in California, and Lovelock and Las Vegas in Nevada. This was only the second time since records began in 1878 that Sacramento has logged zero February precipitation (2020 was the other year) with the normal value being 3.63 inches (92.2 millimeters). Boise, Idaho saw its driest February dating back to 1940 with 0.08 inches (2 millimeters) and just 8 percent of normal. In the Wasatch Mountains of northern Utah, Alta (a high elevation mountain site at 8,710 feet) received 1.25 inches (31.8 millimeters) of precipitation and 23% of normal making it the driest on record since 1945; this also led to the lowest February snowfall on record at Alta with 25 inches (635 mm). Over 200 high elevation SNOTEL stations across the West (at least 20 years of record) saw record dry February precipitation. Some isolated areas of above normal precipitation were found in central Montana and northeast New Mexico.
- Alaska Summary
In Alaska, most of the northwest Arctic and North Slope saw well below normal temperatures with anomalies ranging about -2 degrees Fahrenheit to -8 degrees Fahrenheit below normal. Southcentral, Southeast, and the Alaska Peninsula were mild with above normal temperatures; these same regions also experienced well above normal precipitation. Kodiak had its fourth warmest February since 1931 at 37 degrees Fahrenheit (2.8 degrees Celsius), +4.6 degrees Fahrenheit (+2.6 degrees Celsius) above normal. Anchorage saw its sixth warmest February at 27.9 degrees Fahrenheit (-2.3 degrees Celsius), +6.6 degrees Fahrenheit (+3.7 degrees Celsius) above normal and was second wettest with 2.76 inches (70 millimeters) and 321percent of normal. In Southeast Alaska Juneau logged its wettest February since 1937 with 10.53 inches (267 millimeters) and 244 percent of normal.
- Hawaii Summary
Hawaii generally saw above normal temperatures and below normal precipitation across the entire island chain. Kauai, Oahu, Molokai, Lani, and Maui all had stations reporting less than 50 percent of normal precipitation for the month. Honolulu saw its fourth warmest February at 75 degrees Fahrenheit (23.9 degrees Celsius), +1.2 degrees Fahrenheit (+0.7 degrees Celsius) above normal and precipitation was the driest on record with 0.05 inches (1.27 millimeters) at three percent of normal. Lihue logged 0.51 inches (13 millimeters; 14 percent of normal) for the fourth driest since 1950. The dryness led to moderate and severe drought categories being introduced in the US Drought Monitor over the past month.
- Significant Events
Low snowpack in Northern Rockies intensifies drought: Many SNOTEL stations and snow courses in northwest Wyoming and southwest Montana reported record low or second lowest snow water equivalent values (about 30-60 years of record for these sites) at the end of February. This area is currently in severe to extreme drought and the low snowpack will act to continue drought degradations going into the spring runoff season unless a shift to a major wet pattern occurs over the next few months.
- For more information, please go to the Western Regional Climate Center Home Page.