Northeast Region:
(Information provided by the Northeast
Regional Climate Center)
- April 2009 was the third consecutive month with above normal
temperatures in the Northeast. The regional average of 47.5°F
(8.6°C) was 2.1°F (1.2°C) above normal. The northern
states saw the greatest positive departures, from 2.2°F
(1.2°C) above normal in New Jersey to 3.3°F (1.8°C)
warmer than normal in New Hampshire, where it was the 8th warmest
April since 1895. Maryland was the closest to normal, with
temperatures that were only 0.5°F (0.3°C) warmer than the
long term mean. An early season heat wave during the last week of
the month was a major contributor to the above normal monthly
average. Many daily and even monthly all-time high records were set
during the event, including the first time the temperature in
Portland, ME topped 90°F (32.2°C) in April.
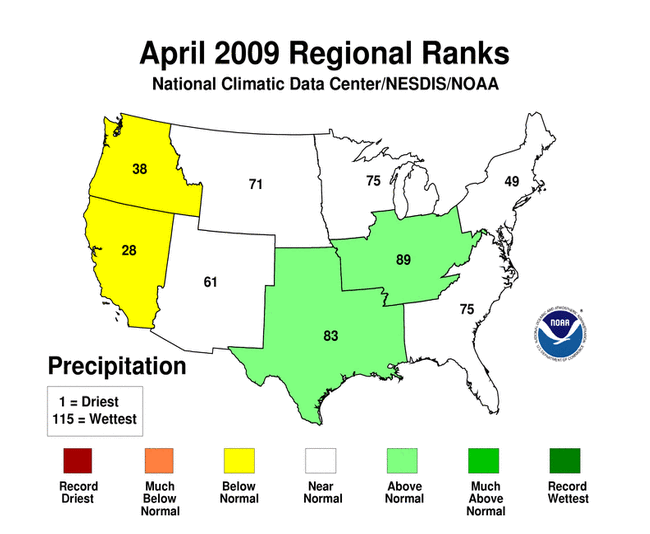
- For the fourth month in a row, the Northeast averaged below
normal precipitation. The regional average was 3.24 inches (82.3
mm) or 91% of the normal April precipitation amount. This
represented a range of values from 66% of normal in Vermont to 141%
of normal in Delaware. The general weather pattern this month kept
the bulk of the precipitation in the southern three states and
along the coast, leaving interior sections of the Northeast quite
dry.
- Above normal rainfall in the southern third of the Northeast
improved drought conditions in West Virginia and Maryland from
moderate to abnormally dry, according to the April 28, 2009 U.S.
Drought Monitor. Most of western West Virginia improved to normal
conditions. Below normal precipitation in the central portion of
the Northeast resulted in abnormally dry conditions in Delaware,
New Jersey, Pennsylvania, southern New York and western
Massachusetts and Connecticut.
For more information, please go to the Northeast
Regional Climate Center Home Page.
Midwest Region:
(Information provided by the Midwest
Regional Climate Center)
- April temperatures were close to normal, -2°F to 2°F
(-1.1°C to 1.1°C), across most of the region. Along the
western edge of the region temperatures were slightly cooler with a
minimum of about 4°F (2.2°C) along the Iowa-Missouri
border. While the average temperature was near normal, the weekly
temperatures were not, especially in the southern two-thirds of the
region. The first 20 days of the month were below average across
the southern two-thirds with Missouri averaging about 5°F
(2.8°C) below normal. Many record lows, particularly record
low maximum temperatures, were set during this time. The last ten
days of the month were dominated by strong southerly winds bringing
warm advection and preventing nighttime inversions. Many record
high maximum temperatures were set and hundreds of record high
minimum temperatures were set, with most occurring on April 25 to
27.
- April was a wet month with nearly all the region receiving
above normal precipitation. Minnesota, northwest Iowa, northwest
Wisconsin, and eastern Ohio were below normal for the month, but
elsewhere precipitation was above normal. A swath of much above
normal precipitation (greater than 150%) extended from northern
Missouri through Illinois and into central Indiana. Peak values
reached over 200% of normal in southeastern Illinois where two
stations reported over 9 inches (225 mm) of rain. Record April
totals included Hutsonville Power Plant (9.48 inches, 241 mm) and
Palestine (9.89 inches 251 mm), both in Crawford County, Illinois
as well as Butler (9.10 inches, 231 mm) in west central
Missouri.
- Red River flooding continued for the entire month. A second
crest of the river was several feet short of the earlier crest but
still well into the major flooding category. The extended period of
flooding put a severe strain on the communities along the river in
Minnesota and North Dakota but for the most part breeches of the
temporary levees was limited. Flooding in other areas improved
throughout the month until the last week of April. A widespread
rain event associated with a strong cold front brought heavy rains
across the region and renewed minor to moderate flooding conditions
from Missouri to Michigan.
- Numerous storms tracked across the region this month. The
associated rain brought some areas heavy rain but other areas were
spared. While the paths of the storms varied, the upper Midwest
continued in drought until finally getting some relief in the last
eight days of the month. On the other hand, Illinois continued to
get rain from the various storms and farm fields remain too wet to
work in most of the state. While most other states have gotten
limited days in the field, Illinois corn planting is well behind
schedule.
For details on the weather and climate events of the Midwest during
April, see the weekly summaries in the
MRCC Midwest Climate Watch page.
Southeast Region:
(Information provided by the Southeast Regional
Climate Center)
- Mean temperatures for April 2009 displayed much variability
across the region. Temperatures were slightly below normal across
much of AL, GA, SC, portions of northern FL, and small areas of NC.
Temperatures were slightly above normal across northern and eastern
NC, much of VA, south central FL, and small portions of AL, GA, and
SC. In Puerto Rico, temperatures were slightly below normal across
much of the island. The coldest temperatures during the month were
observed behind a strong cold front that passed through the
Southeast on the 6th of the month. Low temperatures of 23°F
(-5°C) and 25°F (-4°C) were observed at Blairsville,
GA and Jocassee, SC, respectively, on the morning of the 8th.
Tallahassee, FL dropped to 31°F (-1°C) on the 9th marking
the ninth spell of sub-freezing air over the last four months in
the region. This late freeze was 37 days later than the
climatological last freeze date for the location. During the last
week of the month, exceptionally warm air dominated the region as
the Bermuda High extended westward over the region. There were 174
record daily high temperatures across the region, including Bremo
Bluffs, VA, which recorded a high temperature of 96°F
36°C) on the 26th. Washington Dulles airport recorded three
straight days in which the maximum temperature equaled 92 °F
(33°C). This was the earliest seasonal occurrence of a 3-day
string of 90°F (32°C) or greater maximum temperatures for
a record extending back to 1962.
- Much of the region displayed below normal precipitation totals
for April, especially SC, NC, southern VA and the southern
three-quarters of FL. Monthly precipitation totals were less than
50% of normal across much of southern FL. Most notably, Oasis
Research Station, FL recorded only 0.27 inches (7 mm) of
precipitation for the month. In contrast, monthly precipitation
totals across most of GA and small portions of AL and SC were above
normal, especially portions of south GA and the western panhandle
of FL, where precipitation totals were more than 200% of normal.
Fargo, GA and Jasper, FL recorded 12.59 inches (320 mm) and 11.80
inches (300 mm) of precipitation, respectively, for the month,
which was about 450 and 350% of the normal monthly totals. Most of
Puerto Rico experienced below normal precipitation totals for the
month. The prodigious monthly precipitation totals over southern GA
and western FL were associated with multiple mesoscale convective
systems that tracked across the region in association with the
approach of two cold fronts between the 1st and 3rd of the month.
Quitman, GA and Jasper, FL recorded 3-day precipitation totals that
exceeded 10 inches (254 mm) during this period. Near record
flooding occurred along several rivers in southern GA that impacted
at least 80 building structures. The exceptionally wet conditions
forced many farmers to replant their corn crop.
- Severe drought (D2) conditions persisted across portions of
central and southern FL, and a small region of southwestern FL was
upgraded to the extreme drought classification (D3). Drought
conditions in northeast GA and northwest SC showed continued
improvement early in the month in response to plentiful rainfall in
late March and early April. The small area of severe drought (D2)
in northwest SC was downgraded to the moderate drought (D1)
classification. This was tied to a reduction of the size of the D1
region, which occupied only small portion of northeastern GA and
western NC by the middle of the month. Moderate drought conditions
across northern VA lessened to abnormally dry conditions during the
month. Dry conditions over the last 4 months contributed to the
development and rapid spread of a wildfire near Myrtle Beach, SC on
the 22nd that burned nearly 20,000 acres and destroyed 76 homes.
Additionally on the 23rd of the month, lightning sparked a brush
fire in the drought-stricken Everglades of southern FL forcing the
closure of Interstate 75. An exceptional number of severe
thunderstorms were observed across AL, GA, portions of SC and
northern FL during the month. There were 54 and 37 preliminary
tornado reports across AL and GA, respectively, which is greater
than any of the prior 10 years of reports for the month of April.
On the 10th of the month, a severe thunderstorm outbreak produced
numerous high wind, hail, and tornado reports, including an EF-3
tornado in Aiken County, SC that caused significant damage to homes
and businesses as well as one death. The frequent occurrence of
hail and strong winds across GA during the month damaged trees in
various peach and pecan orchards. Lightning sparked a number of
building fires on the 24th in the metro Atlanta, GA area and caused
the evacuation of the control tower at Hartsfield-Jackson airport,
resulting in many flight delays.
For more information, please go to the Southeast Regional
Climate Center Home Page.
High Plains Region:
(Information provided by the High Plains
Regional Climate Center)
- This April the High Plains Region was cool with common average
monthly temperature departures ranging from near normal to 6°F
(3.3°C) below normal. While the cool average temperatures were
not record breaking for the majority of the region, a few locations
ranked in the top 10 coolest Aprils on record. For instance, White
Lake, SD recorded its 8th coolest April with an average temperature
of 42.5°F (5.8°C). The record coolest April was recorded
in 1950 with an average temperature of 39.2°F
(4.0°C).
- Southeast Kansas was the wettest area in the region this month,
with many locations receiving several inches above normal
precipitation. This month?s extreme locations were Wichita, KS and
Anthony, KS which both broke several precipitation records. Wichita
recorded its 2nd wettest April on record with 9.94 inches (252.5
mm). Of this monthly total, 5.10 inches (129.5 mm) fell in one day
(April 26), which set a daily record as well. Anthony recorded its
wettest April with 9.91 inches (251.7 mm), or 341% of normal. The
previous wettest April occurred in 1970 with 7.54 inches (191.5
mm). The wettest day to ever occur in April was on April 27, 2009,
when Anthony received 6.55 inches (166.4 mm) of rain. This smashed
the old record of 2.20 inches (55.9 mm) which was recorded in 1938.
In addition, this 24-hour precipitation total was the 3rd greatest
24-hour precipitation total on record for this location (period of
record 1896-present).
- Over the past month showers and thunderstorms helped erase the
D2, D1, and much of the D0 conditions in Kansas. However, areas
across north central Kansas and eastern Nebraska missed out and D0
conditions have spread. Drought conditions have improved across
Wyoming and parts of Colorado, however, abnormally dry conditions
(D0) have reemerged in western North Dakota. According to the U.S.
Seasonal Drought Outlook released April 16, drought conditions are
forecasted to persist in Wyoming, but improve in Colorado through
July 2009.
- According to the North Central River Forecast Center, Devils
Lake in North Dakota reached record levels this month. Since fall
of last year, Devils Lake has been rising due to heavy
precipitation in the area. The lake continued to rise through the
winter and the rise is now accelerating due to the spring snow
melt. The previous record level of 1449.2 ft asl was surpassed on
April 30, 2009 and is forecasted to rise to a level between 1451 ft
asl and 1452 ft asl sometime in the late spring or early summer of
this year. At a level of 1446 ft asl, Devils Lake spills into
nearby Stump Lake causing the two lakes to become a single body of
water. According to the North Dakota State Water Commission, the
flooding, which began in the 1990's and has continued to the
present has destroyed hundreds of homes and businesses and has
inundated thousands of acres of productive farmland.
For more information, please go to the High Plains
Regional Climate Center Home Page.
Southern Region:
(Information provided by the Southern
Regional Climate Center)
- Some small, isolated areas in eastern Texas, eastern Oklahoma,
and northern Arkansas reported average monthly temperatures that
ranged between 2-4 ° F (1-2 °C) below normal. In general
however, average temperatures for April in the Southern Region were
within about 2 degrees of normal (1 °C). The highest anomalies
were observed in southern Texas; an area that has been fraught with
drought for several months.
- The month of April proved to be one of variable precipitation
for the Southern Region. Large areas of the region experienced
above normal monthly totals, while other large areas received below
normal precipitation. In the case of the latter, precipitation
totals in Mississippi were generally below 75 percent of normal. In
the coastal areas of the state, monthly totals ranged from 25-50
percent of the monthly allotment. This was also the case for south
eastern Louisiana, specifically, the Florida parishes of the state.
There was also a second dry belt that extended from north eastern
Louisiana, through central Mississippi to north eastern
Mississippi. Along this belt, monthly totals ranged from 25 to 50%
of normal. The driest areas of the Southern Region consisted of the
western Texas panhandle and the southern tip of Texas where
precipitation totals were mostly below 25% of normal. Many stations
in Texas Climate Divisions 5 (Trans Pecos) and 10 (Lower Valley)
reported little to no precipitation for the month. Conversely, the
wettest portions of the Southern Region included south eastern
Texas, west central Texas, and north central Texas and south
central Oklahoma. These areas all experienced precipitation totals
that ranged from 200 to 400 percent of normal. Elsewhere in the
Southern Region, precipitation totals fell in the 75% to 125% of
normal range.
- The spatially variable pattern of April precipitation led to
both improvements and deteriorations in drought conditions within
the Southern Region. In eastern Tennessee near normal precipitation
led to improved conditions and the state is now drought free.
Similarly, normal rainfall for the month in southern Arkansas
resulted in the removal of abnormally dry conditions. Heavy
precipitation totals in Oklahoma allowed for a great improvement
throughout the state. For instance, the southern Oklahoma border,
which last month was categorized as moderate to severe drought, is
now relatively drought-free. Drought conditions were also improved
by one category along the Oklahoma panhandle. Last month, this area
was categorized as moderate to severe drought. As of May 5th, 2009,
only a small area of the Oklahoma panhandle was exhibiting
abnormally dry conditions. In Texas, the northern Texas panhandle
experienced a two category improvement from moderate drought to
drought-free conditions. There were also significant improvements
in the eastern portions of the state, where precipitation totals
for the month were well above normal. In the southernmost counties
of Texas, dry conditions (continued from March) led to a slight
expansion of exceptional drought.
For more information, please go to the Southern
Regional Climate Center Home Page.
Western Region:
(Information provided by the Western
Regional Climate Center)
- Except for small isolated pockets almost the entire western
region of the continental U.S. had below normal temperatures for
April 2009. On the 20th-21st a short heat spell brought all-time
April records to the San Francisco and Monterey Bay areas, reaching
as high as 104°F (40.0°C) at King City CA. To the north,
Fairbanks, AK tied an all time April temperature record on the 29th
with 74°F (23.3°C), and the next day proceeded to then
break that record with 76°F (24.4°C).
- Precipitation was below normal in most of the western and
southern portions of the region. Interior areas of the Great Basin,
the Wasatch, parts of the central and Northern Rockies, and the
plains of Montana, along with isolated pockets of southern Arizona
were wetter than normal. Parts of Wyoming, Montana and Colorado had
an exceptionally wet and snowy April. Great Falls, MT tied their
all-time snowiest month ever with 35.4 inches (89.9 cm). Bozeman,
MT also recorded their snowiest month of all time with 49.6 inches
(126 cm). The large snow event along the Front Range of Colorado on
the 17-19th produced 56.3 inches of snow (143 cm) in
Rollinsville.
- Mountain snowpack remained mostly healthy in the Pacific
Northwest and Intermountain region with snowpack on May 1st near or
slightly above normal. The Southwest and California remained well
below normal. Snowmelt inflow to Lake Powell on the Colorado River
is expected to be near average. California snowmelt runoff is again
expected to be well below average for the third consecutive
year.
For more information, please go to the Western
Regional Climate Center Home Page.
Alaska: (Information provided by Audrey
Rubel at NOAA NWS Alaska Region Headquarters.)
- For the month of April, temperatures averaged slightly below
normal for the panhandle, southwest, and portions of the interior.
The strongest anomalies were found along the Bering Sea coast with
temperature departures in the 2.5 to 3.0°F (1.4°C to
1.7°C) range. Monthly means were above average in the north
and parts of the interior and west-central regions. Locations on
the North Slope had monthly anomalies of around 3.0°F
(1.7°C). Precipitation conditions for the month showed a
pattern of discontinuity with drier than normal in the east and
wetter than normal in the west. Due to the gradual warm-up taking
place during April with lengthening daylight hours, the seasonal
snowpack disappeared or was significantly reduced at many
locations.
|