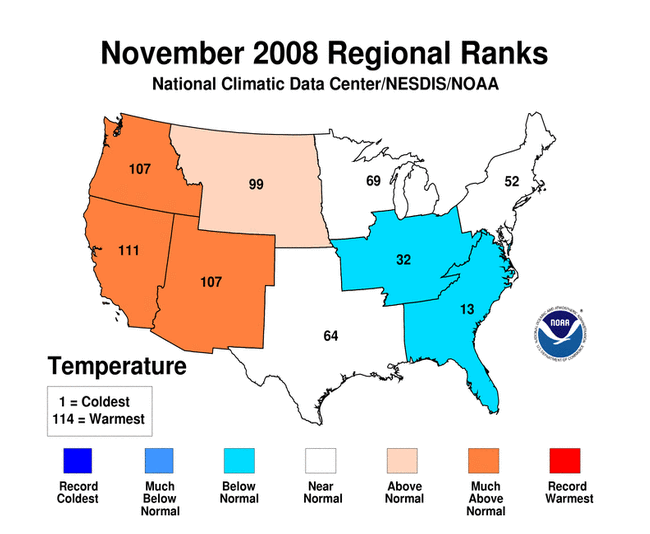
Northeast Region:
(Information provided by the Northeast
Regional Climate Center)
- The northern third of the region averaged warmer than normal
while the southern two-thirds experienced cooler than normal
temperatures in November. Maine was the warmest state, with a
departure of 1.1°F (0.6°C) above normal. Vermont and New
Hampshire also averaged above normal, but just barely: 0.3°F
(0.2°C) above normal in Vermont and 0.1°F (0.1°C)
above normal in New Hampshire. Temperature departures in the
remaining states ranged from 0.6°F (0.3°C) below normal
in New York to 3.5°F (1.9°C) below normal in West
Virginia. Overall, the average temperature in the Northeast for
November was 38.2 °F (3.4°C) which was 1.0°F
(0.6°C) below normal.
- Above normal precipitation totals were confined to Maine,
eastern New Hampshire, coastal Massachusetts, Rhode Island,
southern New Jersey, Delaware, the Eastern Shore of Maryland and a
few areas downwind of Lakes Erie and Ontario. State precipitation
departures ranged from 70% of normal in Pennsylvania to 155% of
normal in Maine. The Northeast, as a whole, averaged 99% of the
long-term mean.
- According to the December 2, 2008 U.S. Drought Monitor, most of
western Pennsylvania was abnormally dry, as was the northern half
of West Virginia, the western panhandle of Maryland and
southwestern Maryland. The southern half of West Virginia was in
moderate drought and the extreme southern tip of the state was
still in severe drought. The Pennsylvania Department of
Environmental Protection issued a drought watch for 29 counties in
western and central portions of the state. The state requested that
water users in the affected areas reduce their non-essential water
use by 5%.
For more information, please go to the Northeast
Regional Climate Center Home Page.
Midwest Region:
(Information provided by the Midwest
Regional Climate Center)
- Temperatures the first week of November could best be described
as balmy, with highs in the 70s °F (21 °C-26 °C)
across much of the region. There were five consecutive days where
high temperature records were set in the Midwest during the first
week. In Iowa, an analysis by the Iowa Environmental Mesonet found
this warm spell snapped a record streak of 277 consecutive days
(January 29 to November 1) without setting any daily record high
temperatures within Iowa. This easily broke the old record of 247
consecutive days without a record high set in 1993. During the
first week of November temperatures across the Midwest ranged from
3 °F (1.7 °C) above normal in southeastern Kentucky to
more than 14 °F (7.8 °C) above normal in northern
Minnesota. The remainder of the month, however, was a different
story. Temperatures the last three weeks of the month ranged from
near normal in northwestern Minnesota to 7 °F (3.9 °C)
below normal in Kentucky. When all was said and done, November
temperature departures ranged from 3 °F (1.7 °C) above
normal in northern Minnesota to 5 °F (2.8 °C) below
normal in southeastern Kentucky.
- A persistent band of northwesterly winds aloft over the Midwest
kept much of the region dry during the month. The heaviest
precipitation was in the western portions of the region, on the
southern edge of the northwesterlies, and in the lake-effect snow
areas. Cold frontal passages, followed by westerly and
northwesterly surface winds brought cold air over the relatively
warm lake waters which produced frequent days with lake-effect
snow. Precipitation for the month of November was above normal in
northwestern Minnesota, central Iowa, and downwind of the Great
Lakes in Michigan and northeastern Ohio. Elsewhere, precipitation
was only 50-75 percent of normal, with an area from southern
Missouri through central Illinois with less than 50 percent of
normal precipitation.
- Areas of drought in the upper Midwest and in Kentucky expanded
during November. This marks the 4th consecutive month that most of
Kentucky has been dry, although some parts of northern Kentucky
have had below normal rainfall since the spring. Extreme drought
conditions continued over eastern Kentucky where November
precipitation was 70% of normal. Eastern Kentucky communities such
as Jackson and London are short roughly a foot of rain for the
year-to-date which makes 2008 potentially one of the driest years
on record for this region. Drought conditions ease somewhat towards
western Kentucky but many areas remain in moderate to severe
drought.
For details on the weather and climate events of the Midwest during
November, see the weekly summaries in the
MRCC Midwest Climate Watch page.
Southeast Region:
(Information provided by the Southeast Regional
Climate Center)
- Average temperatures for November 2008 were below normal across
the entire region including Puerto Rico and the Virgin Islands.
Nearly half of the region, especially portions of SC, GA, and FL,
displayed temperatures that were 4.0 or more degrees °F (2.2
°) below normal. Florence and Columbia SC had their 2nd and
4th coldest Novembers on record, respectively, as Columbia recorded
11 straight days with a daily minimum temperature of less than 32
°F (0 °C). At least four significant cold frontal
passages were observed during the month. Strong areas of high
pressure filled in behind these fronts and provided for excellent
radiative cooling on many nights. There were 440 daily record lows
tied or beat during the month. Talladega, AL and Madison, FL
dropped to 14 ° and 20 °F (-10 and -7 °C),
respectively on the 22nd of the month. Also, Burkes Garden, VA and
Waynesville, NC recorded minimums of 2 ° and 7 °F (-17
° and -14 °C), respectively, on the 19th and 22nd of the
month.
- There was much variability in the monthly precipitation totals
across the region. Florida, with the exception of its western
panhandle, recorded much below normal precipitation totals. In fact
portions of southern FL received less than 25% of the normal
precipitation for the month. In contrast, a region of above normal
precipitation stretched from portions of southern GA northeastward
across central SC, eastern NC, and southeast VA. Several locations
within this region recorded monthly totals that exceeded 200% of
normal. Precipitation totals for the month were below normal across
much of AL, western VA as well as drought stricken portions of
northern GA, northwest SC, and western NC. Most of Puerto Rico
recorded precipitation totals that were below normal for the month
of November. Three significant rain events (Nov. 3-4th, 14-15th
29-30th) contributed most of the precipitation for the month.
Savannah and Augusta, GA experienced the 3rd and 4th wettest
Novembers on record, respectively, with 5.69" and 7.24" (14.4 and
18.4 cm) of precipitation observed. Cape Hatteras, NC recorded its
3rd wettest November on record with 14" (35.6 cm) observed. Several
periods of strong northwesterly flow during the month resulted in
orographically enhanced snowfalls across the mountains of western
VA, NC and extreme northern GA. Banner Elk, NC recorded 6.2" (15.7
cm) of snow during the month making it the snowiest November since
1983. Also, Burkes Garden, VA measured 15" (38.1 cm) of snow for
the month making it the 2nd snowiest November for the period of
record, which extends back to 1896. Light snowfalls were also
recorded at several lowland stations including Greensboro NC, which
recorded 0.6" (1.5 cm) of snow on the 21st of the month. Even N.
Myrtle Beach SC observed snowflakes on the 18th of the month.
- There was very little change in the drought lingering across
portions of the region. Exceptional drought continued to plague
northwestern South Carolina and expanded into extreme northeastern
GA and extreme western NC. Moderate drought conditions continued to
affect central GA and extreme northeastern AL as well as
southwestern VA and northeastern NC. There were 11 preliminary
tornado reports across the region during the month, and they were
all associated with a nighttime outbreak across eastern SC and NC
on the 14th - 15th of the month. One of the tornadoes registered as
an EF-3 on the enhanced Fujita scale and was responsible for two
deaths near Wilson, NC. There were 17 tropical cyclones (i.e.
tropical storms and hurricanes) observed over the Atlantic basin
and adjacent waters through the end of November of 2008, and six of
these had some impact in the southeastern U.S.
For more information, please go to the Southeast Regional
Climate Center Home Page.
High Plains Region:
(Information provided by the High Plains
Regional Climate Center)
- Overall, November was warmer than normal across the region.
Monthly average temperature departures from normal generally ranged
from 2-6°F (1.1-3.3°C), however several locations
exceeded 8°F (4.4°C) above normal. Record setting
locations include Northglenn, CO, Clark 3 NE, WY, Lander Hunt
Airfield, WY, and Chugwater, WY. Northglenn, CO had an average
temperature of 46.8°F (8.2°C) which was the 2nd warmest
November on record. Clark 3 NE and Lander Hunt Airfield both had
their 3rd warmest November on record with each location having an
average temperature of 38.8°F (3.8°C) and 38.6°F
(3.8°C), respectively. Meanwhile, Chugwater, WY experienced
the 4th warmest November on record with an average temperature of
42.1°F (5.6°C).
- Areas that received above normal precipitation include North
Dakota, the western half of South Dakota, and northwest Nebraska.
Drought conditions have improved across western North Dakota where
many locations received over 200% of normal precipitation. On the
other side of the state, many locations received over 300% of
normal precipitation. One particularly wet location was Cavalier
7NW, ND which received 2.97 inches (75.4 mm) of precipitation, or
437% of normal. This was the 3rd wettest November on record for
Cavalier.
Dry locations included Wyoming, Colorado, Nebraska, Kansas and
north central South Dakota with less than 50% of normal
precipitation. The Perry Stokes Airport in Trinidad, CO did not
record any measurable precipitation and tied the record for driest
November (last set in 1965).
- A blizzard struck western South Dakota early this month. While
most areas received at least 10 inches (25.4 cm) of snow, the storm
brought over 48 inches (121.9 cm) of snow to certain areas in the
Black Hills. In addition to the snow, winds over 60 mph (96 km/h)
were reported. This powerful storm created travel woes as not only
were roads closed, but so was the Rapid City Regional Airport.
Power was also cut to many people as the blizzard damaged or
destroyed power poles and power lines.
For more information, please go to the High Plains
Regional Climate Center Home Page.
Southern Region:
(Information provided by the Southern
Regional Climate Center)
- In the month of November, average temperatures in the Southern
Region were generally near normal, with the exception of northern
Texas and western Oklahoma, where monthly temperature departures
varied by as much as 4 to 6°F (~2-3°C) above normal.
Elsewhere, temperature averages for the month remained within
4°F (~2°C) of normal.
- For most of the southern region, precipitation was quite scarce
during the month of November. Only small pockets of above normal
monthly precipitation values were observed, specifically in north
central Louisiana, eastern Texas, and southeastern Mississippi.
Western and central Texas observed the largest precipitation
deficits for the month, with many stations reporting 5% or less of
normal. Similar values were also observed in western and southern
Oklahoma. In the state of Arkansas, most stations in the southern
most counties did receive as much as 50-70% of normal, however;
elsewhere the bulk of the stations received only 25-50% of normal
precipitation for the month. Similar values were also observed in
southeastern Louisiana, western Tennessee, and northern
Mississippi.
- Drought conditions in the Southern Region have changed slightly
over the past month. Due to extremely dry conditions in central and
southern Texas, the United States Drought Monitor has now
recognized a small area of exceptional drought (D4) in the Austin,
TX area. This is the highest level of drought that is recognized by
the United States Drought Monitor. The area of D4 drought extends
from just north of Austin, to just south of New Braunfels. It also
extends east to an area just west of Bastrop, and it extends west
to an area just west of Johnson City and Blanco. Areas in Texas of
lesser drought that surround the bullet of D4 have changed little
over the past month, indicating persistently dry conditions.
Similarly, drought has also continued to persist in eastern
Tennessee. In Tennessee, there has been a slight westward migration
of extreme and moderate drought. Conditions in the western half of
the state have also deteriorated slightly from near-normal to
abnormally dry.
For more information, please go to the Southern
Regional Climate Center Home Page.
Western Region:
(Information provided by the Western
Regional Climate Center)
- Temperatures were above to well above normal for almost the
entire western region except for some isolated pockets in New
Mexico. The greatest temperature departures occurred in Montana and
Wyoming with Havre, MT recording their warmest November since 1917.
Helena, MT was 9.5 °F (5.3 °C) above normal, and
Bozeman's departure of +10.2 °F (+5.7 °C) was the 3rd
highest since airport records started in 1941. The average maximum
temperature in downtown Los Angeles was 77.7 °F (25.4 °C)
which combined with October's average maximum temperature of 84.9
°F (29.4 °C) was the warmest Oct-Nov average maximum on
record.
- Precipitation was a mixed bag with extreme northwest
Washington, southern California and portions of the northern
Rockies recording wetter than normal conditions. With the warm
conditions, however, mountain snowpack remained well below the
December 1st average. The Lake Tahoe drainage was at 3% of normal
snowpack on December 1st and had fallen to just 2.0 inches (5.1 cm)
above its natural rim. An unusually wet system crossed southern
California on the 26th producing locally heavy rain and flooding in
some areas. It was the wettest November on record in Yuma, AZ, with
2.2 inches (5.6 cm), all of it falling on the 26th and
precipitation percentages of 500-1100 percent of average noted in
many places. An automated station near Quinault, WA, measured 28.1
inches (71.4 cm) for the month.
- During November 1-4, the first serious winter storm of the
season hit the Sierra beginning on October 31st. Rainfall totals in
some areas were over 6 inches throughout the 5-day event with winds
reaching over 115 mph along the Sierra Crest on the 3rd. Snow
levels were relatively high during most of the event with up to 2
feet falling above the 8,000 foot level. This was the only
significant event in the central Sierra for the month.
On the 6th, 73 mph winds and heavy snow produced blizzard
conditions in parts of northeast Wyoming with drift up to 4 feet
high in Sundance. This same storm dropped over 4 feet of snow in
the Black Hills of South Dakota.
During the 6th and 7th of the month, 3 to 7 inches of rain in
the Olympic Peninsula and up to 10 inches in the Cascades caused
numerous rivers in western Washington to exceed flood stage. Major
flooding occurred on 7 out of 11 rivers in the region.
Fueled by strong downslope winds three separate wildfires
destroyed numerous homes and required large mandatory evacuations
from Santa Barbara to San Diego on the 13th - 17th. Wind gusts
reached over 70 mph with temperatures in the mid 80's and low 90's
accompanied by very low humidities. A total of over 41,000 acres
were burned with over 1000 homes destroyed and up to 15,000 people
evacuated during the wind event.
On the 26th, a storm crossed the southwest producing locally
heavy rain with some flash flooding and local road closures in
parts of southern California accompanied by lightning and spotty
hail. Yuma, AZ, reported 2.22 inches of rain which totaled more
rain than the first 10 months of 2008 combined. Amounts near Las
Vegas ranged up to just over 1.50 inches (3.8 cm).
For more information, please go to the Western
Regional Climate Center Home Page.
Alaska: (Information provided by Audrey
Rubel at NOAA NWS Alaska Region Headquarters.)
- Much of Alaska experienced below average temperatures during
November with an average of 2.3°F (1.3°C) below the
1971-2000 normal. November temperatures were uniformly above
average for southeast Alaska with the greatest departures from
normal occurring over the northern and central inner channel
locations. In Fairbanks the average temperature was -1.4°F (
-17°C) which was 3.7°F ( 2.1°C) below normal and
ranked as their 30th coldest in the 104 year period of record. For
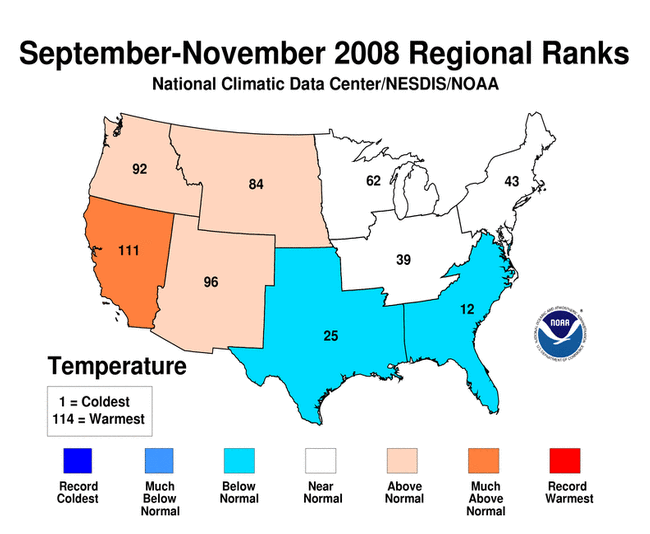
the September - November period, the average temperature of
20.0°F (-6.7°C) was more than four degrees below normal
and is tied with 1999 for the 10th coldest autumn on record.
Kotzebue's temperature for November averaged 5.6°F
(-14.7°C) which was a 2.7 °F (1.5°C) departure from
normal. The average temperature for the month in Nome was 9.1
°F (-12.7°C). This ties the mark for the 13th coldest
November on record. Further north, Barrow experienced a warmer than
normal temperature for the month, as the average was 4.9°F
(-15.1°C) above the mean.
- The state of Alaska posted monthly precipitation totals that
were near normal for the month of November. Precipitation across
the panhandle was below normal for the month of November with the
exception of the central inner channel and southern locations. In
Fairbanks, the airport recorded 0.28 inches (7.1 mm) of
precipitation. The snowfall, totalling 6.5 inches, (165 mm) was
less than half of normal. This marks the 25th driest November on
record for Fairbanks. Precipiation and snowfall were below normal
for Kotzebue and Nome. In Nome, the total precipitation for January
through November was 9.92 inches (252 mm), making the year through
November the 8th driest on record. For the month in Barrow, there
was 12.3 inches (312 mm) of snow which is four times the average
amount of 3.2 inches (81 mm). This ranks as the 5th snowiest
November on record. For the period from October through November,
there has been 35.5 inches (902 mm) of snow, making it the 2nd
snowiest period on record. The most snowfall during this period was
in 1925 when 40.2 inches (1021 mm) was recorded.
|