National
Temperatures

larger
image
|
The graph to the left
shows monthly mean temperature averaged across the contiguous
United States based on long-term data from the U.S. Historical
Climatology Network (USHCN). The value is
estimated from preliminary Climate Division data using the first difference approach.
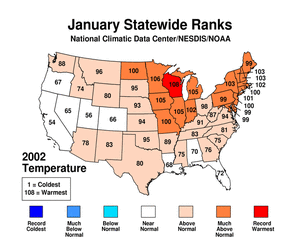
January 2002 ranked as the seventh warmest January
in the 1895 to present record. The preliminary nationally averaged
temperature was 35.4° F (1.9° C) which was 4.5° F
(2.5° C) above the long-term mean. The January temperature values
from 1895 through 2002 are available. |
| It is interesting to
note that January temperatures in the last five years were above
normal.
The Mean
500mb Height and Anomalies chart shows no large negative or
postive anomalies over the contiguous United States. A prominent
upper level ridge of high pressure anchored over the eastern half
of the United States during January promoted unseasonably mild
weather across the country east of the Rockies. Seasonably cool
temperatures were common across the Inter-Mountain West.
A more detailed analysis
including how statewide and regionwide temperatures compare to
other years is available.
|

larger
image
|
Temperature Departures
| The map to the right,
based on approximately 250 airport stations, shows departures from
the 1961-1990 normal temperatures for January 2002. Only portions
of northern Utah and southern California had negative temperature
anomalies greater than 1.8° F (1° C). Most of the rest of
the contiguous states experienced unusually warm weather, with the
largest positive anomalies of 9° F (5° C) or greater over
Montana eastward through the northeastern quarter of the country.
The bulk of Alaska had large positive anomalies with some negative
anomalies on the west coast. Temperatures in Puerto Rico and Hawaii
were near average. |

larger
image
|

larger
image
|
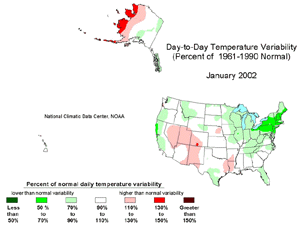
The unusually warm
departures of monthly mean temperature were associated with above
normal persistence of daily temperatures. This is reflected in
below normal day-to-day temperature variability particularly in the
Northeast, as seen both in the map to the left and in an animated map of daily temperature
anomalies. |
National Precipitation

larger
image
|
The graph to the left
is a time series depicting precipitation averaged across the
nation. Based upon preliminary precipitation data, January 2002 was
slightly below average, ranking near the middle of the historical
distribution. While nationally averaged precipitation was near the
long term mean, there was considerable regional variability.
Arizona and Minnesota were
notably dry receiving much below normal precipitation for the
month. |
| On the 2nd and 3rd, a
rare southern winter storm left its mark in seven states from
Lousiana to Virginia. A dusting to as much as 14 inches (35.6 cm)
of snow caused thousands of traffic accidents, closed schools and
businesses and cut power to tens of thousands (AP). On the 7th, a
separate system dropped up to a foot (30.5 cm) of heavy, wet snow
in West Virginia, contributing to one death and leaving thousands
in the dark (AP). In Washington and Oregon, two-day heavy rains
totalling up to 6.5 inches (165.1 mm) sent rivers out of their
banks and prompted mudslides that blocked traffic. Later in the
month, more than 8 inches (203.2 mm) of rain fell in Tennessee and
was blamed for the deaths of five people. The Tennessee Emergency
Management Agency said that nearly one quarter on Tennessee's
counties experienced flood damage from this event. (AP) |

larger
image
|
| Rainfall caused
flooding in northern Alabama as well, with seven day totals
surpassing 7 inches (177.8 mm). Heavy rains closed roads, flooded
creeks and rivers and forced residents to evacuate in Lauderdale
County. (AP) Late in the month (on the 27th) heavy snows fell in
the Pacific Northwest and were blamed for the deaths of two
motorists. (AP) On the 29th, record rainfall fell at several Hawaii
recording stations and severe storms caused millions of dollars in
flood damage. The Hilo airport shattered their January 24-hour
rainfall record of 9.51 inches (241.6 cm). The new record was 12.47
inches (316.7 mm).
A more detailed analysis
including how statewide and regionwide precipitation compares to
other years is available.
|
Precipitation Anomalies
| The map to the right,
based on approximately 250 airport stations, shows January 2002
total precipitation as a percent of the 1961-1990 station normals.
Above normal precipitation generally occurred in coastal Washington
and Oregon, a large area centered around the Southern Plains, along
the Mississippi Valley and in North Carolina. The rest of the
country was mostly dry. Northern and southeastern Alaska were dry
as well, with the rest of Alaska and Hawaii being wet. Puerto Rico
was near normal. |

larger
image
|
National
Snow Cover
A storm in early January left
portions of Georgia, South Carolina, North Carolina and Virginia
blanketed in snow. Areas of north central North Carolina received
up to 14 inches (35.6 cm) of snow. In South Carolina, the governor
activated the National Guard to assist stranded drivers. A separate
storm system left areas of West Virginia under up to a foot (30.5
cm) of new snow, contributing to one death and cutting power to
thousands of residents (AP). Late in the month on the 27th,
snowstorms in the Pacific Northwest were blamed for the deaths of
two motorists in western Washington (AP).
November-January
Temperatures

larger
image
|
The graph to the left
shows monthly mean temperature averaged across the contiguous
United States based on long-term data from the U.S. Historical
Climatology Network (USHCN). The value is
estimated from preliminary Climate Division data using the first difference approach.
November-January 2002 ranked as the warmest such
period in the 1895 to present record. The preliminary nationally
averaged temperature was 39.9° F (4.4° C) which was
4.3° F (2.4° C) above the long-term mean. |
| November 2001-January
2002 ranked as the warmest November-January nationally in the
1895-2002 record. This is due largely to an extensive area of much
above normal temperatures, and the lack of very cold temperatures,
during each of these three months. As seen in the graph to the
right, two-thirds of the contiguous U.S. was unusually warm in
November 2001, followed by about a fifth of the country unusually
warm in both December and January. |

larger
image
|

larger
image
|
November 2001-January
2002 ranked as the warmest November-January nationally in the
1895-2002 record. The second warmest November-January occurred just
two years ago, in 1999-2000, while the third warmest occurred back
in the drought decade of the 1930s, 1933-1934. The statewide
pattern of warmth for these top three November-January periods is
shown on the accompanying maps. The 2001-2002 November-January
warmth (the orange and red much above normal shadings on the maps)
occurred from the northern and central Great Plains states to the
east coast. |
During 1999-2000, the warmth was centered from the Mississippi
River to the west coast. On both of these maps, none of the Lower
48 States averaged below normal. During 1933-1934, the unusual
warmth stretched from the Southeast to the entire west coast, with
a pocket of very cold temperatures in the Northeast.
 NOAA's National Centers for Environmental Information


