 |
Contents of This Report:

The North American 500 mb Maps for February
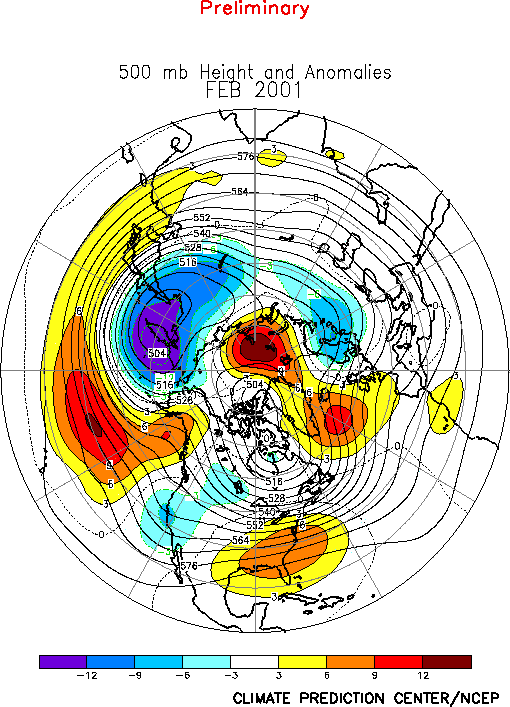
| The upper-air pattern during February reflected positive height anomalies over the eastern United States which were associated with above normal surface temperatures. A series of upper-level troughs moved across the western part of the nation bringing below normal temperatures to the west coast through the northern Rockies to the upper Midwest. Occasional troughiness in the Northeast brought snowfall to some areas.
Additional information on hydrometeorological analysis and forecasting can be found at the Hydrometeorological Prediction Center's Web Page. The principles behind the 500 mb flow are briefly explained here. |
 |
 National Temperature - February
| |
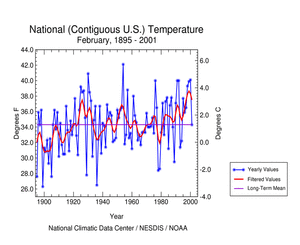
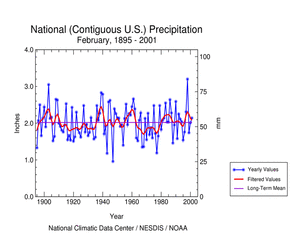
The graph to the left shows February monthly mean temperature averaged across the contiguous United States based on long-term data from the U.S. Historical Climatology Network (USHCN). The 2001 value is estimated from preliminary Climate Division data using the first difference approach. February 2001 ranked near the middle of the historical distribution. The preliminary nationally averaged temperature for February 2001 was 34.66° F(1.48° C) , 0.3° F (0.17° C) above the long-term mean. The previous six Februarys have been above the long-term mean. The actual February temperature values from 1895 through 2001 are available. |
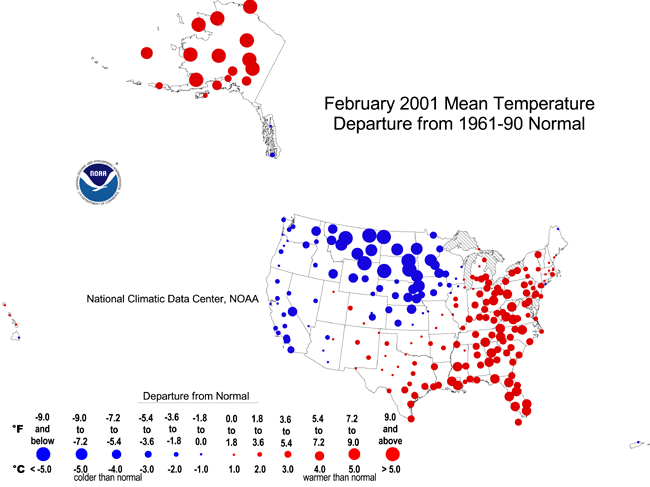
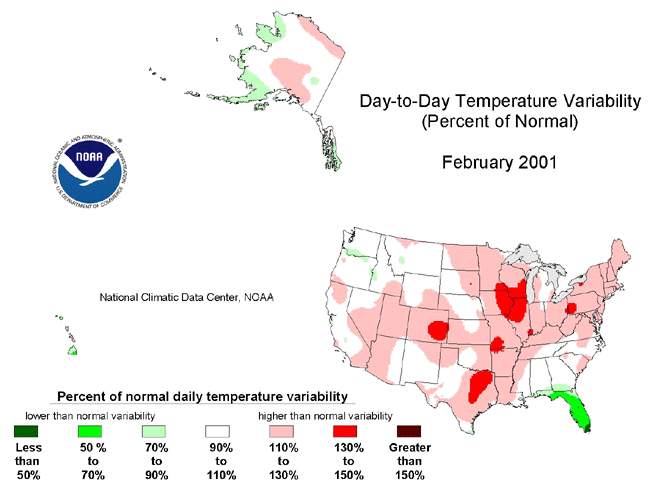
| The map to the right, based on approximately 250 airport stations, shows departures from the 1961-1990 normal temperatures for February 2001. In general, most of the nation east of a line from Michigan through Missouri into New Mexico was warmer than normal. Areas west of this line were generally cooler than normal, especially in the West North Central region. The above normal daily temperature variability over the contiguous United States generally corresponded to the February storm track.
Most of the Alaska and Hawaii reporting stations were warmer than normal. For further regional analysis, view NCDC's regional page. |
 |
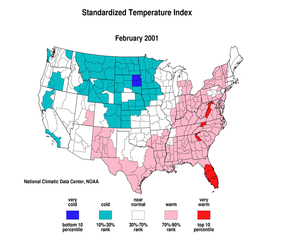 |
The standardized temperature anomalies for February 2001 were above normal east of the Mississippi River and in New Mexico through central and southern Texas into Louisiana and Arkansas. Below normal indices occurred in parts of the west coast states and a large part of the north-central US. The month averaged near normal across most of the rest of the country. The adjacent animated map shows the geographical pattern of temperature anomalies for the last 12 months compared to a base period of 1931-1990. For further regional analysis, view NCDC's regional page. |
National Precipitation - February
 |
Based upon preliminary precipitation data, February 2001 ranked as the thirty-eighth wettest such month since records began in 1895. This rank tied with the years 1950, 1951 and 1982.
The preliminary National Precipitation Index ranked February 2001 as the twenty-sixth wettest February, tying with 1961. Seven of the last ten Februarys have had positive index values. |
| The map to the right, based on approximately 250 airport stations, shows February 2001 total precipitation as a percent of the 1961-1990 station normals. Above normal precipitation generally occurred over California and from central Texas through the central Plains into Michigan. Stations in Puerto Rico were also wetter than normal. Below normal precipitation occurred over much of the rest of the country including the Hawaiian stations. A ridge of high pressure over eastern sections of the state was associated with generally dry conditions in the east and wetter than normal conditions in western parts of the state. For further regional analysis, view NCDC's regional page. | 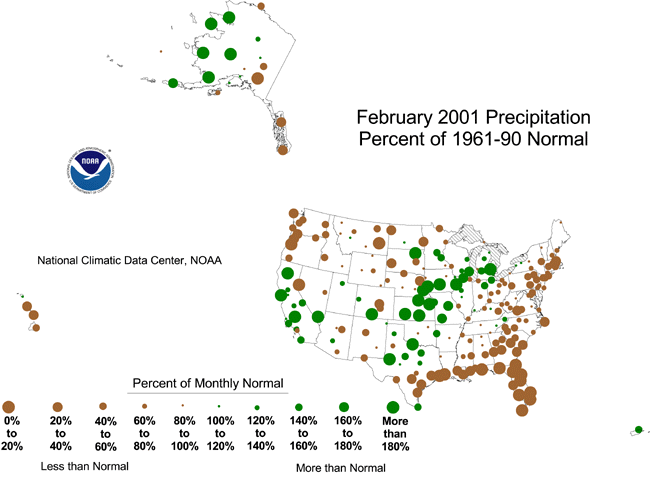 |
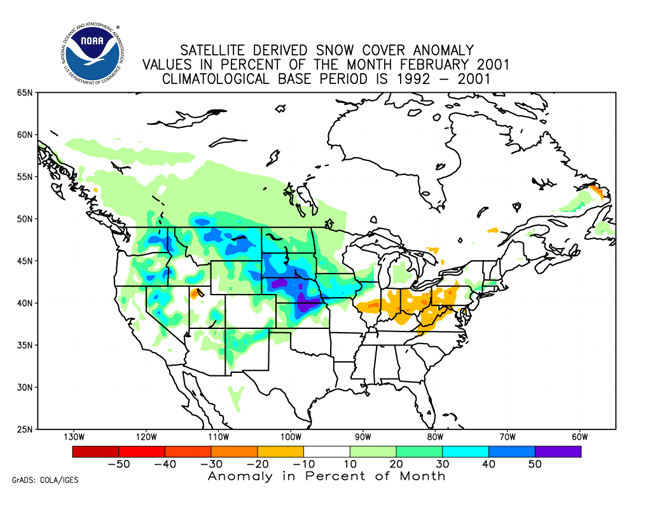 |
Snow cover duration for February 2001, as observed by satellite, exceeded the 1992-2001 average over much of the western and central portions of the nation. |
|
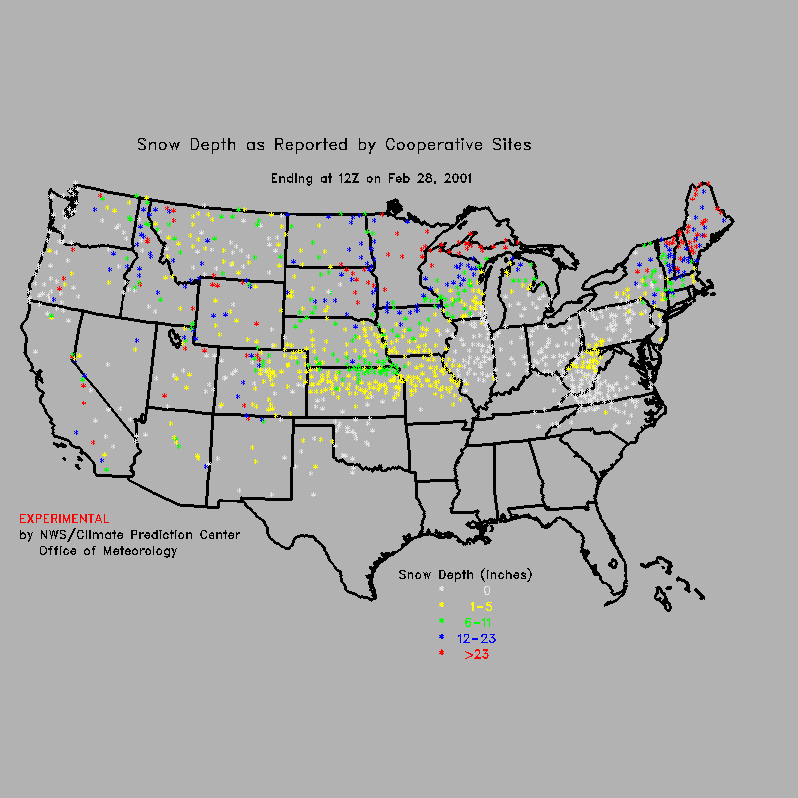
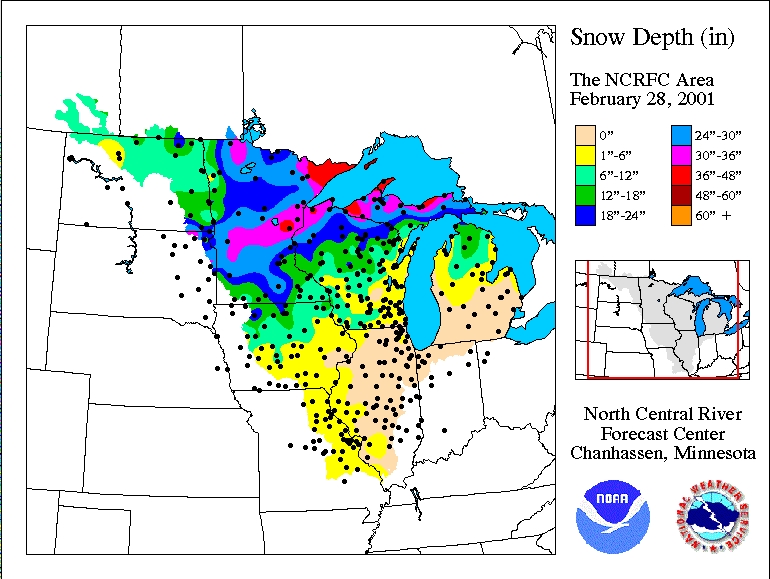
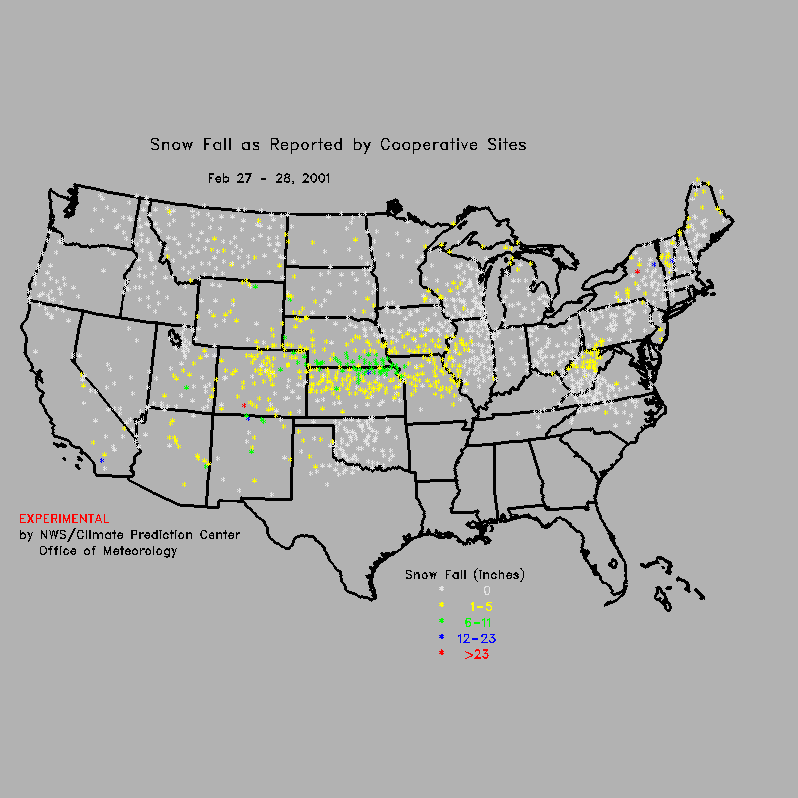
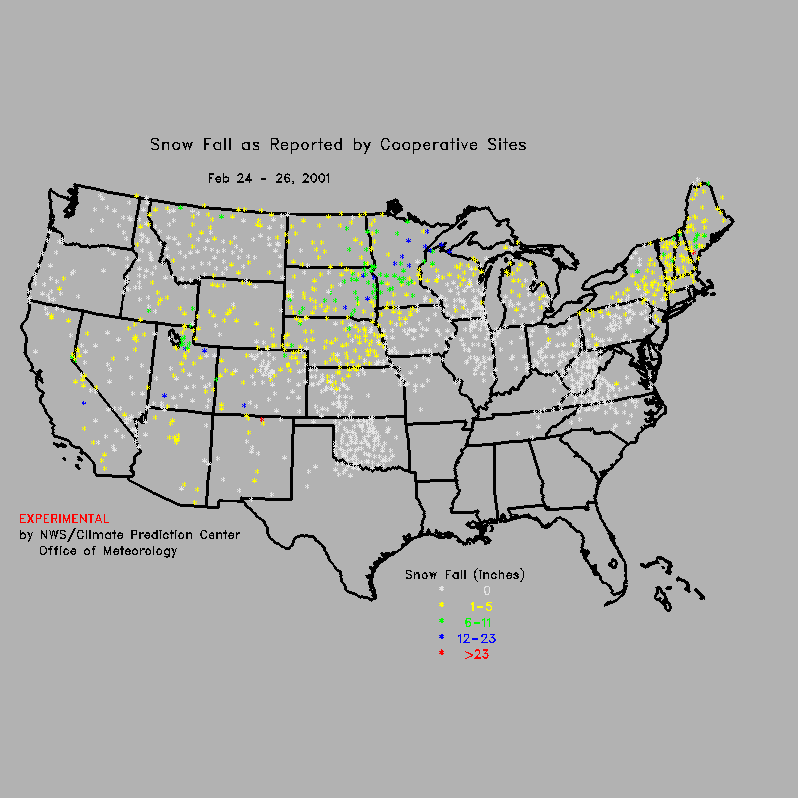
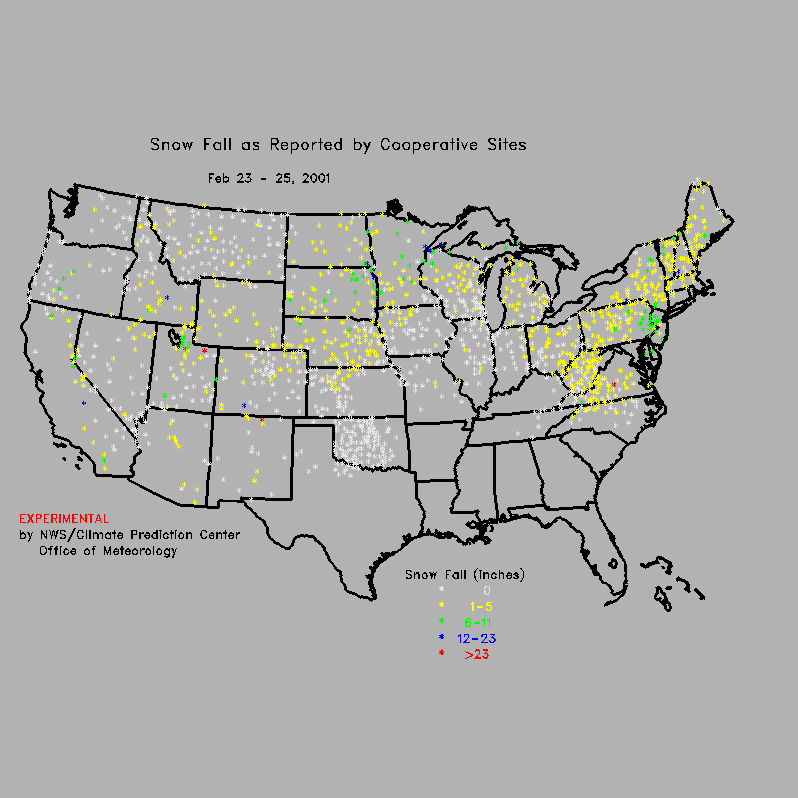
Although snow cover extent in the western U.S. (as shown in the extent and duration map above) was above the 1992-2001 average, snow depth as indicated by mountain snowpack was well below the long-term normal in many western river basins. This has raised concerns over spring and summer water supplies, which are heavily dependent on the mountain snowpack accumulated during the winter months. The northern Plains states remained snow covered throughout the month. Snow depth at the end of February ranged from one to two feet (30 to 60 cm) in the eastern Dakotas to over three feet (90 cm) in parts of Minnesota and Upper Michigan. The median snow depth for this time of year in northern Minnesota and Upper Michigan, based on historical records over the past 50 years, ranges from one foot (30 cm) in the eastern Dakotas to two feet (60 cm) in upper Michigan. Snow cover in the central Plains states waxed and waned during the month. The favored storm track was across the central part of the country, with a series of storms dumping snow over the central and northern Plains. Two storms, one during February 9-10 and the other during the 27th and 28th, dumped up to a foot (30 cm) of snow along the Kansas-Nebraska border, and a snowstorm during the last week of the month added over a foot (30 cm) to parts of the northern Plains. The February 9-10 storm downed power lines and closed schools and government offices from Iowa to Wisconsin. Much of the Northeast remained snow covered throughout the month. Snow depth at the end of February in parts of the region ranged from one foot (30 cm) to well over three feet (90 cm). A snowstorm on the 5th dumped up to 38 inches (97 cm) of snow on Newport, NH and brought power outages and flight cancellations to much of the region. Another snowstorm that moved across the region beginning February 22 resulted in at least 11 deaths in Virginia, New Jersey, Pennsylvania, North Carolina, West Virginia and Maryland combined. The largest traffic accident �- a 120 car pile-up -- occurred in northern Virginia just outside of Washington, DC. |
| Data collected by NOAA's TIROS-N polar-orbiting satellites and adjusted for time-dependent biases by NASA and the Global Hydrology and Climate Center at the University of Alabama in Huntsville indicate that temperatures in the lower half of the atmosphere (lowest 8 km) were the fifth coldest since 1979 over the U.S. for February 2001. The average lower tropospheric temperature over the continental U.S. was 0.56° C (1.01° F) below the 1979-1998 mean. This contrasts sharply with the previous two Februarys which have been above the mean. | 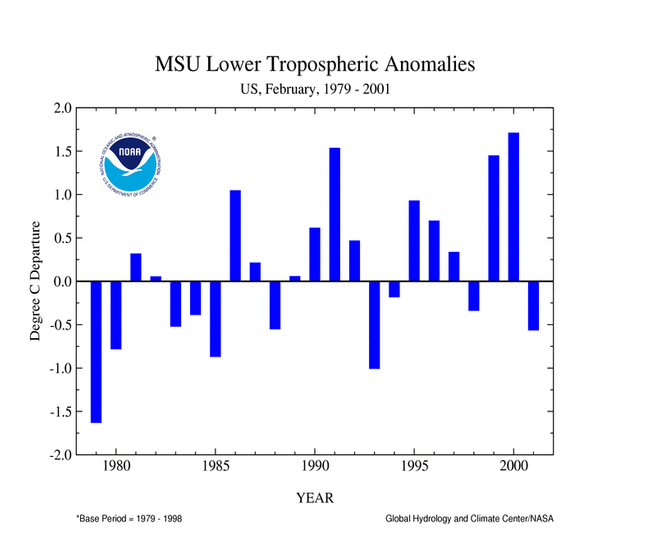 |
- Current data are based on preliminary reports from River Forecast Center stations and First and Second Order airport stations obtained from the National Weather Service (NWS) Climate Prediction Center and real time Global Telecommunications System (GTS) monthly CLIMAT summaries. THE CURRENT DATA SHOULD BE USED WITH CAUTION. These preliminary data are useful for estimating how current anomalies compare to the historical record, however the actual values and rankings for the current year may change as the final data arrive at NCDC and are processed.
The following NCDC datasets are used for the historical U.S. data: the climate division drought database (TD-9640), and the hurricane datasets (TD-9636 and TD-9697). It should be noted that the climate division drought database consists of monthly data for 344 climate divisions in the contiguous United States. These divisional values are calculated from the 6000+ station Cooperative Observer network.