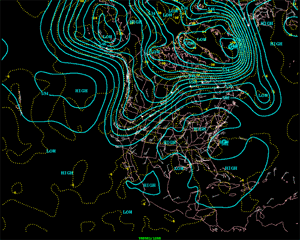
The North American 500 mb Maps for September
The dominant upper-level flow pattern during September showed a more active and variable pattern when compared to the recent summer months. This is to be expected for the transitional month of September. Several upper-level troughs dropped southward from Canada during the month providing slightly cooler than normal temperatures for much of the country from the Rockies to the south Atlantic region. High pressure dominated both the Pacific coast and the Northeast promoting warmer than normal conditions.
The southwesterly flow ahead of progressive areas of low pressure aided in providing abundant, if not excessive, rainfall in areas where drought was the headline just a month before. Several frontal passages along with two episodes of tropical rainfall provided precipitation for portions of the Southeast and Northeast regions.
| High pressure dominated areas along the west coast and, in conjunction with a northwest flow, allowed for drier than normal conditions from the Pacific coast, south and eastward to the mid- and lower Mississippi valley regions.
|
animation
|
Additional information on drought conditions in the United States can be found on the NCDC Drought in the U.S. page. Additional information on hydrometeorological analysis and forecasting can be found at the Hydrometeorological Prediction Center's Web Page. The principles behind the 500 mb flow are briefly explained Here.

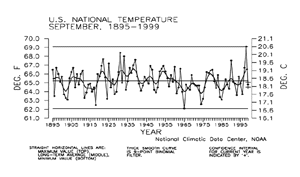
 National Temperature - September
| Preliminary data for September 1999 indicated that the monthly mean temperature averaged across the contiguous United States was near the long-term mean. About four percent of the country was much warmer than normal while less than one percent of the country was much cooler than normal.
|
larger image
|
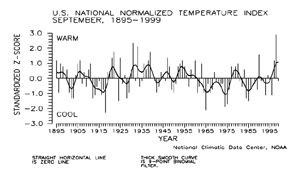
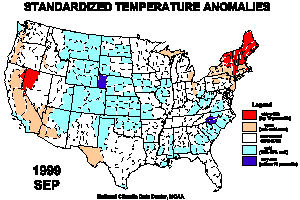
| The preliminary September 1999 national standardized temperature index ranked September 1999 near the long-term mean.
|
larger image
|
larger image
|
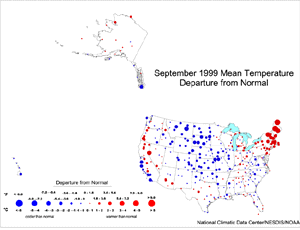
Several episodes of deepening upper-level troughs allowed cool air to spill down from the Canadian prairie and migrate south and eastward during September. This provided cooler than normal conditions for the northern and central plains states from the Rockies to the Mississippi River and southward to northern Texas.
|
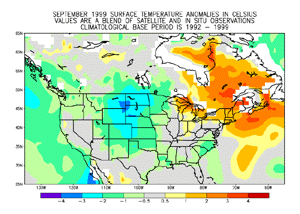
Separate ridges of high pressure dominated both the Pacific and Atlantic coasts. The Pacific coast ridge kept the extreme western states at- to slightly below normal while the Atlantic coast ridge provided much warmer than normal conditions, especially for New England. The temperature anomaly map above is based on a blend of surface station data and satellite data.
| The map to the right, based on approximately 250 airport stations, shows departures of average temperatures for September 1999. The series of upper-level troughs and associated cool Canadian air masses brought below normal temperatures to the central part of the country, while upper ridges dominated the Pacific coast and Northeast. The Alaskan stations were predominantly near normal, while the stations in Hawaii averaged slightly cooler than normal.
|
larger image
|
larger image
|
The map animation to the left shows the geographical pattern of temperature anomalies for the last 12 months, compared to a base period of 1931-1990. On these standardized temperature anomaly maps, the color scheme ranges from blue (cold) to red (warm):
red = top 10 percentile
tan = 70-90 percentile
light blue = 10-30 percentile
dark blue = bottom 10 percentile.
|
Temperature Variability
larger image
|
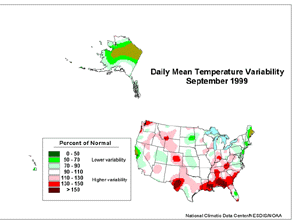
The September temperature variability map over the contiguous U.S. has several patchy areas of above and below normal variability. However, they fit an overall pattern for much of the country. Frequent frontal passages brought persistent cool air masses to the northern and central Plains, where variability was below normal. These same fronts reached the Deep South, which was unusual for September, thus bringing above normal temperature variability.
|
The mid-Atlantic to Northeast states were largely influenced by a stable upper level ridge. The remnants of hurricanes Dennis and Floyd tracked along the edge of this ridge, bringing persistently cloudy conditions with a warm, moist tropical flow and below normal variability. Both Alaska and Hawaii were dominated by below normal variability.
National Precipitation - September
larger image
|
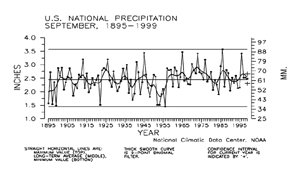
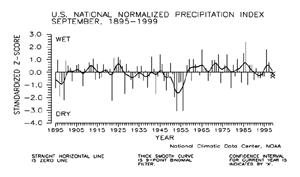
Based upon preliminary data, September 1999 ranked near the long-term mean for precipitation. Nearly 13% of the country was much drier than normal while about ten percent of the country was much wetter than normal.
|
| The preliminary national standardized precipitation index ranked September 1999 near the long-term mean.
|
larger image
|
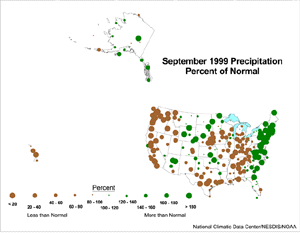
The map immediately below, based on approximately 250 First Order airport stations, shows September 1999 total precipitation as a departure from 1961-1990 station normals.
| The predominant pattern for the contiguous U.S. consisted of two areas of widespread dryness contrasted with two other areas of widespread wetness. The remnants of hurricanes Dennis and Floyd brought record September rainfall to many areas along the east coast, while cold fronts and low pressure areas moving in the upper flow brought abundant precipitation to the northern Plains to central Rockies. Drought continued from the Ohio Valley to Southeast and southern Plains areas, which were south of the predominant storm track. A predominant upper-level ridge kept the month dry in the Far West.
|
larger image
|
It should be noted that percent-of-normal statistics in southern California can sometimes be exaggerated due to the normally dry September climate. Stations in the central Hawaiian Islands were unusually dry in September 1999, while most stations in Alaska were above to much above normal.
larger image
|
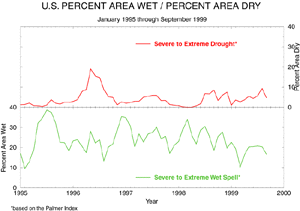
Long-term drought areal coverage (as measured by the Palmer Drought Index) decreased slightly when compared to August, with September 1999 having about five percent of the country in severe to extreme drought. The percent area of the country experiencing severe to extreme wetness decreased slightly to about 17%.
|
National Temperature - January-September
larger image
|
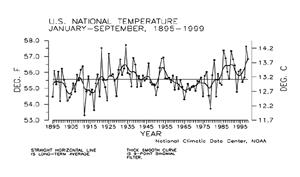
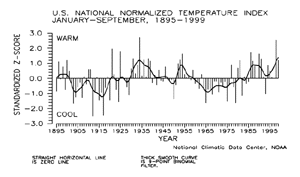
Preliminary temperature data indicate that the year-to-date, January-September 1999, was the 11th warmest January-September period since records began in 1895. About 13% of the country averaged much warmer than normal while about one percent of the country averaged much cooler than normal.
|
| The preliminary national standardized temperature index ranked January-September 1999 as the 13th warmest January-September on record.
|
larger image
|
National Precipitation - January-September
larger image
|
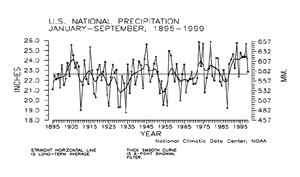
Preliminary precipitation data indicate that the year-to-date, January-September 1999, ranked near the long-term mean for nationally averaged precipitation summed across the nine month period. About six percent of the country was much wetter than normal for this period while an additional six percent of the country averaged much drier than normal.
|
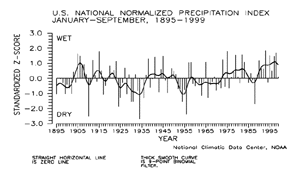
| The prelimininary national standardized precipitation index for January-September 1999 also ranked near the long-term mean.
|
larger image
|
Tornadoes - September and Year-to-date
larger image
|
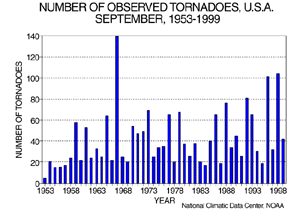
During September 1999, 42 tornadoes were documented across the contiguous United States. The 46-year average is 42. The most tornadoes observed in the September record was 139 in September 1967, while the least amount was 5 in September 1953.
|
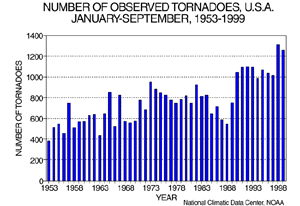
| For the year-to-date, January-September 1999, 1257 tornadoes have been documented. This ranks as the second most active year-to-date, behind the count of 1306 recorded in 1998. The least amount was 382 in 1953.
|
larger image
|
It should be pointed out that the preliminary tornado count is traditionally higher than the final count and that the tornado observations have generally improved with time as better observing practices and instrumentation (especially weather radar and satellites) were utilized.
Current data are based on preliminary reports from River Forecast Center stations and First and Second Order airport stations obtained from the National Weather Service (NWS) Climate Prediction Center and real time Global Telecommunications System (GTS) monthly CLIMAT summaries. THE CURRENT DATA SHOULD BE USED WITH CAUTION. These preliminary data are useful for estimating how current anomalies compare to the historical record, however the actual values and rankings for the current year may change as the final data arrive at NCDC and are processed.
The following NCDC datasets are used for the historical U.S. data: the climate division drought database (TD-9640), and the hurricane datasets (TD-9636 and TD-9697). It should be noted that the climate division drought database consists of monthly data for 344 climate divisions in the contiguous United States. These divisional values are calculated from the 6000+ station Cooperative Observer network.


