On March 15, a large iceberg broke off from Antarctica’s
Thwaites Ice Tongue, a large sheet of glacial ice and snow
extending from the Antarctic mainland into the southern Amundsen
Sea. The iceberg, designated B-22, covered an area of approximately
2,120 square miles (5,490 square kilometers), or roughly twice the
size of Rhode Island. In addition, the Larsen B Ice Shelf located
on the eastern side of the Antarctic Peninsula shattered
and separated from the continent during the last few months.
Warming
temperatures on parts of the Antarctic continent may be
contributing to recent ice shelf collapses such as this.
Asia (Click for map)
|
A
series of dust storms originating from the Gobi Desert affected
the northern provinces of China, from Inner Mongolia eastward to
the Yellow Sea. Beijing experienced visibilities that dropped to
less than 90 meters (100 yards) on the 20th. China’s State
Forestry Administration estimated that 130 million people across
1.4 million square kilometers (540,500 square miles) of northern
China were affected by the dust storm. Drought across a large area
of northern China influenced the severity of the dust storms,
according to the China Meteorological Administration (Associated
Press). By mid-month, the large plume of dust had crossed into the
Sea of Japan, affecting South Korea and Japan.
|
 larger
image
larger
image
|
 larger
image
larger
image
|
Temperatures across a vast expanse of Asia were above average
during March, with monthly departures of 3-6°C
(5.4-10.8;deg;F). Weekly temperatures were as much as 18°C
(32°F) above average during mid-month across parts of Russia,
Kazakhstan and China.
|
|
The unusually warm weather in the region promoted a contraction
of snow cover across most areas south of 40° north latitude,
with the exception of higher elevation locations.
|
 Click for
loop
Click for
loop
|
 larger
image
larger
image
|
Below average precipitation characterized the weather across
much of Iran, Afghanistan and Pakistan during March, with monthly
precipitation ranging from 25-50 mm (0.98-1.97 inches) below
average. Afghanistan began its fourth consecutive year of drought,
with wet-season
precipitation through the end of March insufficient to eliminate
the ongoing long-term drought.
|
In southeast Asia, a prolonged drought is affecting
many provinces in Vietnam, where around 30,000 hectares (74,000
acres) of rice fields have been affected (COMTEX). Farther east
across the northern Philippines, seasonably dry weather affected
areas that were experiencing long-term
drought. In the Ilocos province over 7,000 hectares (17,300
acres) of farmland have been adversely impacted.
Europe (Click
for map)
 larger
image
larger
image
|
Dry conditions were
also prevalent, with monthly precipitation deficits of 25-50 mm
(0.98-1.97 inches) across parts of the British Isles, France, Italy
and the Balkans. |
|
Strong southwesterly winds ahead of a frontal system generated a
dust storm over Tunisia and parts of Libya at the beginning of the
month. The dust spread across Italy and Greece by the 3rd, reducing
visibilities locally.
|

larger
image
|
 larger
image
larger
image
|
During March, the
monsoon trough moved north of Australia with most wet-season
rainfall restricted to areas from New Guinea to the Soloman
Islands. As a result, much of northern Western Australia, the
Northern Territory, Queensland and South Australia recorded much
below average rainfall during the month. |
|
Temperatures in Australia were generally within 2°C
(3.6°F) of the average across the continent, with only parts of
the Northern Territory and Western Australia slightly cooler than
the mean
|
larger
image
|
 larger
image
larger
image
|
In the western Pacific
Ocean, tropical cyclone Mitag developed on
February 28th and strengthened into a typhoon by March 1st. Mitag
affected the islands in the Federated States of Micronesia during
the first few days of March, impacting
the main island of Yap on the third. Maximum sustained winds
were near 95 knots (~50 m/s or 110 mph) as the storm passed the
island, and the combination of strong winds, heavy rains and a
large tidal surge flooded many areas and destroyed many crops
(OCHA). |
Africa (Click
for map)
|
Rainfall during March was concentrated across central African
nations, including Angola, the Congo, and Gabon. Precipitation
exceeded 300 mm (11.8 inches) across much of this area, with
monthly surpluses of 25-50 mm (0.98-1.97 inches). A relatively dry
month across the maize triangle region of South Africa, southern
and central Mozambique, Zimbabwe, Zambia and Botswana exacerbated
drought in this region.
|
 larger image
|
 larger
image
larger
image
|
At least 565,000
people in central and southern Mozambique faced
serious food shortages due to prolonged drought conditions
(COMTEX). Across neighboring
Zimbabwe, the dry conditions have impacted the maize and
groundnut crops in Mhondaro, and local officials have estimated a
20-30 percent drop in anticipated maize harvest levels (COMTEX).
Farther south in Swaziland, government officials reported that more
than 150,000 people, over 10 percent of the country’s
population, faced starvation within the next 3 months (Associated
Press). |
|
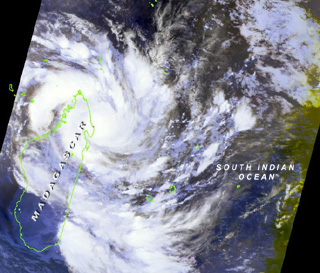
Tropical Cyclone Hary developed in the
Indian Ocean on the 6th and tracked westward, brushing the
northwestern tip of the island of Madagascar during the 9th-11th
with torrential
rains and strong winds. Maximum sustained winds were near 140
knots (160 mph or 72 m/s) as the cyclone passed near Antalaha,
Sainte-Marie Island and Toamasina. The storm recurved and weakened
over the open waters of the southern Indian Ocean.
|
 larger
image
larger
image
|
 larger
image
larger
image
|
The presence of dust
and above average temperatures has resulted in an epidemic of
meningitis
in Burkina Faso where over 670 deaths were reported since the
outbreak began in January (UN IRIN). Temperatures across most of
Africa remained within 2°C (3.6°F) of average during
March. |
 larger
image
larger
image
|
A distinct upper
level ridge of high pressure was associated with much warmer
than average temperatures across the western half of Alaska and
into the Northwest Territory where temperatures were 3-6°C
(5.4-10.8°F) above a 1971-2000 mean. Meanwhile, a pronounced
upper level trough of low pressure across most of southern Canada
promoted much colder than average temperatures over this region,
extending south into the northern tier of the United States.
Temperature departures were 3-6°C (5.4-10.8°F) colder than
average from the Canadian prairies southward into Montana and the
Dakotas. |
 larger
image
larger
image
|
Precipitation that was
near to or slightly above normal across the eastern third of the
United States brought some temporary relief to severe drought conditions
which extended from Georgia to Maine. Meanwhile, federal officials
declared a drought disaster for much of Montana due to the long
term dryness. |
While relatively dry conditions were common across the Alaskan
coastal mountains during March, a winter storm system dumped 28.7
inches (72.9 cm) of snow on Anchorage during the 16th-17th, setting
a new 24-hour snowfall record.
|
Seasonably dry weather continued in March across Central
America, where drought conditions persisted across much of Honduras
and Guatemala. The United Nations World Food Program (WFP) approved
an emergency operation in Guatemala to assist 155,000 people
suffering from acute malnutrition. In neighboring Honduras, at
least 30,000 people in the drought stricken provinces of Copan,
Santa Barbara and Lempira were suffering from food shortages and
malnutrition (ENN, WFP).
|
 larger
image
larger
image
|
 Infrared satellite animation
depicting
Infrared satellite animation
depicting
thunderstorms over western Ecuador
The date is March 3, 2002
|
Showers and
thunderstorms were persistent throughout the month of March across
portions of Peru and Ecuador along with areas of flooding. Coastal
provinces of Ecuador, including Guayas, Los Rios and Manabi were
most severely affected, with flooding responsible for 16 deaths and
over 1,700 homeless throughout the country (OCHA). Flooding
in Peru during the 16th-25th caused 13 deaths and damaged over
400 houses (COMTEX). |
| Relatively dry weather
dominated much of Brazil during March, but an increase in
precipitation during January and February prompted government
officials to lift
electricity rationing measures that had been in place since
last June. Many reservoirs which supply water to hydropower plants
had returned to more normal levels by the end of March. |
 larger
image
larger
image
|
 larger
image
larger
image
|
Farther south across
northern Argentina and Uruguay, heavy rainfall brought monthly
precipitation surpluses of 100-300 mm (3.94-11.81 inches). Artigas,
Uruguay received over 450 mm (18 inches) of rain during March,
nearly three times the normal monthly amount. |
 larger
image
larger
image
|
Above average
temperatures were confined mainly to southern Brazil, extreme
northern Argentina and much of Paraguay, with monthly departures of
1-3°C (1.8°F-5.4°F) above average. Meanwhile, a notable
upper
level trough of low pressure over southern Argentina and Chile
was responsible for temperatures that were 1-3°C
(1.8-°F-5.4°F) cooler than a 1992-2002 mean. |
References:
Basist, A., N.C. Grody, T.C. Peterson and C.N. Williams, 1998:
Using the Special Sensor Microwave/Imager to Monitor Land Surface
Temperatures, Wetness, and Snow Cover. Journal of Applied
Meteorology, 37, 888-911.
Peterson, Thomas C. and Russell S. Vose, 1997: An overview of
the Global Historical Climatology Network temperature data base.
Bulletin of the American Meteorological Society,
78, 2837-2849.


