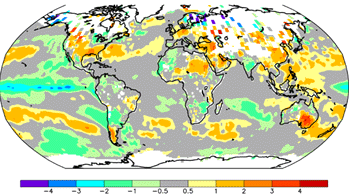
Temperature anomalies around the globe show unusually warm conditions over southeast China, southern Australia and New Zealand. The largest anomalies reached 3-6 degree C above normal. In contrast, unusually cool conditions covered portions of the Ukraine, northern Europe and Alaska . The largest cold anomalies occurred over south central India where temperatures averages 1-3 degrees C below normal. Cool waters in the east equatorial Pacific and warm waters in the west equatorial Pacific correspond with mature La Niña conditions. Warm anomalies in the southeastern U.S. stretch eastward into the Atlantic Ocean. Likewise, warm temperatures in southeastern Australia and eastern Asia spread eastward into the adjoining ocean.
| Temperatures across Africa showed a good deal of contrast during the month. It was cooler than normal across southern portions of Mozambique, Madagascar, these cool anomalies are associated tropical storm Alda.. A trough over northwest Africa kept that region cooler than normal. In contrast a ridge of high pressure prevailed over interior sections of the Arabian peninsula and northeastern Africa keeping them warmer than normal. Other areas with warm anomalies include: the Ivory coast and South Africa. |
 larger image |
 larger image |
Some of the warmest surface anomalies across the globe occurred over southeastern China where temperatures averaged 3 to 5 degrees C above normal. Warmer than normal conditions stretched across from Indochina westward into northern India and Pakistan. Further south in Pakistan temperatures were cooler than normal with the coolest anomalies occurring over the central Indian peninsula. There were also cool anomalies across the southern Mekong River valley. |
| Summer continues to be quite hot across portions of south central and southeastern Australia and New Zealand, where a heat wave is driving temperatures as much as high as 6 degrees C above normal. This heat wave is due to a persistent ridge of high pressure over the area. Cooler than normal conditions are restricted to the northern coast of Australia. |
 larger image |
 larger image |
Temperatures averaged 2-4 degrees C above normal across the majority of the southeastern U.S. The warmest anomalies occurred across the lower Mississippi River valley. This agrees with the predicted La Nina pattern where high pressure usually dominates the area. |
| Several areas across the African continent showed departures from their mean surface wetness. The largest positive anomalies occurred over northwest Africa where abundant rainfall and snowcover (higher elevations) was prevalent during the month. Dry conditions continue in portions of the highlands of Ethiopia and Kenya. More importantly, the rainy season across portions of Namibia, Botswana, South Africa and Zimbabwe is deficient this month. In contrast, during January 1998, rainfall was abundant over much of the same area. This contrasting signal corresponds to the change from a strong El Nino to a current La Nina pattern. |
 larger image |
 larger image |
Low precipitation, combined with high temperatures, has worsened a drought over southeastern China; this is the same area that was hit with devastating floods during the summer of 1998. North central India was drier than normal, although this region does not normally receive much precipitation during this time of year. The lower Ganges river valley exhibited above normal wetness which is beneficial to crop production. Above normal wetness was evident over northern Pakistan. |
| A good portion of southern Australia and New Zealand continue to be quite dry with some areas experiencing drought conditions. In contrast, wetter than normal conditions persist across portions of north coastal Australia. |
 larger image |
 larger image |
A good portion of the Ukraine and southern Russia were quite dry. Dry weather was also across portions of the Iberian peninsula, south central Europe, Jordan, Turkey, Syria and Iraq. Wetter than normal conditions were confined to portions of the British Isles, France , the Benelux region and portions of Sweden. Moisture was also above normal in the coastal areas of Morocco, Algeria and Tunisia |
| Wetter than normal conditions extended from north central Texas in the mid Ohio valley. It was also wetter than normal across portions of the Pacific Northwest coast which had numerous storm systems sweep in from the Pacific. In contrast, drier than normal conditions prevailed across southern Texas and interior portions of the west. The signal in the Great Lakes region was contaminated by the deep snowcover and in the southeast by deciduous forests: in bothg areas precipitation was above normal. |
 larger image |
 larger image |
Snow cover across the southern Rockies and lower Ohio valley was well below normal. Snowfall was well above normal in portions of the east into New England with record snowfall associated with the "blizzard of 1999" across portions of the Great Lakes. Record snow cover was also reported in the southern San Joaquin valley with some places having in excess of 3.0 inches during the month, elsewhere across the west snowcover was quite variable. |
| Warmer, drier conditions prevailed across northeast and north central China which lead to below normal snowfall in that area, in extreme western China in the Altun Shan region snowfall was above normal. Snow cover was also below normal in extreme northwestern China in the Tian Shan region and also in the area east of the Caspian Sea. |
 larger image |
 larger image |
Snowcover was well below normal in the area around the northern half of the Caspian Sea, portions of the Black Sea and portions of Poland and Germany Above normal snowfall fell across portions of the northwestern Ukraine, parts of Italy and Spain and in the Atlas mountains of Morocco. |
References:
Basist, A., N.C. Grody, T.C. Peterson and C.N. Williams, 1998:
Using the Special Sensor Microwave/Imager to Monitor Land Surface
Temperatures, Wetness, and Snow Cover. Journal of Applied
Meteorology, 37, 888-911.
 NOAA's National Centers for Environmental Information
